Key Highlights
- GBP/USD corrected gains and tested the 1.3450 support.
- A declining channel is forming with resistance at 1.3560 on the 4-hour chart.
- Gold prices are moving lower below the $4,650 support.
- The US GDP could grow by 2.3% in Q1 2026 (Preliminary).
GBP/USD Technical Analysis
The British Pound started a downside correction from 1.3600 against the US Dollar. GBP/USD dipped below the 1.3560 and 1.3550 levels.
Looking at the 4-hour chart, the pair declined toward the 38.2% Fib retracement level of the upward move from the 1.3177 swing low to the 1.3599 high. However, it is still stable above the 100 simple moving average (red, 4-hour) and the 200 simple moving average (green, 4-hour).
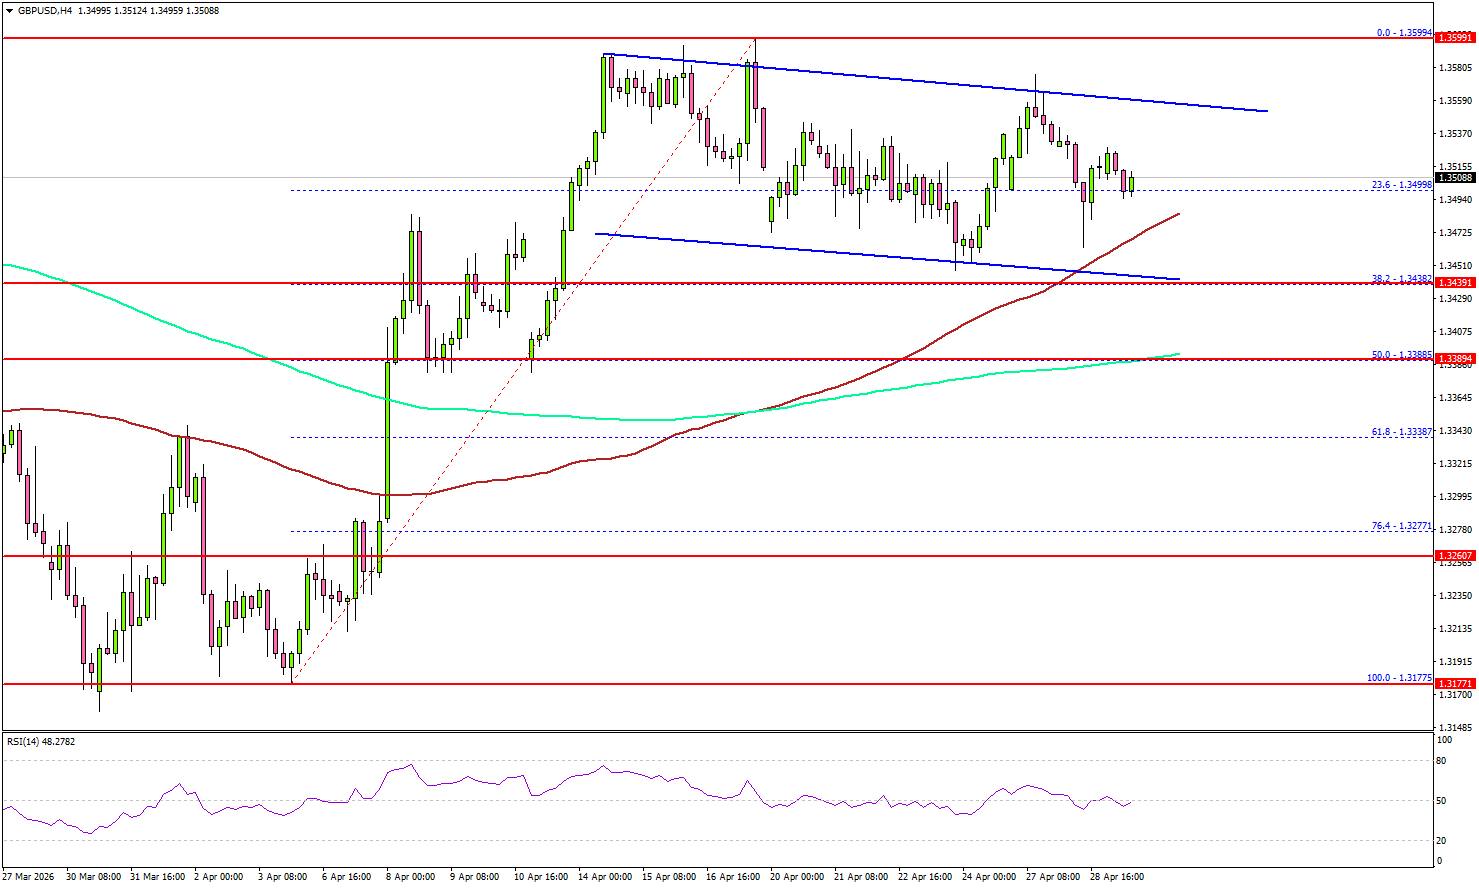
Besides, there is a declining channel forming with resistance at 1.3560. On the upside, the pair faces resistance at 1.3540. The first major resistance sits at 1.3560.
The main resistance could be 1.3600. A close above 1.3600 could open doors for gains above 1.3620. In the stated case, the bulls could aim for a move to 1.3750.
Immediate support is seen near 1.3470 and the 100 simple moving average (red, 4-hour). The next support could be 1.3385 and the 200 simple moving average (green, 4-hour). It coincides with the 50% Fib retracement level of the upward move from the 1.3177 swing low to the 1.3599 high.
A close below 1.3385 might push the pair toward 1.3330. Any more losses could initiate a fresh move to 1.3250 in the coming days.
Looking at Gold, the bears seem to be in action, and they could aim for a move toward the $4,420 level in the coming days.
Upcoming Key Economic Events:
- BoE Interest Rate Decision – Forecast 3.75%, versus 3.75% previous.
- US Initial Jobless Claims – Forecast 215K, versus 214K previous.
- US Gross Domestic Product for Q1 2026 (Preliminary) – Forecast 2.3% versus previous 0.5%.