XAU/USD Analysis Today 30/10: Gold Up Pre-Data (Chart)

  • Gold prices have risen sharply ahead of the US presidential election on November 5 and a series of key economic data releases due later this week.
  • Furthermore, price approached record highs earlier in the session as traders shrugged off easing geopolitical tensions in the Middle East.
  • At the time of writing, gold prices rose to the resistance level of $2,782 per ounce, the highest in the history of the gold market and the closest point to the upcoming historical resistance level of $2,800 per ounce.

XAU/USD Analysis Today 30/10: Gold Up Pre-Data (Chart)

At the beginning of this week’s trading, according to gold trading companies, gold prices came under pressure as the Israeli attack on Iran over the weekend had a limited impact as it did not target any oil or nuclear sites. However, safe-haven demand for the yellow metal remains intact ahead of next week’s US elections. Uncertainty over the outcome, which will determine US policy for the next four years, has kept traders on their toes.

US Election Tension

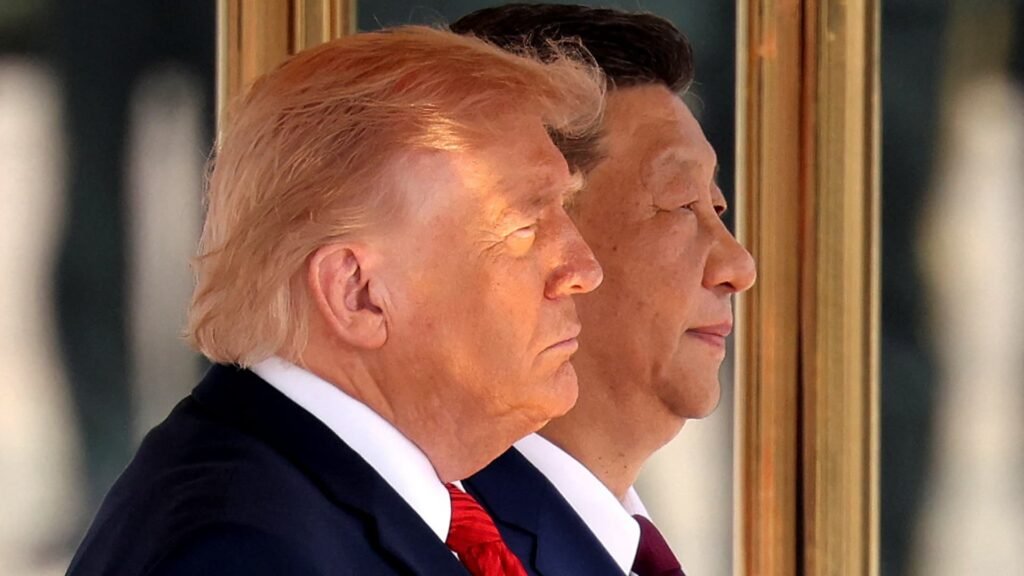
The uncertainty surrounding next week’s elections could shape gold prices. Most opinion polls show former US President Donald Trump ahead of Vice President Kamala Harris. However, analysts believe the race will be close. Overall, the continued safe-haven demand stemming from tensions in the Middle East and US election tensions continues to act as a tailwind for the precious metal. Should Trump win, concerns over a trade war with China would increase safe-haven demand for gold. Moreover, Trump could also ease sanctions on Russia, while doubling them in Iran.

Economic Data in Focus

Traders are also focusing on the release of third-quarter GDP data from the US on Thursday. Additionally, the Personal Consumption Expenditures (PCE) index, the preferred measure of the US Federal Reserve, will be released on Friday, along with non-farm payrolls data. All of these data are due ahead of the US Federal Reserve’s policy meeting next week. If the data shows further economic slowdown, it could herald further interest rate cuts in the US.

Meanwhile, lower interest rates increase demand for non-yielding metals such as gold and silver.

According to the CME FedWatch tool, traders are pricing in a 95% chance of the US Federal Reserve cutting interest rates by 25 basis points at its November meeting. At its September meeting, the Fed cut rates by 50 basis points, surprising the market.

Gold Price Analysis and forecast Today:

According to gold price forecast experts, gold prices are facing resistance at $2,770-2,775 per ounce. If prices break above $2,775 per ounce, the yellow metal could rally to $2,800 per ounce after that. Overall, COMEX gold prices have gained more than 30% since the beginning of this year. However, the Relative Strength Index (RSI) on the daily chart is about to break into the overbought zone and warrants some caution from bulls. Therefore, it would be wise to wait for some near-term neutrality or a modest pullback before placing any further discretionary move in the near term.

Ready to trade today’s Gold forecast? Here are the best Gold brokers to choose from.

Source link

Visited 5 times, 1 visit(s) today

Related Article

BulkQuant Launches AI Trading Bot for Crypto, Forex, and Stock Markets

BulkQuant Launches AI Trading Bot for Crypto, Forex, and Stock Markets

London, United Kingdom, May 15, 2026 (GLOBE NEWSWIRE) — BulkQuant has officially launched its AI trading bot platform designed for crypto, forex, and stock market traders seeking a simpler way to automate trading strategies across multiple financial markets. The platform combines AI-powered quantitative analysis, automated trade execution, portfolio monitoring, and adaptive risk management into a

Youtube preview

Four reasons for USD strength – Gold, Silver in symmetrical pennants [Video]

In today’s Market Outlook, let’s take a look at Forex Trading on WTI Crude Oil, Gold, XAU/USD, Silver, GBP/USD, NZD/USD, and EUR/USD. We see USD strength right across the board, and it’s really important for traders and investors to understand why. Firstly, we just saw the latest CPI and PPI; in other words, Inflation figures

GBP/USD: Sterling Under Pressure Despite Strong GDP Data

GBP/USD: Sterling Under Pressure Despite Strong GDP Data

Fundamental Background UK GDP grew by 0.6% in the first quarter of 2026, notably above the revised 0.2% reading recorded in the fourth quarter of 2025. The main contribution came from the services sector, which expanded by 0.8%. Nevertheless, strong macroeconomic data failed to support sterling: CPI inflation accelerated to 3.3% year-on-year in March, up

XAUUSD Elliott Wave Update: Gold in Expanded Flat Correction

XAUUSD Elliott Wave Update: Gold in Expanded Flat Correction

After completing the correction at $4098.74 on the March 23 low, Gold (XAUUSD) initiated a rally in a clear impulsive structure. From that level, wave (1) advanced and concluded at $4890.97. The subsequent pullback in wave (2) finished at $4500.46, as reflected in the one‑hour chart. Following this retracement, the metal resumed its upward movement

USD/JPY Recovery Nears Make-Or-Break Moment For Trend Direction

USD/JPY Recovery Nears Make-Or-Break Moment For Trend Direction

Key Highlights USD/JPY started a decent upward move above 157.20. A key rising channel is forming with support at 157.65 on the 4-hour chart. EUR/USD could extend losses if it settles below 1.1650. GBP/USD corrected some gains and might revisit 1.3300. USD/JPY Technical Analysis The US Dollar remained supported and recovered above 157.00 against the

US Retail Sales Rise 0.5% in April, Reinforcing Resilient Demand

US Retail Sales Rise 0.5% in April, Reinforcing Resilient Demand

US retail sales rose 0.5% mom in April, matching market expectations and reinforcing the view that consumer demand remains resilient despite rising inflation pressures and elevated interest rates. Core readings were slightly firmer, with retail sales excluding autos rising 0.7% mom, above expectations of 0.6% mom, suggesting underlying household spending momentum remains relatively healthy. The

Trump-Xi Summit Fails to Convince Oil Markets on Hormuz

Trump-Xi Summit Fails to Convince Oil Markets on Hormuz

Risk sentiment remained broadly stable on Thursday as US equity futures edged higher alongside European stocks, extending the optimistic tone already dominating global markets this week. But while equities continued drifting along the existing AI- and liquidity-driven rally, oil markets delivered a far more cautious verdict on the opening phase of the Trump-Xi summit in

Interactive Brokers launches unified interface for trading prediction markets across Kalshi, CME Group, and ForecastEx

Interactive Brokers launches unified interface for trading prediction markets across Kalshi, CME Group, and ForecastEx

Electronic trading major Interactive Brokers Group, Inc (NASDAQ:IBKR) today announced the launch of a first-of-its-kind unified interface for trading prediction markets across three leading US prediction market platforms — Kalshi, CME Group, and ForecastEx. IBKR’s Prediction Markets offering enables investors to access and trade contracts across all three prediction market exchanges from a single platform,

FxPro launches Discover Hub on its mobile app

FxPro launches Discover Hub on its mobile app

Online trading company FxPro today announced the launch of Discover Hub on its mobile app. Built to help traders uncover opportunities faster and stay informed, the new tab combines two powerful Trading Central features in one place. Trading Signals Users can access actionable signals across multiple asset classes and filter by market group. Each signal

What Is the Petrodollar? System, History & Collapse Explained | LiteFinance

What Is the Petrodollar? System, History & Collapse Explained

2026.05.14 2026.05.14 What Is the Petrodollar and How Does It Affect the Global Economy? Gleb Kabanovhttps://www.litefinance.org/blog/authors/gleb-kabanov/ What is the petrodollar, and why has this concept shaped the architecture of the global economy for decades? The term describes a mechanism in which oil is traded mainly in US dollars, while oil exporters reinvest their oil revenues

Technical Analysis of US Crude, XAUUSD, and EURUSD for Today (May 13, 2026)

Technical Analysis of US Crude, XAUUSD, and EURUSD for Today (May 13, 2026)

2026.05.13 2026.05.13 Short-Term Analysis for Oil, Gold, and EURUSD for 13.05.2026 Alex Rodionovhttps://www.litefinance.org/blog/authors/alex-rodionov/ Welcome, my fellow traders! I have prepared a price forecast for the USCrude, XAUUSD, and EURUSD using a combination of the margin zones method and technical analysis. Based on the market analysis, I suggest entry signals for intraday traders. After climbing yesterday,

Silver's Momentum Stalls Below $90, but Bigger Breakout Risks Are Building

Silver’s Momentum Stalls Below $90, but Bigger Breakout Risks Are Building

Silver briefly pushed above the $89 level this week before losing some momentum ahead of $90 psychologically mark. Yet this pause appears more like consolidation than exhaustion. And, the most important signal in Silver right now is the fact that the rally continueed despite hotter US inflation data and rising expectations for tighter Federal Reserve

EUR/USD and GBP/USD Return to Ranges Ahead of Key Data

EUR/USD and GBP/USD Return to Ranges Ahead of Key Data

European currencies have moved into a corrective phase following recent gains, while market participants focus on upcoming macroeconomic data from the UK, the eurozone and the United States. After a strong upward move, both currencies returned to their previous trading ranges, signalling a shift towards consolidation ahead of important economic releases. Additional pressure on the

GBP/USD Reversal Triggers Bearish Pressure, $1.3450 In Focus

GBP/USD Reversal Triggers Bearish Pressure, $1.3450 In Focus

Key Highlights GBP/USD was rejected near the 1.3650 resistance. It traded below a bullish trend line with support at 1.3580 on the 4-hour chart. EUR/USD could struggle to stay above 1.1650 if it remains below 1.1750. USD/JPY is showing signs of more upside above the 158.00 resistance. GBP/USD Technical Analysis The British Pound failed to

AUD/USD Hourly Chart

What It Is & How It Works (2026 Guide)

No strategy works every time, but some are more beginner-friendly than others. These three are the forex trading strategies worth starting with. Trend Following The idea is to trade in the direction the market is already moving. If a currency pair is making higher highs and higher lows on a daily or 4-hour chart, the

US PPI Surges to Highest Since 2022 as Upstream Inflation Pressures Intensify

US PPI Surges to Highest Since 2022 as Upstream Inflation Pressures Intensify

US producer prices surged far more than expected in April, reinforcing concerns that inflation pressures are broadening across the economy and strengthening the case for the Federal Reserve to keep policy restrictive for longer. Headline PPI rose 1.4% mom, accelerating from 0.7% mom previously and well above expectations of 0.5% mom. The increase marked the

0
Would love your thoughts, please comment.x
()
x