Gold Stabilizes, Market Prepares For Next Decisive Move

Key Highlights

  • Gold started a fresh increase above the $4,700 zone.
  • A key contracting triangle is forming with resistance at $4,900 on the 4-hour chart.
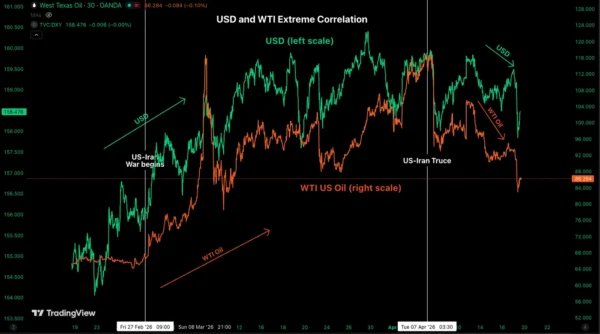
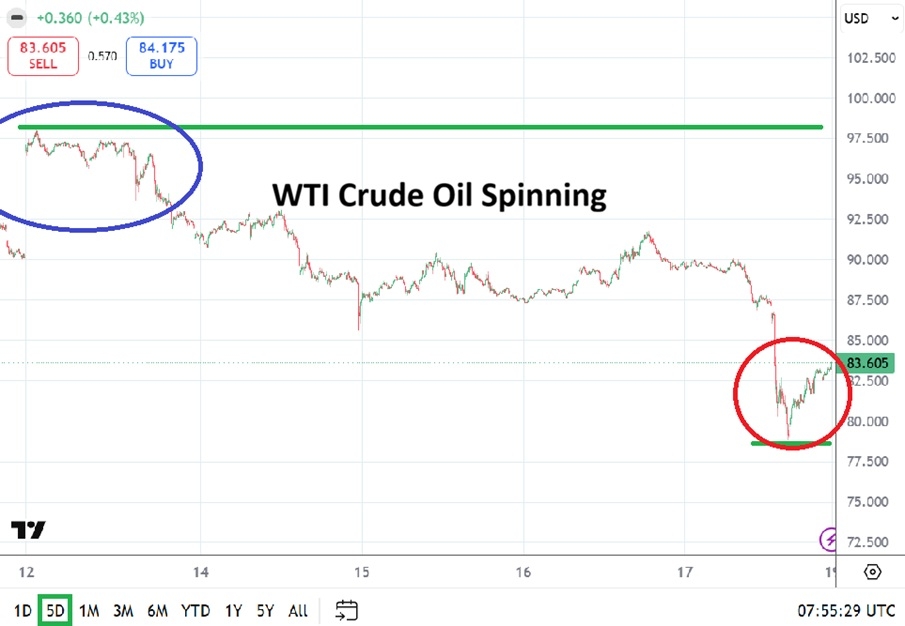
  • WTI Crude Oil tested $83.00 and recently recovered some losses.
  • EUR/USD failed to stay above 1.1820 and corrected gains.

Gold Price Technical Analysis

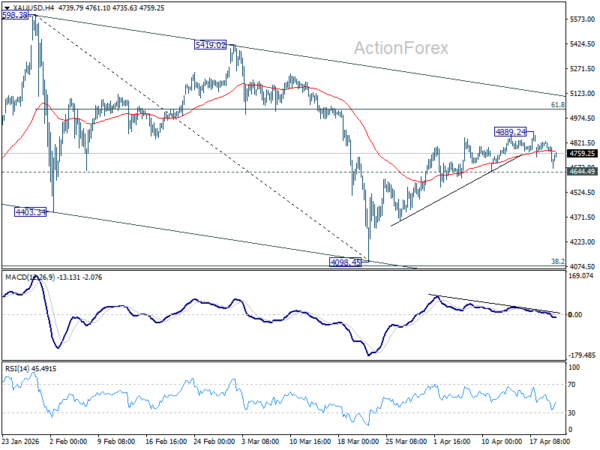
Gold reclaimed the $4,550 pivot level and started a fresh increase against the US Dollar. The price cleared the $4,620 and $4,700 resistance levels.

The 4-hour chart of XAU/USD indicates that the price even surpassed the $4,800 resistance zone and the 100 Simple Moving Average (red, 4 hours). Finally, the bears appeared near the $4,890 zone. The price trimmed some gains and traded below $4,800.

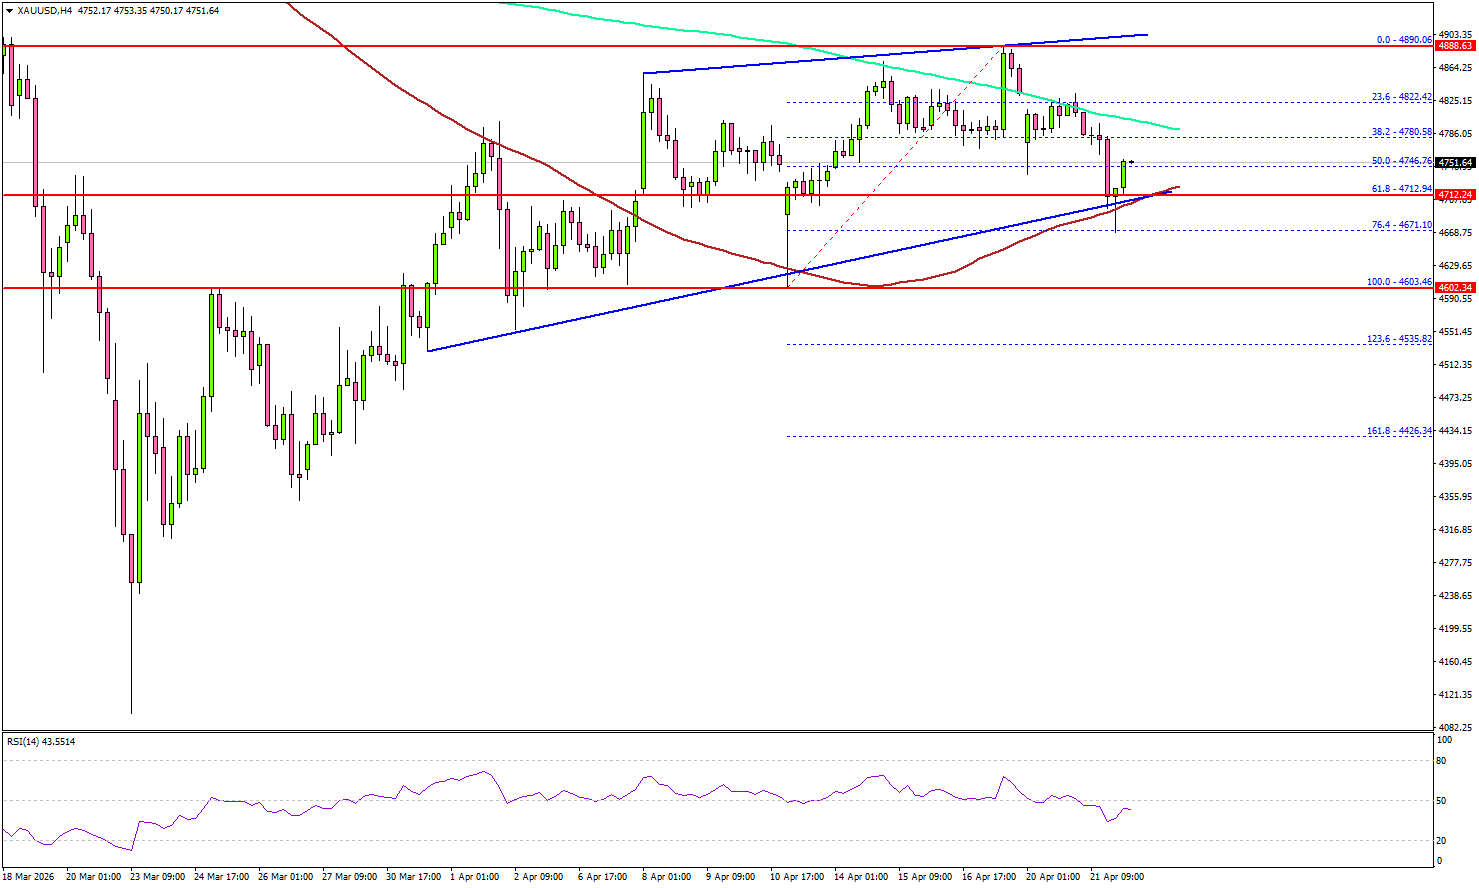
There was a move below the 200 Simple Moving Average (green, 4 hours). If there is another decline, Gold might find bids near the $4,740 level. The first major support sits at $4,710 and the 100 Simple Moving Average (red, 4 hours).

The next support could be $4,600, below which the price might slide to $4,550. The main support sits at $4,425. Any more losses might call for a test of $4,200 or even $4,120 in the coming days.

On the upside, immediate resistance is $4,820. The next major resistance sits near $4,880. The main resistance could be near the trend line at $4,900. There is also a key contracting triangle forming with resistance at $4,900.

A clear move above $4,900 could open the doors for more upside. In the stated case, the bulls could aim for a move toward $5,000 or even $5,200.

Looking at WTI Crude Oil, the price declined further toward $83.00 before the bulls stepped in and protected more losses.

Economic Releases to Watch Today

  • UK Consumer Price Index for March 2026 (YoY) – Forecast +3.3%, versus +3.0% previous.
  • UK Core Consumer Price Index for March 2026 (YoY) – Forecast +3.2%, versus +3.2% previous.

Source link

Visited 1 times, 1 visit(s) today

Related Article

Gold and Silver Recover as US Extends Iran Ceasefire, But Technical Weakness Emerges

Gold and Silver Recover as US Extends Iran Ceasefire, But Technical Weakness Emerges

Gold and Silver stabilized after the US extended the Iran ceasefire, cushioning markets from immediate escalation fears and preventing a deeper selloff. The move offset earlier weakness triggered by the cancellation of JD Vance’s planned diplomatic trip. However, technical developments suggest both metals are becoming increasingly vulnerable to a near-term bearish reversal, with selling likely

14 cheated of Rs 2cr in forex trading lure; 3 of family booked

14 cheated of Rs 2cr in forex trading lure; 3 of family booked | Surat News

Surat: Three members of a family allegedly cheated at least 14 people of Rs 2.05 crore after luring them with promises of high returns from forex trading.Three accused members of a family, including a woman, allegedly cultivated trust among locals by frequently visiting a temple in Dabholi and projecting an image of wealth. They would

CHFJPY Achieves New Highs from Blue Box Zone

CHFJPY Achieves New Highs from Blue Box Zone

In this technical blog, we will look at the past performance of the 4-hour Elliott Wave Charts of CHFJPY. In which, the rally from September 2024 low is unfolding as an impulse sequence. Therefore, called for more upside to take place. We knew that the structure in the pair should remains incomplete & should see

Dollar Forecasting Tougher Times Ahead – EUR/USD, AUD/USD & Dollar Index (DXY) Overview

Dollar Forecasting Tougher Times Ahead – EUR/USD, AUD/USD & Dollar Index (DXY) Overview

The US Dollar has corrected quite severely since the announcement of the two-week ceasefire, and not without good cause. The infamous Petrodollar trade has gripped financial markets on all sides since the beginning of the US-Iran-Israel conflict, particularly amid the rise in Crude Oil to 4-year highs. The USD has historically held a decent correlation

xauusd-210426mahmoud.jpeg

Bearish Bias Ahead of Potential US-Iran Talks (chart)

Created on April 21, 2026 Today’s Gold Analysis Overview: The Overall Gold Trend: Neutral with a bearish bias. Today’s Gold Support Points: $4765 – $4720 – $4680 per ounce. Today’s Gold Resistance Points: $4830 – $4880 – $4925 per ounce. Today’s Gold Trading Signals: Note: These recommendations are suitable for medium-to-long-term traders, provided there is

US Retail Sales Surge 1.7% mom in March, Core Spending Signals Resilient Demand

US Retail Sales Surge 1.7% mom in March, Core Spending Signals Resilient Demand

US retail sales rose 1.7% mom to USD 752.1B in March, beating expectations of 1.3% mom and pointing to stronger-than-anticipated consumer demand. Ex-auto sales climbed 1.9% mom to USD 612.4B, also above forecasts of 1.3% mom. However, the composition shows a more nuanced picture. Sales excluding both autos and gasoline rose just 0.6% mom, indicating

EUR/USD Mid-Day Outlook - ActionForex

EUR/USD Mid-Day Outlook – ActionForex

Daily Pivots: (S1) 1.1746; (P) 1.1768; (R1) 1.1809; More…. EUR/USD is still bounded in consolidations below 1.1848 and intraday bias remains neutral. With 1.1662 support intact, further rally is in favor. On the upside, sustained trading above 61.8% retracement of 1.2081 to 1.1408 at 1.1824 will pave the way to retest 1.2081 high. However, firm

USD/CHF Mid-Day Outlook - ActionForex

USD/CHF Mid-Day Outlook – ActionForex

Daily Pivots: (S1) 0.7759; (P) 0.7800; (R1) 0.7824; More…. Intraday bias in USD/CHF remains neutral as consolidations continues above 0.7774. Upside of recovery should be limited below 0.7933 resistance to bring another fall. Sustained break of 61.8% retracement of 0.7603 to 0.8041 at 0.7770 will resume the decline from 0.8041 to retest 0.7603 low. In

AUD/USD and NZD/USD Flash Early Signs of Bullish Recovery

AUD/USD and NZD/USD Flash Early Signs of Bullish Recovery

AUD/USD is attempting a fresh increase from 0.7115. NZD/USD is consolidating and could aim for a move above 0.5930 in the short term. Important Takeaways for AUD/USD and NZD/USD Analysis Today The Aussie Dollar remained supported above 0.7100 and recovered losses against the US Dollar. There is a rising channel forming with resistance at 0.7200

Markets Hold Near Highs as Traders Avoid Fading Potential US–Iran De-Escalation

Markets Hold Near Highs as Traders Avoid Fading Potential US–Iran De-Escalation

The US markets are holding near record highs, not because conviction in de-escalation is strong, but because traders are unwilling to fade the possibility of last-minute progress or extension in US–Iran negotiations. The price action reflects hesitation rather than optimism, with risk assets supported but not advancing. S&P 500 and NASDAQ hovered close to their

EUR/USD Daily Outlook - ActionForex

EUR/USD Daily Outlook – ActionForex

Daily Pivots: (S1) 1.1733; (P) 1.1792; (R1) 1.1823; More…. Intraday bias in EUR/USD remains neutral for the moment, and some consolidations would be seen below 1.1848. Further rally is in favor as long as 1.1662 support holds. On the upside, sustained trading above 61.8% retracement of 1.2081 to 1.1408 at 1.1824 will pave the way

Murex: AI, market volatility, and settlement shifts reshape FX trading - The DESK

Murex: AI, market volatility, and settlement shifts reshape FX trading – The DESK

Marc Natale, global head of sales engineering and marketing at Murex speaks to TraderTV.   Foreign exchange markets are undergoing substantial change, driven by rising market volatility, the evolving settlement landscape, and advancements in AI. Speaking to Trader TV at this year’s TradeTech FX in Miami, Marc Natale, global head

How crypto collateral is changing forex margin practices - 2

How crypto collateral is changing forex margin practices

Disclosure: This article does not represent investment advice. The content and materials featured on this page are for educational purposes only. Crypto-backed collateral reshapes forex margin trading with greater flexibility for traders. Summary Crypto-backed margin trading is enabling traders to use digital assets as collateral for leveraged forex positions. Growing adoption of crypto collateral is

Exclusive: Retail options trading app Investa gets FCA license

Exclusive: Retail options trading app Investa gets FCA license

FNG Exclusive… FNG has learned that Investa, the recently launched financial app looking to make options trading easier for retail traders, has received a license from the UK FCA. Investa Markets Ltd was formally granted an FCA license on Friday, April 17. Since its launch in 2024, Investa has acted as an appointed representative of

US-Iran Ceasefire Frays as Tensions Rise; Dollar Firms While Markets Hold Steady

US-Iran Ceasefire Frays as Tensions Rise; Dollar Firms While Markets Hold Steady

Markets began the week with a measured response to intensifying US–Iran tensions, even as the ceasefire showed visible signs of strain. The Dollar edged higher and oil prices rebounded, but broader markets remained composed, indicating that investors are not yet pricing a full shift toward conflict. The retreat of the “peace trade” is evident but

EUR/USD Dips Draw Interest, Bulls Prepare to Step In

EUR/USD Dips Draw Interest, Bulls Prepare to Step In

Key Highlights EUR/USD gained bullish pace for a move above the 1.1800 zone. A major bullish trend line is forming with support at 1.1680 on the 4-hour chart. GBP/USD climbed toward 1.3620 before correcting some gains. WTI Crude Oil prices are under pressure below $93.20 and $92.50. EUR/USD Technical Analysis The Euro remained elevated above

Crude Oil Weekly Forecast - 19/04: Lower Value (Chart)

Crude Oil Weekly Forecast – 19/04: Lower Value (Chart)

Created on April 19, 2026 Day traders may feel as if last week was an opportunity to ride momentum lower in WTI Crude Oil, but be unsure of where things are going next. After essentially starting the past Monday with a spike higher that put the commodity at nearly $97, this after closing the prior

Weekly Forex Forecast - 19th to 24th April 2026 (Charts)

Weekly Forex Forecast – 19th to 24th April 2026 (Charts)

I wrote on 12th April that the best trades for the week would be: Long of the USD/JPY currency pair following a daily (New York) close above ¥160. Long of Brent Crude Futures in the small chance we get a daily close above $112.50. Neither of these trades set up. A summary of last week’s

GBP/USD Weekly Forecast - 19/04: Under Pressure (Chart)

GBP/USD Weekly Forecast – 19/04: Under Pressure (Chart)

Created on April 19, 2026 The GBP/USD went into this weekend near the 1.35177 mark, essentially near a ratio the currency pair was traversing just before the start of the Iranian war. The GBP/USD did touch a high of nearly 1.36000 earlier on Friday before stumbling back to marks it had traded on Thursday. The

0
Would love your thoughts, please comment.x
()
x