GBP/USD Weekly Forecast – 19/04: Under Pressure (Chart)

The GBP/USD went into this weekend near the 1.35177 mark, essentially near a ratio the currency pair was traversing just before the start of the Iranian war. The GBP/USD did touch a high of nearly 1.36000 earlier on Friday before stumbling back to marks it had traded on Thursday. The finish to the week in the GBP/USD did correlate with the broad Forex market.

Technical charts for day traders will certainly show what the results have been regarding price swings in the GBP/USD, and it can be argued they show the reactions of financial institutions. However, what they also show is the speed of the velocity still being seen in Forex and reactionary behavioral sentiment that remains anxious.

The ability to test highs last week didn’t achieve some type of record valuations for the British Pound, they merely touched values seen in late February and remain below prices demonstrated in the middle of February and certainly those seen in January.

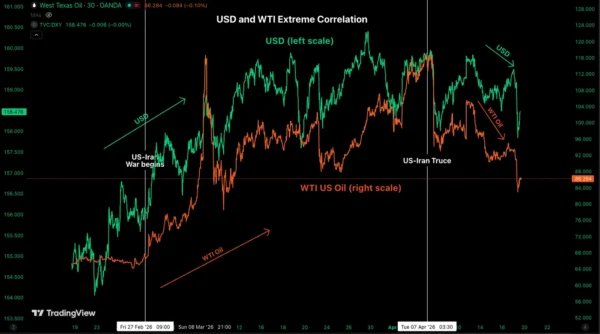
Some analysts may be extolling the virtues of their mid-term viewpoints, but day traders and even financial institutions having to pick a direction in the GBP/USD in the short and near-term remain perplexed by the sudden shifts of outlook which continue to be highlighted. The price of WTI Crude Oil remains an important fixture for global assets as traders judge their risk appetite according to developing news from the Middle East saga.

Table of prices GBP/USD 19/04/2026

Noise from the U.S While House and from Iran continue at a rapid pace. The lack of any real knowledge about what is going on in the Strait of Hormuz as of this writing is rather important. While the White House claims one story regarding the navigation capabilities of the waterway, the Iranians are claiming another. The lack of information going into early trading on Monday may cause knock-on effects not only in Crude Oil, but Forex as well. Meaning trading in the GBP/USD will remain under the threat of volatile possibilities as the week opens.

The ability to reach a high of 1.36000 this past Friday was important as a sign of optimism. If the situation in Iran can reach the prospect for a more positive conclusion it will certainly ignite more risk taking as investors dive into the prospect of better results ahead in equity markets via the idea that energy costs will be lower.

  • However, if the Iranian situation starts to escalate once again, then the GBP/USD like all other currency pairs will start to show the likelihood of USD centric strength once again.

  • The highs reached in the GBP/USD could be challenged again, but the ability to traverse with speed as the weekend approached showed that financial institutions remain cautious about what could transpire when they are away from the office.

Speculative price range for GBP/USD is 1.33800 to 1.36250

The GBP/USD like all of Forex is moving on a risk on / risk off venue that is being determined with lightning speed due to the developments from the Middle East. The GBP/USD certainly showed the capability of building buying momentum towards the end of last week as optimistic banter was heard about the capability of WTI Crude Oil trading at lower values.

Tomorrow’s opening in the GBP/USD will be volatile like the past handful of weeks, this as large traders return to the markets after a weekend of digesting the news. The question is if they will be suffering from indigestion or will they be feeling calm. The next 24 hours via the news cycle will determine the volatility that will be the result of noise coming from the U.S White House and Iran. Day traders need to remain careful under the current circumstances.

Ready to trade our weekly forecast? Check out the best forex trading company in UK worth using.

Source link

Visited 1 times, 1 visit(s) today

Related Article

EUR/GBP Daily Outlook - ActionForex

EUR/GBP Daily Outlook – ActionForex

Daily Pivots: (S1) 0.8657; (P) 0.8680; (R1) 0.8693; More… Intraday bias in EUR/GBP is back on the downside with break of 0.8675 support. Rebound from 0.8610 could have completed at 0.8740 already. Deeper fall would be seen back to retest 0.8610 low. On the paused, above 0.8692 minor resistance will turn intraday bias neutral again

Nasdaq Breaks a New Record after Ceasefire Extension – Dow Jones and US Stock Market Outlook

Nasdaq Breaks a New Record after Ceasefire Extension – Dow Jones and US Stock Market Outlook

US Stock Benchmarks corrected yesterday from a reappearing angst regarding the Ceasefire and Kevin Warsh’s hawkish hearing Donald Trump saved the day by announcing yet another short-term extension to the Ceasefire Exploring Technical Levels for the Dow Jones, Nasdaq and S&P 500 US stock benchmarks experienced a sharp correction yesterday, dragged down by reappearing angst

Bitcoin Extends Gains, Can Bulls Drive A Larger Rally?

Bitcoin Extends Gains, Can Bulls Drive A Larger Rally?

Key Highlights Bitcoin started a fresh increase above $75,000 and $76,500. A bullish trend line is forming with support at $76,000 on the 4-hour chart of BTC/USD. Ethereum also climbed over 5% and surpassed $2,400. Gold is consolidating below the $4,850 resistance. Bitcoin Price Technical Analysis Bitcoin price remained supported above $74,000 against the US

EUR/CHF Daily Outlook - ActionForex

EUR/CHF Daily Outlook – ActionForex

Daily Pivots: (S1) 0.9157; (P) 0.9174; (R1) 0.9186; More…. Intraday bias in EUR/CHF remains neutral and range trading continues below 0.9264. Further rise is in favor with 0.9155 support intact. Firm break of 0.9264 will resume the rise from 0.8979 to 0.9394 resistance next. However, break of 0.9155 will turn bias back to the downside

gbpusd2204crispus.jpeg

Extremely Bullish Outlook Ahead of UK CPI Data (chart)

Created on April 22, 2026 Bullish view Bearish view The GBP/USD exchange rate wavered as market participants reacted to the latest UK jobs report and Kevin Warsh’s confirmation hearings in Washington. It was trading at 1.3510 on Wednesday as focus shifted to the upcoming UK inflation report. UK Consumer Inflation Report and Kevin Warsh Confirmation

usdsgd2204crispus.jpeg

On the Cusp of a Bearish Break (chart)

Created on April 22, 2026 The USD/SGD exchange rate has remained under pressure in the past few weeks as the US dollar has softened recently. It was trading at 1.2725 on Wednesday, down from the year-to-date high of 1.2925. Singapore Dollar Gains as the Greenback Slips The USD/SGD exchange rate has remained in a downward

xauusd-220426mahmoud.png

Bearish Bias Holds Below $4850

Created on April 22, 2026 Today’s Gold Analysis Overview: The Overall Gold Trend: Bearish. Today’s Gold Support Points: $4690 – $4630 – $4570 per ounce. Today’s Gold Resistance Points: $4780 – $4830 – $4885 per ounce. Today’s Gold Trading Signals: Note: These recommendations are suitable for medium-to-long-term traders, provided there is strict adherence to capital

USD/JPY Pulls Higher: Yen Doubts Bank of Japan

USD/JPY Pulls Higher: Yen Doubts Bank of Japan

USD/JPY climbed to 159.36 mid-week, with the Japanese yen losing ground for a second consecutive day. The market is pricing in the Bank of Japan’s policy outlook ahead of next week’s meeting. The regulator is likely to keep rates unchanged while continuing to analyse the impact of the Middle East conflict on the economy. At

Split Personality Markets: Stocks Up, Oil Warns, Dollar Torn

Split Personality Markets: Stocks Up, Oil Warns, Dollar Torn

Markets are showing a clear “split personality” right now. Equities are pushing higher on the back of the extended US–Iran ceasefire, while oil continues to signal caution and Dollar is caught between opposing forces. The result is a fragmented picture where no single macro narrative is dominating. US futures are trading higher after President Donald

Republicans are Indirectly Backing a Tougher Fed Policy

Republicans are Indirectly Backing a Tougher Fed Policy

Congress is in no hurry to confirm Warsh. US-Iran talks have broken down. The US dollar has launched a counter-offensive thanks to the breakdown of US-Iran talks and a 1.7% month-on-month rise in retail sales in March. The economy is strong, oil prices are high and could rise even further, whilst the futures market is

USD/JPY Daily Outlook - ActionForex

USD/JPY Daily Outlook – ActionForex

Daily Pivots: (S1) 158.80; (P) 159.28; (R1) 159.87; More… Intraday bias in USD/JPY stays neutral as consolidation continues below 160.45. Further rise is expected with 157.49 cluster support (38.2% retracement of 152.25 to 160.45 at 157.31) intact. On the upside break of 160.45 will target a retest on 161.94 high. However, firm break of 157.31/49

Gold and Silver Recover as US Extends Iran Ceasefire, But Technical Weakness Emerges

Gold and Silver Recover as US Extends Iran Ceasefire, But Technical Weakness Emerges

Gold and Silver stabilized after the US extended the Iran ceasefire, cushioning markets from immediate escalation fears and preventing a deeper selloff. The move offset earlier weakness triggered by the cancellation of JD Vance’s planned diplomatic trip. However, technical developments suggest both metals are becoming increasingly vulnerable to a near-term bearish reversal, with selling likely

Gold Stabilizes, Market Prepares For Next Decisive Move

Gold Stabilizes, Market Prepares For Next Decisive Move

Key Highlights Gold started a fresh increase above the $4,700 zone. A key contracting triangle is forming with resistance at $4,900 on the 4-hour chart. WTI Crude Oil tested $83.00 and recently recovered some losses. EUR/USD failed to stay above 1.1820 and corrected gains. Gold Price Technical Analysis Gold reclaimed the $4,550 pivot level and

14 cheated of Rs 2cr in forex trading lure; 3 of family booked

14 cheated of Rs 2cr in forex trading lure; 3 of family booked | Surat News

Surat: Three members of a family allegedly cheated at least 14 people of Rs 2.05 crore after luring them with promises of high returns from forex trading.Three accused members of a family, including a woman, allegedly cultivated trust among locals by frequently visiting a temple in Dabholi and projecting an image of wealth. They would

CHFJPY Achieves New Highs from Blue Box Zone

CHFJPY Achieves New Highs from Blue Box Zone

In this technical blog, we will look at the past performance of the 4-hour Elliott Wave Charts of CHFJPY. In which, the rally from September 2024 low is unfolding as an impulse sequence. Therefore, called for more upside to take place. We knew that the structure in the pair should remains incomplete & should see

Dollar Forecasting Tougher Times Ahead – EUR/USD, AUD/USD & Dollar Index (DXY) Overview

Dollar Forecasting Tougher Times Ahead – EUR/USD, AUD/USD & Dollar Index (DXY) Overview

The US Dollar has corrected quite severely since the announcement of the two-week ceasefire, and not without good cause. The infamous Petrodollar trade has gripped financial markets on all sides since the beginning of the US-Iran-Israel conflict, particularly amid the rise in Crude Oil to 4-year highs. The USD has historically held a decent correlation

xauusd-210426mahmoud.jpeg

Bearish Bias Ahead of Potential US-Iran Talks (chart)

Created on April 21, 2026 Today’s Gold Analysis Overview: The Overall Gold Trend: Neutral with a bearish bias. Today’s Gold Support Points: $4765 – $4720 – $4680 per ounce. Today’s Gold Resistance Points: $4830 – $4880 – $4925 per ounce. Today’s Gold Trading Signals: Note: These recommendations are suitable for medium-to-long-term traders, provided there is

US Retail Sales Surge 1.7% mom in March, Core Spending Signals Resilient Demand

US Retail Sales Surge 1.7% mom in March, Core Spending Signals Resilient Demand

US retail sales rose 1.7% mom to USD 752.1B in March, beating expectations of 1.3% mom and pointing to stronger-than-anticipated consumer demand. Ex-auto sales climbed 1.9% mom to USD 612.4B, also above forecasts of 1.3% mom. However, the composition shows a more nuanced picture. Sales excluding both autos and gasoline rose just 0.6% mom, indicating

0
Would love your thoughts, please comment.x
()
x