AUD/USD and NZD/USD Flash Early Signs of Bullish Recovery

AUD/USD is attempting a fresh increase from 0.7115. NZD/USD is consolidating and could aim for a move above 0.5930 in the short term.

Important Takeaways for AUD/USD and NZD/USD Analysis Today

  • The Aussie Dollar remained supported above 0.7100 and recovered losses against the US Dollar.
  • There is a rising channel forming with resistance at 0.7200 on the hourly chart of AUD/USD at FXOpen.
  • NZD/USD is consolidating gains above 0.5900 and 0.5890.
  • There is a bullish trend line forming with support at 0.5890 on the hourly chart of NZD/USD at FXOpen.

AUD/USD Technical Analysis

On the hourly chart of AUD/USD at FXOpen, the pair formed a base above 0.7100. The Aussie Dollar started a decent increase above 0.7150 against the US Dollar to enter a short-term positive zone.

The bulls even pushed the pair above the 50% Fib retracement level of the downward move from the 0.7221 swing high to the 0.7114 low and the 50-hour simple moving average. The AUD/USD chart indicates that the pair could struggle to clear the 61.8% Fib retracement at 0.7180.

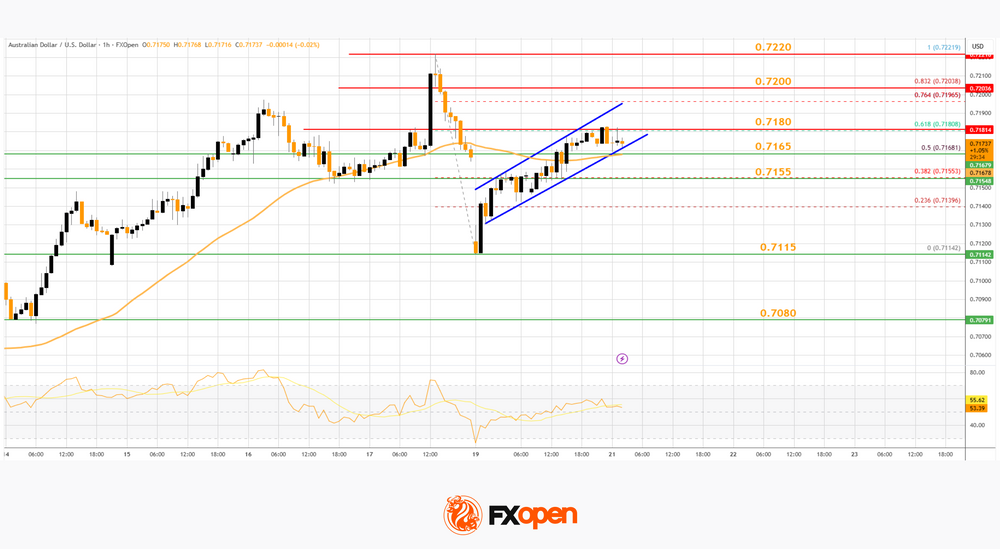
The first major hurdle for the bulls could be 0.7200. There is also a rising channel forming with resistance at 0.7200. An upside break above 0.7200 might send the pair further higher. The next major target might be 0.7220.

Any more gains could clear the path for a move toward 0.7300. If there is no close above 0.7200, the pair might start a fresh decline. Immediate bid zone could be near 0.7165 and the 50-hour simple moving average.

The next area of interest is 0.7155. If there is a downside break below 0.7155, the pair could extend its decline toward 0.7115. Any more losses might signal a move toward 0.7080.

NZD/USD Technical Analysis

On the hourly chart of NZD/USD on FXOpen, the pair also followed AUD/USD. The New Zealand Dollar failed to stay above 0.5920 and corrected gains against the US Dollar.

The pair dipped below 0.5900 and the 50-hour simple moving average. A low was formed at 0.5848, and the pair is now attempting to recover losses. There was a move above the 50% Fib retracement level of the downward move from the 0.5928 swing high to the 0.5848 low.

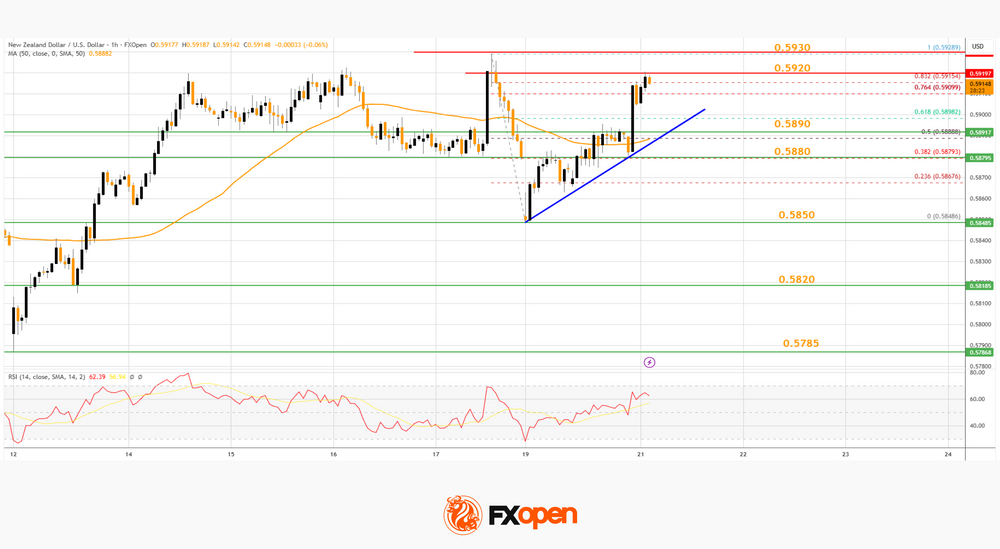
Besides, there is a bullish trend line forming with support at 0.5890. The NZD/USD chart suggests that the RSI is above 50, signaling a short-term positive bias. On the upside, the pair is facing resistance near 0.5920.

The next major hurdle for buyers could be near 0.5930. A clear move above 0.5930 might even push the pair toward 0.5950. Any more gains might clear the path for a move toward the 0.6000 pivot zone in the coming sessions.

On the downside, there is support forming near 0.5890 and the 50-hour simple moving average. If there is a downside break below 0.5890, the pair might slide toward 0.5850. Any more losses could lead NZD/USD into a bearish zone to 0.5820.

Trade over 50 forex markets 24 hours a day with FXOpen. Take advantage of low commissions, deep liquidity, and spreads from 0.0 pips (additional fees may apply). Open your FXOpen account now or learn more about trading forex with FXOpen.

This article represents the opinion of the Companies operating under the FXOpen brand only. It is not to be construed as an offer, solicitation, or recommendation with respect to products and services provided by the Companies operating under the FXOpen brand, nor is it to be considered financial advice.

Source link

Visited 1 times, 1 visit(s) today

Related Article

Robinhood gets in-principle approval to launch brokerage services in Singapore

Robinhood gets in-principle approval to launch brokerage services in Singapore

US neobroker Robinhood Markets Inc (NASDAQ:HOOD) has announced that in what it calls a milestone for its international expansion, the company has received in-principle approval (IPA) from the Monetary Authority of Singapore (MAS) to offer brokerage services. We had reported back in late 2024 that Robinhood was developing plans to open an APAC office headquartered in

EUR/GBP Daily Outlook - ActionForex

EUR/GBP Daily Outlook – ActionForex

Daily Pivots: (S1) 0.8657; (P) 0.8680; (R1) 0.8693; More… Intraday bias in EUR/GBP is back on the downside with break of 0.8675 support. Rebound from 0.8610 could have completed at 0.8740 already. Deeper fall would be seen back to retest 0.8610 low. On the paused, above 0.8692 minor resistance will turn intraday bias neutral again

Nasdaq Breaks a New Record after Ceasefire Extension – Dow Jones and US Stock Market Outlook

Nasdaq Breaks a New Record after Ceasefire Extension – Dow Jones and US Stock Market Outlook

US Stock Benchmarks corrected yesterday from a reappearing angst regarding the Ceasefire and Kevin Warsh’s hawkish hearing Donald Trump saved the day by announcing yet another short-term extension to the Ceasefire Exploring Technical Levels for the Dow Jones, Nasdaq and S&P 500 US stock benchmarks experienced a sharp correction yesterday, dragged down by reappearing angst

Bitcoin Extends Gains, Can Bulls Drive A Larger Rally?

Bitcoin Extends Gains, Can Bulls Drive A Larger Rally?

Key Highlights Bitcoin started a fresh increase above $75,000 and $76,500. A bullish trend line is forming with support at $76,000 on the 4-hour chart of BTC/USD. Ethereum also climbed over 5% and surpassed $2,400. Gold is consolidating below the $4,850 resistance. Bitcoin Price Technical Analysis Bitcoin price remained supported above $74,000 against the US

EUR/CHF Daily Outlook - ActionForex

EUR/CHF Daily Outlook – ActionForex

Daily Pivots: (S1) 0.9157; (P) 0.9174; (R1) 0.9186; More…. Intraday bias in EUR/CHF remains neutral and range trading continues below 0.9264. Further rise is in favor with 0.9155 support intact. Firm break of 0.9264 will resume the rise from 0.8979 to 0.9394 resistance next. However, break of 0.9155 will turn bias back to the downside

gbpusd2204crispus.jpeg

Extremely Bullish Outlook Ahead of UK CPI Data (chart)

Created on April 22, 2026 Bullish view Bearish view The GBP/USD exchange rate wavered as market participants reacted to the latest UK jobs report and Kevin Warsh’s confirmation hearings in Washington. It was trading at 1.3510 on Wednesday as focus shifted to the upcoming UK inflation report. UK Consumer Inflation Report and Kevin Warsh Confirmation

usdsgd2204crispus.jpeg

On the Cusp of a Bearish Break (chart)

Created on April 22, 2026 The USD/SGD exchange rate has remained under pressure in the past few weeks as the US dollar has softened recently. It was trading at 1.2725 on Wednesday, down from the year-to-date high of 1.2925. Singapore Dollar Gains as the Greenback Slips The USD/SGD exchange rate has remained in a downward

xauusd-220426mahmoud.png

Bearish Bias Holds Below $4850

Created on April 22, 2026 Today’s Gold Analysis Overview: The Overall Gold Trend: Bearish. Today’s Gold Support Points: $4690 – $4630 – $4570 per ounce. Today’s Gold Resistance Points: $4780 – $4830 – $4885 per ounce. Today’s Gold Trading Signals: Note: These recommendations are suitable for medium-to-long-term traders, provided there is strict adherence to capital

USD/JPY Pulls Higher: Yen Doubts Bank of Japan

USD/JPY Pulls Higher: Yen Doubts Bank of Japan

USD/JPY climbed to 159.36 mid-week, with the Japanese yen losing ground for a second consecutive day. The market is pricing in the Bank of Japan’s policy outlook ahead of next week’s meeting. The regulator is likely to keep rates unchanged while continuing to analyse the impact of the Middle East conflict on the economy. At

Split Personality Markets: Stocks Up, Oil Warns, Dollar Torn

Split Personality Markets: Stocks Up, Oil Warns, Dollar Torn

Markets are showing a clear “split personality” right now. Equities are pushing higher on the back of the extended US–Iran ceasefire, while oil continues to signal caution and Dollar is caught between opposing forces. The result is a fragmented picture where no single macro narrative is dominating. US futures are trading higher after President Donald

Republicans are Indirectly Backing a Tougher Fed Policy

Republicans are Indirectly Backing a Tougher Fed Policy

Congress is in no hurry to confirm Warsh. US-Iran talks have broken down. The US dollar has launched a counter-offensive thanks to the breakdown of US-Iran talks and a 1.7% month-on-month rise in retail sales in March. The economy is strong, oil prices are high and could rise even further, whilst the futures market is

USD/JPY Daily Outlook - ActionForex

USD/JPY Daily Outlook – ActionForex

Daily Pivots: (S1) 158.80; (P) 159.28; (R1) 159.87; More… Intraday bias in USD/JPY stays neutral as consolidation continues below 160.45. Further rise is expected with 157.49 cluster support (38.2% retracement of 152.25 to 160.45 at 157.31) intact. On the upside break of 160.45 will target a retest on 161.94 high. However, firm break of 157.31/49

Gold and Silver Recover as US Extends Iran Ceasefire, But Technical Weakness Emerges

Gold and Silver Recover as US Extends Iran Ceasefire, But Technical Weakness Emerges

Gold and Silver stabilized after the US extended the Iran ceasefire, cushioning markets from immediate escalation fears and preventing a deeper selloff. The move offset earlier weakness triggered by the cancellation of JD Vance’s planned diplomatic trip. However, technical developments suggest both metals are becoming increasingly vulnerable to a near-term bearish reversal, with selling likely

Gold Stabilizes, Market Prepares For Next Decisive Move

Gold Stabilizes, Market Prepares For Next Decisive Move

Key Highlights Gold started a fresh increase above the $4,700 zone. A key contracting triangle is forming with resistance at $4,900 on the 4-hour chart. WTI Crude Oil tested $83.00 and recently recovered some losses. EUR/USD failed to stay above 1.1820 and corrected gains. Gold Price Technical Analysis Gold reclaimed the $4,550 pivot level and

14 cheated of Rs 2cr in forex trading lure; 3 of family booked

14 cheated of Rs 2cr in forex trading lure; 3 of family booked | Surat News

Surat: Three members of a family allegedly cheated at least 14 people of Rs 2.05 crore after luring them with promises of high returns from forex trading.Three accused members of a family, including a woman, allegedly cultivated trust among locals by frequently visiting a temple in Dabholi and projecting an image of wealth. They would

CHFJPY Achieves New Highs from Blue Box Zone

CHFJPY Achieves New Highs from Blue Box Zone

In this technical blog, we will look at the past performance of the 4-hour Elliott Wave Charts of CHFJPY. In which, the rally from September 2024 low is unfolding as an impulse sequence. Therefore, called for more upside to take place. We knew that the structure in the pair should remains incomplete & should see

Dollar Forecasting Tougher Times Ahead – EUR/USD, AUD/USD & Dollar Index (DXY) Overview

Dollar Forecasting Tougher Times Ahead – EUR/USD, AUD/USD & Dollar Index (DXY) Overview

The US Dollar has corrected quite severely since the announcement of the two-week ceasefire, and not without good cause. The infamous Petrodollar trade has gripped financial markets on all sides since the beginning of the US-Iran-Israel conflict, particularly amid the rise in Crude Oil to 4-year highs. The USD has historically held a decent correlation

xauusd-210426mahmoud.jpeg

Bearish Bias Ahead of Potential US-Iran Talks (chart)

Created on April 21, 2026 Today’s Gold Analysis Overview: The Overall Gold Trend: Neutral with a bearish bias. Today’s Gold Support Points: $4765 – $4720 – $4680 per ounce. Today’s Gold Resistance Points: $4830 – $4880 – $4925 per ounce. Today’s Gold Trading Signals: Note: These recommendations are suitable for medium-to-long-term traders, provided there is

0
Would love your thoughts, please comment.x
()
x