Forex Signals Brief October 10: USD CPI Risks to the Upside

Yesterday, the Reserve Bank of New Zealand (RBNZ) reduced its Official Cash Rate (OCR) by 50 basis points to 4.75% from 5.25%. This move led to a one-cent decline in the New Zealand dollar (NZD), which was further affected by the broader risk-off sentiment in currency markets. Despite this, both U.S. and European stock markets enjoyed strong performances. The RBNZ’s decision comes in response to the highest unemployment rate in three years, core inflation staying within its target range, and continuing weakness in high-frequency economic indicators.

US September CPI Inflation Expected at 2.3% YoY


Today’s Market Expectations

Today the calendar is light until the U.S. session, when the inflation report will be released. The monthly CPI figure is forecasted at 0.1%, down from the previous 0.2%, while the year-over-year rate is expected to come in at 2.3%, lower than the prior 2.5%. Core CPI, on the other hand, is anticipated to remain steady year-over-year at 3.2%, with the month-over-month reading seen at 0.2%, down from 0.3%. The upcoming U.S. CPI data will be pivotal for the USD. In light of the recent strong Non-Farm Payrolls report, even a modest miss on CPI might not be enough to reinvigorate expectations for a 50-basis-point cut in November.

Weekly jobless claims will also be closely watched as an indicator of labor market health. While initial jobless claims remain within the 200,000–260,000 range, continuing claims have shown significant improvement, with recent reports dropping to 1.826 million. This week’s initial claims are expected to rise slightly to 230,000 from last week’s 225,000, while no consensus has yet been reached on continuing claims.

Yesterday forex moves were small again, with volatility being low, including Gold and crude Oil which were seeing some huge volatility early this week. The USD continued to grind higher and the moves were quite predictable. We opened five trading signals, ending the day with four closed forex trades, three of which ended as winning forex signals.

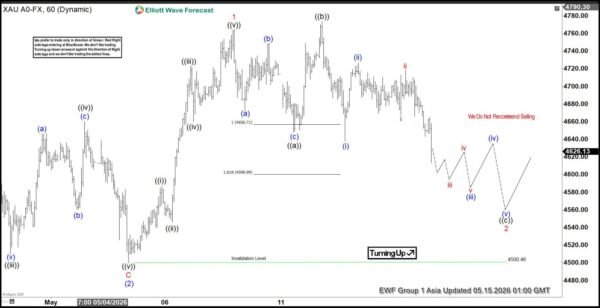
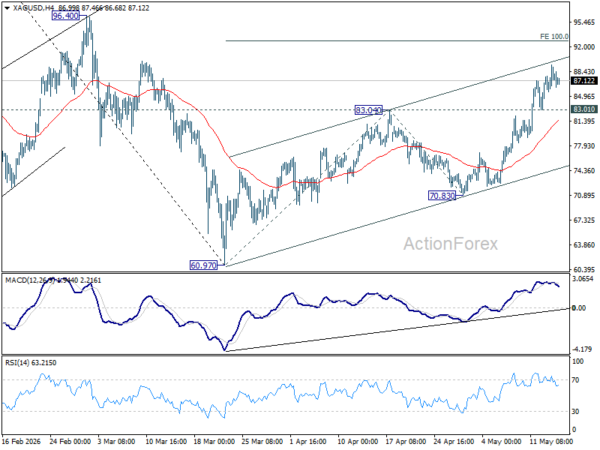
Gold Consolidates Below the 200 SMA After the Decline

Since late September, gold has been consolidating within a triangular pattern marked by ascending lows and descending highs. However, today’s decline saw gold prices move closer to $2,600, breaking below the triangle’s lower boundary established on September 20. Favorable U.S. jobless data has reduced the likelihood of another 50-basis-point rate cut by the Federal Reserve. Additionally, discussions about a potential Middle East ceasefire have negatively impacted gold and silver prices. Yesterday, gold was unable to breach the 200 SMA (Purple), prompting two sell signals as the commodity’s bearish momentum persisted.Chart XAUUSD, H1, 2024.10.09 20:09 UTC, MetaQuotes Ltd., MetaTrader 5, Demo

XAU/USD – H1 Chart

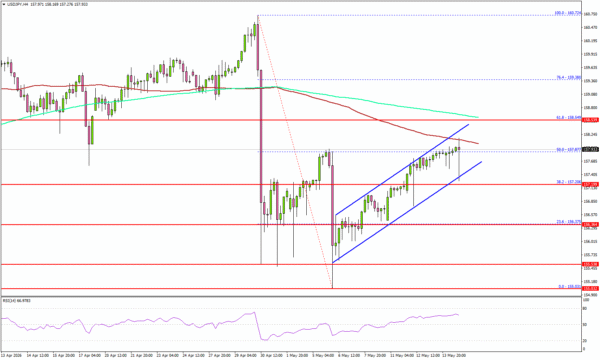
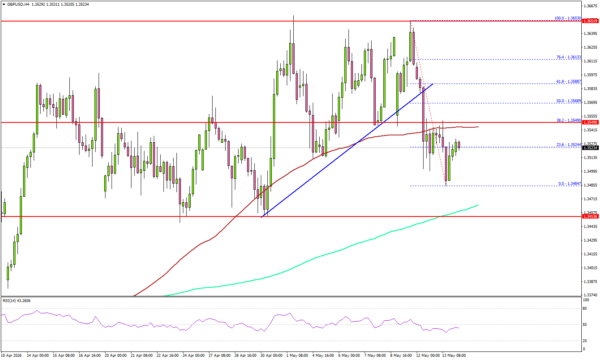
The 20 SMA Keeping USD/CAD Supported

Since early October, the USDCAD pair has been on an upward trajectory, bolstered by the release of the FOMC meeting minutes, which helped the pair cross the 1.37 mark. The H1 chart reflects strong buying pressure, with the uptrend clearly defined, and the 20 SMA serving as consistent support. This persistent bullish movement highlights the underlying strength of the USD, driven by solid U.S. economic data and cautious optimism around Fed policy.Chart USDCAD, H1, 2024.10.09 20:13 UTC, MetaQuotes Ltd., MetaTrader 5, Demo

USD/CAD – H1 Chart

Cryptocurrency Update

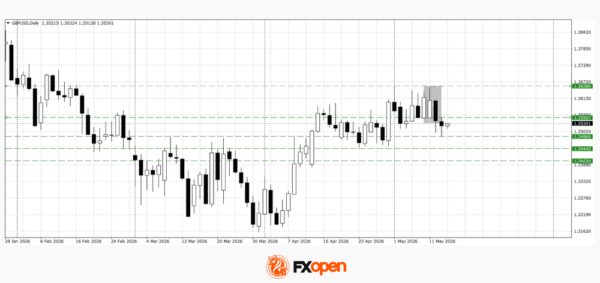
Bitcoin Bounces Off $60,000 

Bitcoin has experienced steady declines since April when it was trading near $70,000. It dipped below $50,000 in August, primarily due to global economic concerns. The bearish trend has been reinforced by lower highs and lows, with the 200-day SMA acting as a ceiling that buyers have been unable to surpass. Although Bitcoin briefly dropped to $60,000, it showed resilience by rebounding over the weekend.

BTC/USD – Daily chart

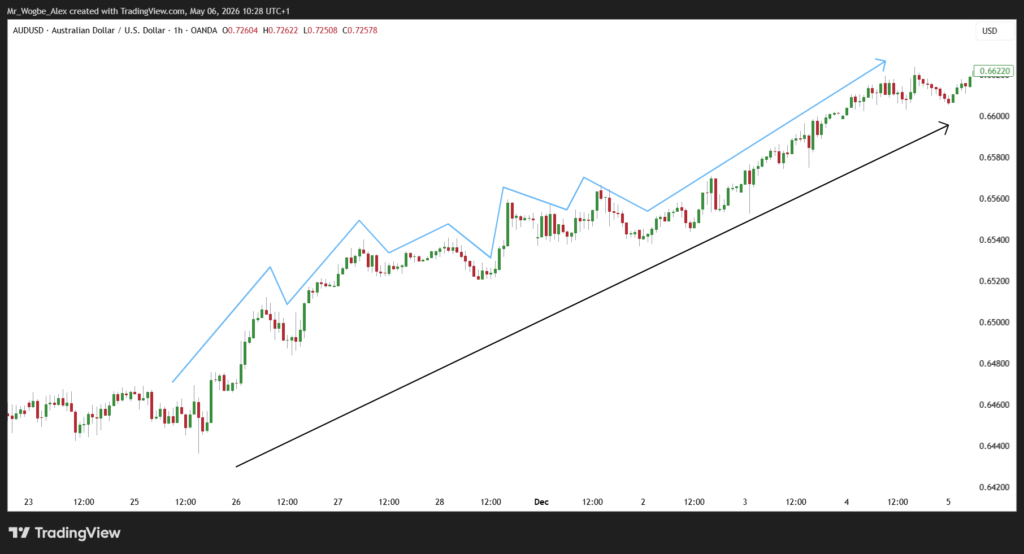
Ethereum Remains Subdued by MAs

Similarly, Ethereum has faced significant downward pressure since March. By June, ETH/USD approached $2,200 as selling intensified, though it managed a modest recovery above the 50-day SMA. Ethereum is now contending with resistance at the 50-week SMA, with strong support from the 100-week SMA holding above the $2,500 level. This ongoing dynamic suggests a possible range-bound movement as both assets struggle against broader economic uncertainties.

ETH/USD – Weekly chart


Source link

Visited 1 times, 1 visit(s) today

Related Article

BulkQuant Launches AI Trading Bot for Crypto, Forex, and Stock Markets

BulkQuant Launches AI Trading Bot for Crypto, Forex, and Stock Markets

London, United Kingdom, May 15, 2026 (GLOBE NEWSWIRE) — BulkQuant has officially launched its AI trading bot platform designed for crypto, forex, and stock market traders seeking a simpler way to automate trading strategies across multiple financial markets. The platform combines AI-powered quantitative analysis, automated trade execution, portfolio monitoring, and adaptive risk management into a

Youtube preview

Four reasons for USD strength – Gold, Silver in symmetrical pennants [Video]

In today’s Market Outlook, let’s take a look at Forex Trading on WTI Crude Oil, Gold, XAU/USD, Silver, GBP/USD, NZD/USD, and EUR/USD. We see USD strength right across the board, and it’s really important for traders and investors to understand why. Firstly, we just saw the latest CPI and PPI; in other words, Inflation figures

GBP/USD: Sterling Under Pressure Despite Strong GDP Data

GBP/USD: Sterling Under Pressure Despite Strong GDP Data

Fundamental Background UK GDP grew by 0.6% in the first quarter of 2026, notably above the revised 0.2% reading recorded in the fourth quarter of 2025. The main contribution came from the services sector, which expanded by 0.8%. Nevertheless, strong macroeconomic data failed to support sterling: CPI inflation accelerated to 3.3% year-on-year in March, up

XAUUSD Elliott Wave Update: Gold in Expanded Flat Correction

XAUUSD Elliott Wave Update: Gold in Expanded Flat Correction

After completing the correction at $4098.74 on the March 23 low, Gold (XAUUSD) initiated a rally in a clear impulsive structure. From that level, wave (1) advanced and concluded at $4890.97. The subsequent pullback in wave (2) finished at $4500.46, as reflected in the one‑hour chart. Following this retracement, the metal resumed its upward movement

USD/JPY Recovery Nears Make-Or-Break Moment For Trend Direction

USD/JPY Recovery Nears Make-Or-Break Moment For Trend Direction

Key Highlights USD/JPY started a decent upward move above 157.20. A key rising channel is forming with support at 157.65 on the 4-hour chart. EUR/USD could extend losses if it settles below 1.1650. GBP/USD corrected some gains and might revisit 1.3300. USD/JPY Technical Analysis The US Dollar remained supported and recovered above 157.00 against the

US Retail Sales Rise 0.5% in April, Reinforcing Resilient Demand

US Retail Sales Rise 0.5% in April, Reinforcing Resilient Demand

US retail sales rose 0.5% mom in April, matching market expectations and reinforcing the view that consumer demand remains resilient despite rising inflation pressures and elevated interest rates. Core readings were slightly firmer, with retail sales excluding autos rising 0.7% mom, above expectations of 0.6% mom, suggesting underlying household spending momentum remains relatively healthy. The

Trump-Xi Summit Fails to Convince Oil Markets on Hormuz

Trump-Xi Summit Fails to Convince Oil Markets on Hormuz

Risk sentiment remained broadly stable on Thursday as US equity futures edged higher alongside European stocks, extending the optimistic tone already dominating global markets this week. But while equities continued drifting along the existing AI- and liquidity-driven rally, oil markets delivered a far more cautious verdict on the opening phase of the Trump-Xi summit in

Interactive Brokers launches unified interface for trading prediction markets across Kalshi, CME Group, and ForecastEx

Interactive Brokers launches unified interface for trading prediction markets across Kalshi, CME Group, and ForecastEx

Electronic trading major Interactive Brokers Group, Inc (NASDAQ:IBKR) today announced the launch of a first-of-its-kind unified interface for trading prediction markets across three leading US prediction market platforms — Kalshi, CME Group, and ForecastEx. IBKR’s Prediction Markets offering enables investors to access and trade contracts across all three prediction market exchanges from a single platform,

FxPro launches Discover Hub on its mobile app

FxPro launches Discover Hub on its mobile app

Online trading company FxPro today announced the launch of Discover Hub on its mobile app. Built to help traders uncover opportunities faster and stay informed, the new tab combines two powerful Trading Central features in one place. Trading Signals Users can access actionable signals across multiple asset classes and filter by market group. Each signal

What Is the Petrodollar? System, History & Collapse Explained | LiteFinance

What Is the Petrodollar? System, History & Collapse Explained

2026.05.14 2026.05.14 What Is the Petrodollar and How Does It Affect the Global Economy? Gleb Kabanovhttps://www.litefinance.org/blog/authors/gleb-kabanov/ What is the petrodollar, and why has this concept shaped the architecture of the global economy for decades? The term describes a mechanism in which oil is traded mainly in US dollars, while oil exporters reinvest their oil revenues

Technical Analysis of US Crude, XAUUSD, and EURUSD for Today (May 13, 2026)

Technical Analysis of US Crude, XAUUSD, and EURUSD for Today (May 13, 2026)

2026.05.13 2026.05.13 Short-Term Analysis for Oil, Gold, and EURUSD for 13.05.2026 Alex Rodionovhttps://www.litefinance.org/blog/authors/alex-rodionov/ Welcome, my fellow traders! I have prepared a price forecast for the USCrude, XAUUSD, and EURUSD using a combination of the margin zones method and technical analysis. Based on the market analysis, I suggest entry signals for intraday traders. After climbing yesterday,

Silver's Momentum Stalls Below $90, but Bigger Breakout Risks Are Building

Silver’s Momentum Stalls Below $90, but Bigger Breakout Risks Are Building

Silver briefly pushed above the $89 level this week before losing some momentum ahead of $90 psychologically mark. Yet this pause appears more like consolidation than exhaustion. And, the most important signal in Silver right now is the fact that the rally continueed despite hotter US inflation data and rising expectations for tighter Federal Reserve

EUR/USD and GBP/USD Return to Ranges Ahead of Key Data

EUR/USD and GBP/USD Return to Ranges Ahead of Key Data

European currencies have moved into a corrective phase following recent gains, while market participants focus on upcoming macroeconomic data from the UK, the eurozone and the United States. After a strong upward move, both currencies returned to their previous trading ranges, signalling a shift towards consolidation ahead of important economic releases. Additional pressure on the

GBP/USD Reversal Triggers Bearish Pressure, $1.3450 In Focus

GBP/USD Reversal Triggers Bearish Pressure, $1.3450 In Focus

Key Highlights GBP/USD was rejected near the 1.3650 resistance. It traded below a bullish trend line with support at 1.3580 on the 4-hour chart. EUR/USD could struggle to stay above 1.1650 if it remains below 1.1750. USD/JPY is showing signs of more upside above the 158.00 resistance. GBP/USD Technical Analysis The British Pound failed to

AUD/USD Hourly Chart

What It Is & How It Works (2026 Guide)

No strategy works every time, but some are more beginner-friendly than others. These three are the forex trading strategies worth starting with. Trend Following The idea is to trade in the direction the market is already moving. If a currency pair is making higher highs and higher lows on a daily or 4-hour chart, the

US PPI Surges to Highest Since 2022 as Upstream Inflation Pressures Intensify

US PPI Surges to Highest Since 2022 as Upstream Inflation Pressures Intensify

US producer prices surged far more than expected in April, reinforcing concerns that inflation pressures are broadening across the economy and strengthening the case for the Federal Reserve to keep policy restrictive for longer. Headline PPI rose 1.4% mom, accelerating from 0.7% mom previously and well above expectations of 0.5% mom. The increase marked the

0
Would love your thoughts, please comment.x
()
x