Daily Market Price Updates and Commentary 9th November 2026


ICE Futures U.S. Sugar No.11 Contract

Settlement (cUS$/lb) Open High Low Last Volume O/I Life High Life Low
Mar27 18.21 -0.03 ▼ 18.22 18.44 18.18 18.21 61,555 582,952 21.29 14.42
May27 17.66 -0.05 ▼ 17.71 17.86 17.64 17.66 27,490 201,957 20.40 14.29
Jul27 17.32 -0.05 ▼ 17.37 17.49 17.30 17.33 15,135 147,818 19.81 14.27
Oct27 17.33 -0.05 ▼ 17.39 17.50 17.32 17.34 9,470 96,102 19.63 14.45
Mar28 17.75 -0.03 ▼ 17.78 17.88 17.72 17.76 3,359 59,239 19.83 14.97
May28 16.81 0.00   16.81 16.92 16.76 16.82 683 26,154 18.77 14.82
Jul28 16.37 0.03 ▲ 16.38 16.45 16.30 16.36 372 19,695 18.10 14.74
Oct28 16.38 0.05 ▲ 16.35 16.43 16.29 16.38 392 17,529 17.91 15.01
Mar29 16.86 0.08 ▲ 16.77 16.88 16.74 16.86 280 6,870 18.19 16.20
May29 16.51 0.10 ▲ 16.38 16.51 16.36 16.51 161 2,397 17.74 16.02
Jul29 16.32 0.10 ▲ 16.19 16.19 16.18 16.19 24 3,968 17.50 16.15
Oct29 16.37 0.12 ▲ 16.22 16.22 16.22 16.22 1 58 16.30 16.22
Total               118,922 1,164,739    

*Volume includes exchange for physicals.


ICE U.S. Sugar No.11 – Spreads

Date Spread Date Spread
Mar27 / May27 0.55 Oct27 / Mar28 -0.42
Mar27 / Jul27 0.89 Oct27 / May28 0.52
Mar27 / Oct27 0.88 Mar28 / May28 0.94
Mar27 / Mar28 0.46 Mar28 / Jul28 1.38
May27 / Jul27 0.34 May28 / Jul28 0.44
May27 / Oct27 0.33 May28 / Oct28 0.43
Jul27 / Oct27 -0.01 Jul28 / Oct28 -0.01
Jul27 / Mar28 -0.43 Jul28 / Mar29 -0.49


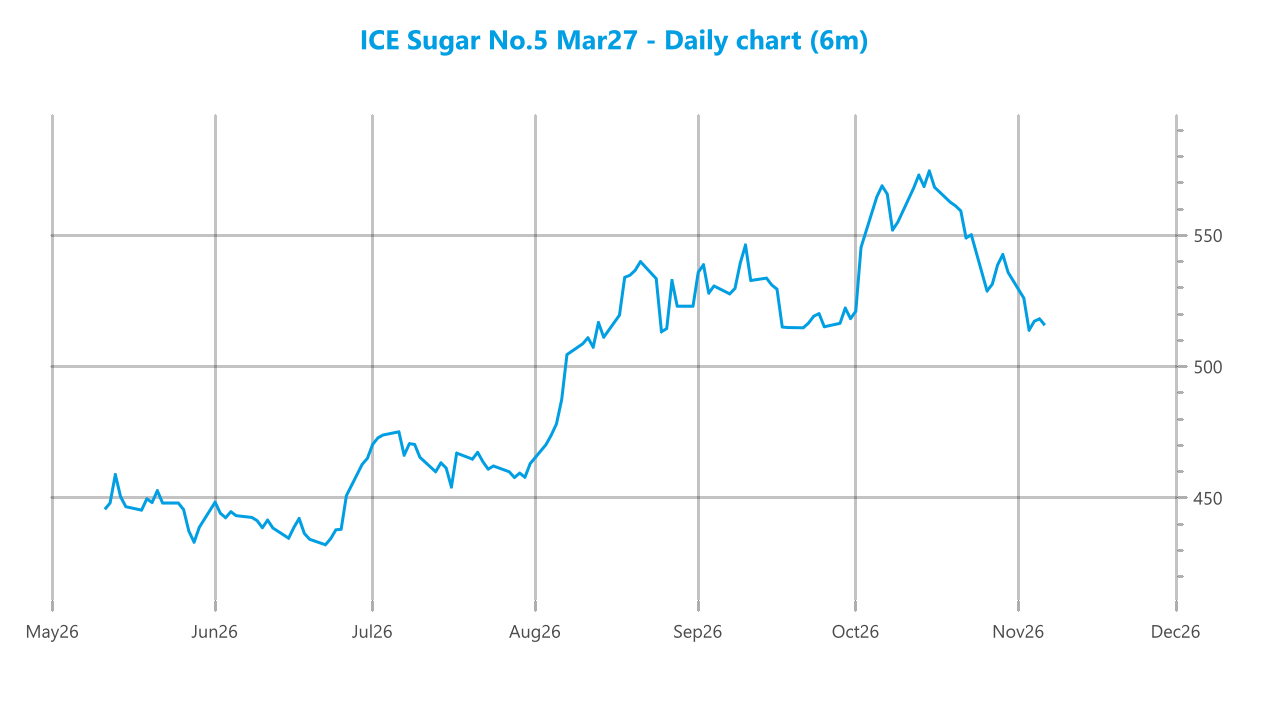
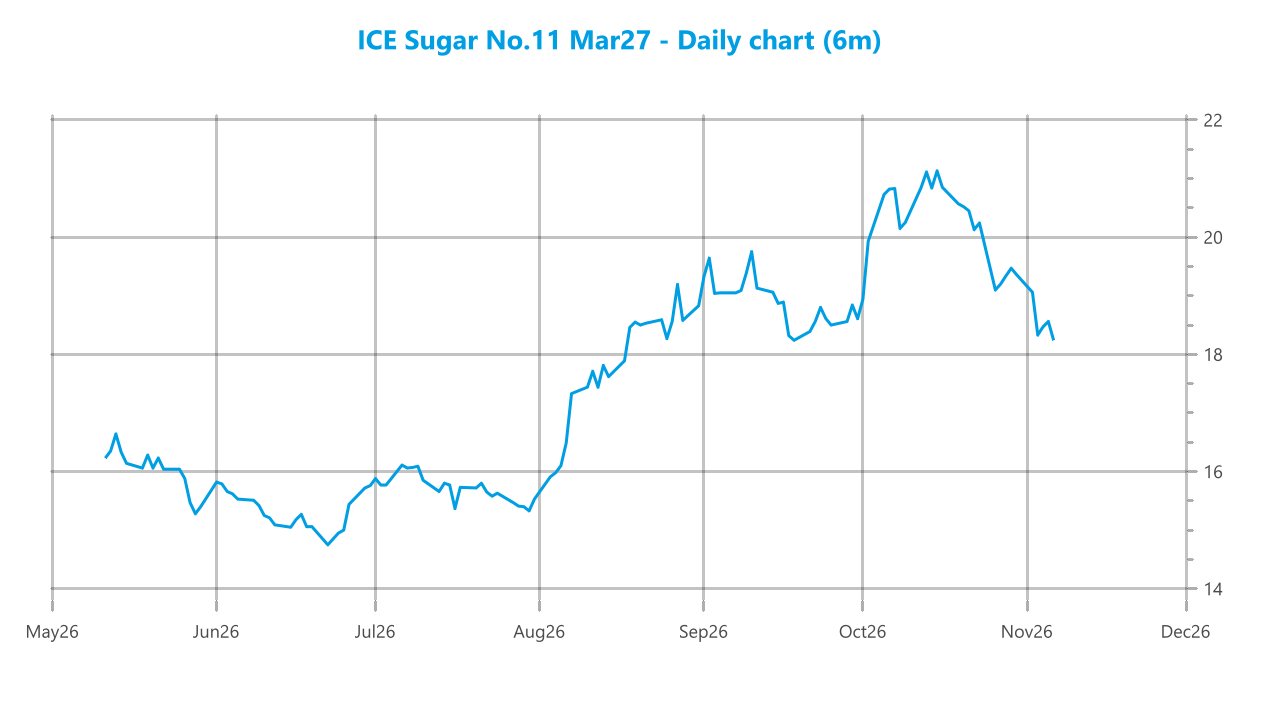
The new week arrived, but very little had changed as trading good off to a slow start. March’27 maintained a narrow band between 18.18 and 18.33 across a tedious morning period in which the only apparent interest came from smaller traders alongside underlying consumer scale buying. Fridays COT report had shown another reduction in the spec/fund holding to +146,031 lots, primarily due to position reduction on the long side, though a smaller number of new shorts were also added, however there was no sign of that changing in any meaningful way today as smaller traders continued to dominate interest into the afternoon. Their efforts helped March’27 up into the 18.40’s but progress stalled when their buying did the same and trading simply developed into a new, slightly higher, band. Highs were recorded at 18.44 prior to small traders closing back out some exposure, leaving the market top sit around 18.30 as it headed quietly towards the close holding on to minor gains. One final round of position liquidation then followed as we headed into the call, and this one sent the price back towards the bottom of the range leading to a slightly lower closing price at 18.21 that leaves parameters unmoved. 


ICE Europe White Sugar Futures Contract

Settlement (US$/mt) Open High Low Last Volume O/I Life High Life Low
Dec26 509.60 7.40 ▲ 503.50 516.00 500.30 509.50 15,428 17,721 567.70 393.20
Mar27 517.30 1.50 ▲ 517.50 521.90 514.00 517.20 20,890 69,305 577.40 398.00
May27 518.30 2.50 ▲ 517.00 522.60 514.70 518.70 8,013 32,120 581.80 401.40
Aug27 512.40 0.30 ▲ 513.80 517.70 510.70 512.90 3,253 18,226 574.30 404.30
Oct27 506.70 -0.50 ▼ 509.20 512.10 506.40 507.30 1,114 8,625 565.30 408.20
Dec27 503.40 -0.70 ▼ 506.10 508.50 503.30 504.10 231 4,136 558.20 414.30
Mar28 501.70 -1.00 ▼ 504.50 505.60 501.70 501.70 23 909 552.60 421.00
May28 495.10 -3.60 ▼ 496.40 497.60 496.20 497.30 38 893 542.80 426.30
Aug28 486.80 -2.00 ▼ 488.40 489.60 488.20 489.30 29 628 529.90 431.10
Oct28 479.60 -0.80 ▼ 478.00 481.80 478.00 481.50 15 78 520.00 441.70
Dec28 479.20 1.60 ▲ 483.00 484.10 483.00 484.10 5 6 518.10 468.60
Mar29 480.60 -33.20 ▼ 517.10 517.10 517.10 517.10 1 8 517.10 483.20
May29 477.70 1.60 ▲ 474.20 474.20 473.60 473.60 3 7 517.50 473.60
Aug29 474.70 —   — — — — — — — —
Total               49,043 152,662    

*Volume includes exchange for physicals.


ICE Europe White Sugar – Spreads

Date Spread Date Spread
Dec26 / Mar27 -7.70 Mar27 / May27 -1.00
Dec26 / May27 -8.70 May27 / Aug27 5.90
Dec26 / Aug27 -2.80 Aug27 / Oct27 5.70
Dec26 / Oct27 2.90 Oct27 / Dec27 3.30


White Sugar Premium

Date Premium Date Premium
Mar27 / Mar27 115.84 Jul28 / Aug28 125.90
May27 / May27 128.96 Oct28 / Oct28 118.48
Jul27 / Aug27 130.56 Mar29 / Mar29 108.90
Oct27 / Oct27 124.64 May29 / May29 113.72
Mar28 / Mar28 110.38 Jul29 / Aug29 114.91
May28 / May28 124.50    

*Values calculated basis 6:09 PM.


It was an inauspicious start to the week with March’27 trading either side of unchanged across the first hour, giving no indication as to a preferred direction of travel. This pattern maintained throughout a very quiet morning where the only movement of interest was being seen by the spot, where Dec’26 found a surge of buying which brought the Dec’26/March’27 spread to -$9.00 just after noon, its highest level in four weeks. Whether related to order flow or the start of a final week squeeze, the movement was certainly striking, and it continued through early afternoon with March’27 following some of the gains and pulling up into the low $520’s. This mirrored what was being seen for the No.11, but while values were holding positively any continuation was proving tricky as buyers largely held to the lower levels and failed to chase upwards. As such the afternoon saw a band held either side of $520.00, with most interest continuing to be seen through the spreads.  The “pull” factor of Dec’26 was also aiding the white premium values, and during the afternoon March/March’27 worked its was towards $116.00 rep[resenting its highest value since mid-September. Dec’26/March’27 saw highs at -$4.70 before slipping back to end the day at -$7.70, still a constructive showing for the spread which will be keenly watched to see whether the receiver looks to bring it back to a premium. MOC selling knocked March’27 back to close at $517.30, a net gain though not of any significance to alter the chart picture.    


Market chart asset


Market chart asset


A man with short brown hair and glasses, wearing a light striped shirt, is smiling and looking slightly to the left in an indoor setting. Other people are blurred in the background.

Jon Whybrow

Jon joined CZ in 1991, working in the Treasury department before moving to join the derivatives team in 1994. Over 30 years Jon has built up significant experience across derivatives markets and products, particularly sugar, and is now Head of Flow derivatives providing market execution services for CZ’s global client base. He is responsible for the market commentaries which are published each day on CZ app.


More from this author

Source link

Visited 1 times, 1 visit(s) today

Related Article

Midterm US elections, earnings, jobs data loom for AI-wary stock market

An aerial view shows a Google data centre construction site in Muhos, northern Finland September 11, 2026. (Ville Honkonen/STT/Lehtikuva/via REUTERS) By Lewis Krauskopf | REUTERS US midterm elections, a heavy slate of corporate earnings and the monthly jobs report will further test stock investors next week, after a series of setbacks for the market-leading AI

Why The Trade Desk Stock Skyrocketed Today

Shares of The Trade Desk (NASDAQ:TTD) charged sharply higher on Monday, surging as much as 16.6%. As of 11:38 a.m. ET, the stock was still up 15.2%. Missed AI’s “Act 1”? Act 2 Could Be 16x Bigger. Most investors think they missed the AI boat because they didn’t buy Nvidia in 2005. But according to

Matas share buy-back programme: Reporting of transactions in week 45

Market Closed – 11:20:00 2026-11-09 am EST 5-day change 1st Jan Change 83.00 DKK -0.12% -12.72% -33.60% Published on 11/09/2026 at 10:00 am EST Publicnow English Published: 2026-11-09 15:53:00 CET Matas A/S – Changes in company’s own shares Matas share buy-back programme: Reporting of transactions in week 45 Company announcement no. 34 2026/27Allerød, 9 November

Nvidia Stock Slides After Chip Maker Opens Probe

– Michael M. Santiago/Getty Images Nvidia’s shares are sliding after the company’s board launched an investigation into reports that Chief Executive Jensen Huang had been a spying target after a romantic relationship with an executive suspected of working for Chinese intelligence. The chip giant is on track to lose hundreds of billions of dollars in

Jensen Huang just handed Wall Street its first $4.5 trillion CEO scandal

Wall Street has priced plenty of CEO scandals. It has never priced one at a company worth $4.5 trillion that makes up nearly 7% of the S&P 500 (^GSPC). Nvidia (NVDA) CEO Jensen Huang admitted in a Nov. 8 memo to employees to an affair with Alice Huang, whom US intelligence officials believe worked for

3 Super Growth Stocks to Buy Hand Over Fist If the Stock Market Crashes

Is a market crash imminent? No one knows for sure, but on the day that I’m writing this, the S&P 500 has pulled back by more than 4% — a big move. Will that continue? We can’t know. A pullback of some sort, potentially triggering a recession for a while, is likely at some point,

Markets Brief: The Silver Lining in the Election’s Bad News for Some AI Stocks

Talk about a delayed reaction. On Wednesday, stock market pundits’ read on the Democratic sweep of Congress was that “gridlock is good.” That included the presumed difficulty of getting legislation passed at the federal level, with commentary noting that any limitations would come at the state level. Then on Thursday, it seems investors noticed what

Cathie Wood ‘always feels better when the market is worried’

Ark Invest CEO Cathie Wood is shrugging off this week’s market jitters, telling CNBC on Friday that concerns among investors actually reinforce her optimism that further gains lie ahead. U.S. equities sold off sharply on Thursday, reversing the initial rally seen in the wake of the midterm elections. AI-related stocks led the rout, sending the

AMD or Nvidia: Which AI Chip Stock Would I Buy With $1,000 Today?

AMD (AMD +11.04%) and Nvidia (NVDA +2.77%) are two of the largest competitors in the AI processor industry. The third primary one is Broadcom (AVGO +0.74%), but its niche in that segment differs from theirs. Nvidia and AMD compete in the same field, designing powerful general-purpose chips while Broadcom designs highly specialized computing units for

Anthropic’s IPO dilemma after the AI sell-off: ‘Damned if you do, damned if you don’t’

This past week’s stock market meltdown could hardly have come at a more critical moment for Anthropic (ANTH.PVT). The sell-off cast a shadow over the frontier artificial intelligence developer’s expected pre-Thanksgiving public debut, raising questions about its potential valuation and ability to sustain the next phase of AI growth. “The only thing that matters the

Adobe vs. Palantir Technologies: Which Technology Stock Is a Better Buy Going Into 2027?

Choosing between established giants and high-growth disruptors remains a classic dilemma for investors. For those interested in exposure to the tech industry, deciding whether the steady cash generation of Adobe (ADBE -2.90%) or the accelerating momentum of Palantir Technologies (PLTR +3.48%) can be a challenge, as both have different pros and cons. Adobe provides the

Prediction: This Will Be the Best-Performing AI Stock of 2027

With November here and 2027 right around the corner, it’s time to start thinking about which stocks could be the best performers in 2027. The reality is that the big hedge funds and money in the market are already thinking about this, and there could be some sizable movement in the stock market in the

0
Would love your thoughts, please comment.x
()
x