Fundamental Backdrop and Market Sentiment
I wrote on 1st November that the best trades for the week would be:
-
Short of the EUR/USD currency pair below $1.1300. This pair fell over the week by 0.17%.
A summary of last week’s most important data in the market:
-
US Average Hourly Earnings – increased at a slightly faster rate than expected.
-
US Non-Farm Payrolls & Unemployment Rate – the jobs number was notably stronger than expected, and the unemployment rate unexpectedly fell.
-
Bank of England Policy Meeting – a hawkish hike, the 0.25% rate increase was expected, but the hawkish dissent in favour of more tightening was not.
-
Reserve Bank of Australia Policy Meeting – a dovish rate hike, as the Bank softened its wording on future tightening, there were three votes for a dovish dissent on the hike.
-
US Congressional Elections – Democrats took control of both Houses of Congress, which will have major ramifications for US politics over the next two years.
-
New Zealand Unemployment Rate – this was expected to fall, but unexpectedly rose, shower surprising weakness in the economy.
-
New Zealand Parliamentary Elections – at the time of writing, the results are still inconclusive, as it was a very close election.
Last week was an important one in the Forex and stock markets, with two major central banks holding policy meetings, highly important elections in the USA, and the release of the US NFP data bundle.
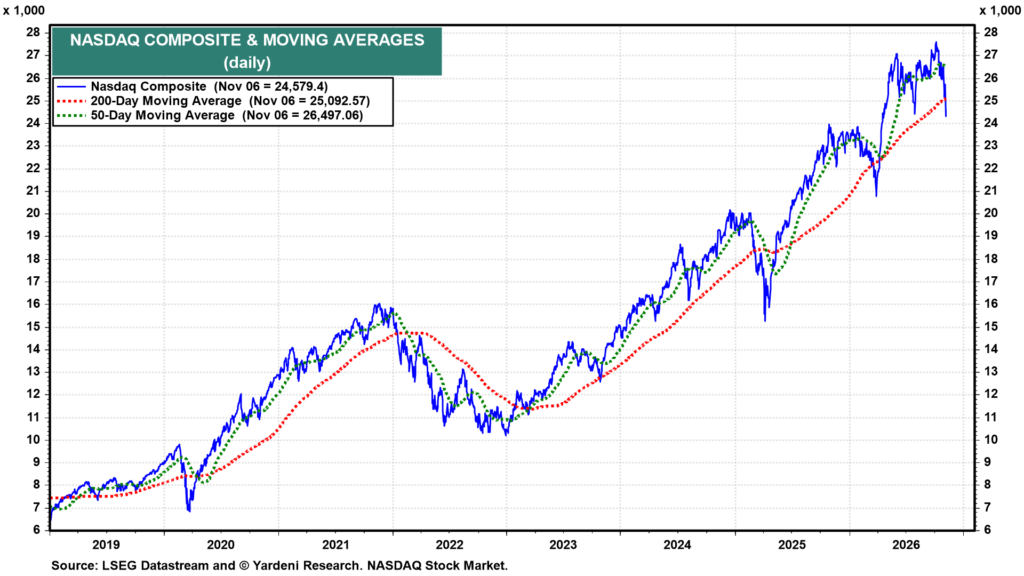
Financial markets endured a turbulent week as election results, central-bank tightening and high-impact economic data combined to undermine risk appetite. An initial relief rally following the Democrats’ sweep of both chambers of the US Congress gave way to aggressive selling as investors focused on the possibility of tighter restrictions on AI data center construction. The NASDAQ 100 Index plunged approximately 6.4% on Thursday and finished the week down 4.9%, while the S&P 500 lost 2.7% over the week. The S&P 500 Index also moved uncomfortably close to its 200-day simple moving average, around 7,300, before closing Friday near 7,378. The NASDAQ 100 Index is trading below its 200-day simple moving average and is now down approximately 15% from its recent all-time high, which is very close to bear market territory in any definition.
Central-bank decisions reinforced concerns that inflation would keep borrowing costs elevated: the Reserve Bank of Australia raised its cash rate by 25 basis points to 4.85%, while the Bank of England increased Bank Rate by the same amount to 4%, with both highlighting persistent inflation risks. Friday’s US employment report added to the pressure, showing payroll growth of 165,000, well above expectations, and unemployment edging down to 4.1%. The stronger labour-market figures left traders pricing roughly an 80% probability of a Federal Reserve rate increase in December, limiting the scope for expectations of easier monetary policy to cushion the equity sell-off. However, the news from Australia and New Zealand had a dovish tilt.
Concerning politics, New Zealand added another layer of political and economic uncertainty. Saturday’s closely contested election left the composition of the next government unresolved, with coalition negotiations potentially taking weeks and results not due until 27th November. Earlier labour market figures had shown unemployment rising to an 11-year high of 5.7%, alongside falling employment and subdued wage growth. That weakness contrasted sharply with the stronger US jobs report, highlighting divergent economic conditions just as investors were reassessing interest-rate expectations and the durability of the technology-led market rally.
The election results in the United States and Israel left the outlook for another major US attack on Iran uncertain, rather than decisively removing that risk. The Democrats’ capture of both chambers of Congress, amid voter anger over the war and high fuel prices, increased the political cost of further escalation for Trump, while Netanyahu’s loss of his parliamentary majority weakened his domestic position without ending his push for renewed strikes. It is quite possible that a new government will be formed in Israel, perhaps even this week, which would remove Netanyahu and his Likud party from office, as well as parties further to the right. Trump has kept military action on the table, and limited US strikes since the midterms underline the distinction between avoiding a major offensive and halting hostilities altogether. For energy markets, the key variable is escalation: a larger attack that triggers Iranian retaliation against Gulf production, export infrastructure or shipping through the Strait of Hormuz would likely lift crude oil and refined-fuel prices, with natural gas also vulnerable to further disruption of regional shipments. Conversely, a credible agreement that restores shipping and reduces the threat to supplies would likely unwind part of the geopolitical risk premium—illustrated by Brent’s nearly 9% post-election decline before a partial rebound as attacks on shipping continued.
The Week Ahead: Key Data and Events to Watch
Next week has far fewer high-impact data points scheduled, but there will be a highly important release of US CPI (inflation) data. The coming week’s most important data points, in order of likely importance, are:
-
US CPI (inflation)
-
US PPI
-
UK GDP
Monthly Forex Forecast: November 2026 Overview
For the month of November, I forecasted that the EUR/USD currency pair will decline in value. Here is the performance to date:

Weekly Forecast 8th November 2026
Last week, I forecasted that the EUR/AUD currency cross would rise in value. It rose by 2.28%, which was an excellent result.
This week, I forecast that the GBP/AUD and EUR/AUD currency crosses will fall in value over the week.
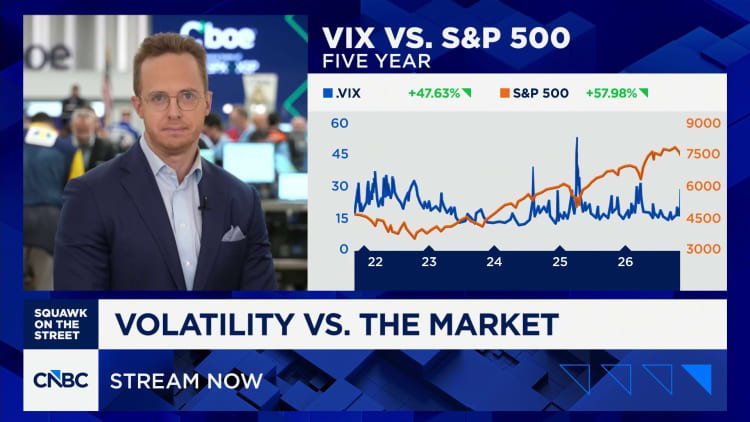
Volatility rose last week, with 41% of the notable currency pairs and crosses moving by more than 1% in value. Next week’s volatility is likely to be at a similar level or lower.
Wednesday is a public holiday in the USA, Canada, and France.
You can trade these forecasts in a real or demo Forex brokerage account.
Technical Overview and Key Levels
Key Support and Resistance on Major FX Pairs
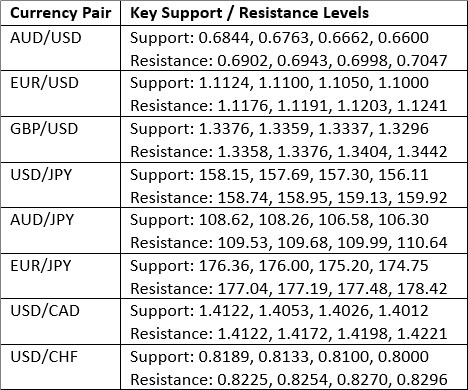
Key Support and Resistance Levels
US Dollar Index
The US Dollar Index (DXY) printed a bullish pin candlestick, which rejected the previous week’s more bearish price action and made the highest weekly close seen since March 2025. The price remains within a long-term bullish trend, and the price action is contained within an ascending price channel as evidenced by the rising linear regression analysis within the price chart below.
Another potentially bullish factor is that the support level at 101.39 continues to survive.
If the price breaks to new highs, and the closing price was very near to the 19-month high price, that will be a bullish sign. The greenback got a boost at the end of last week as US economic data showed the economy still running relatively hot, boosting the case for more rate hikes before the hiking cycle can end.
I think it makes sense to be long of the USD over the coming week, especially as US stock markets saw such sharp falls, this will lead to liquidation into USD and safe-haven investors moving into USD yield vehicles.
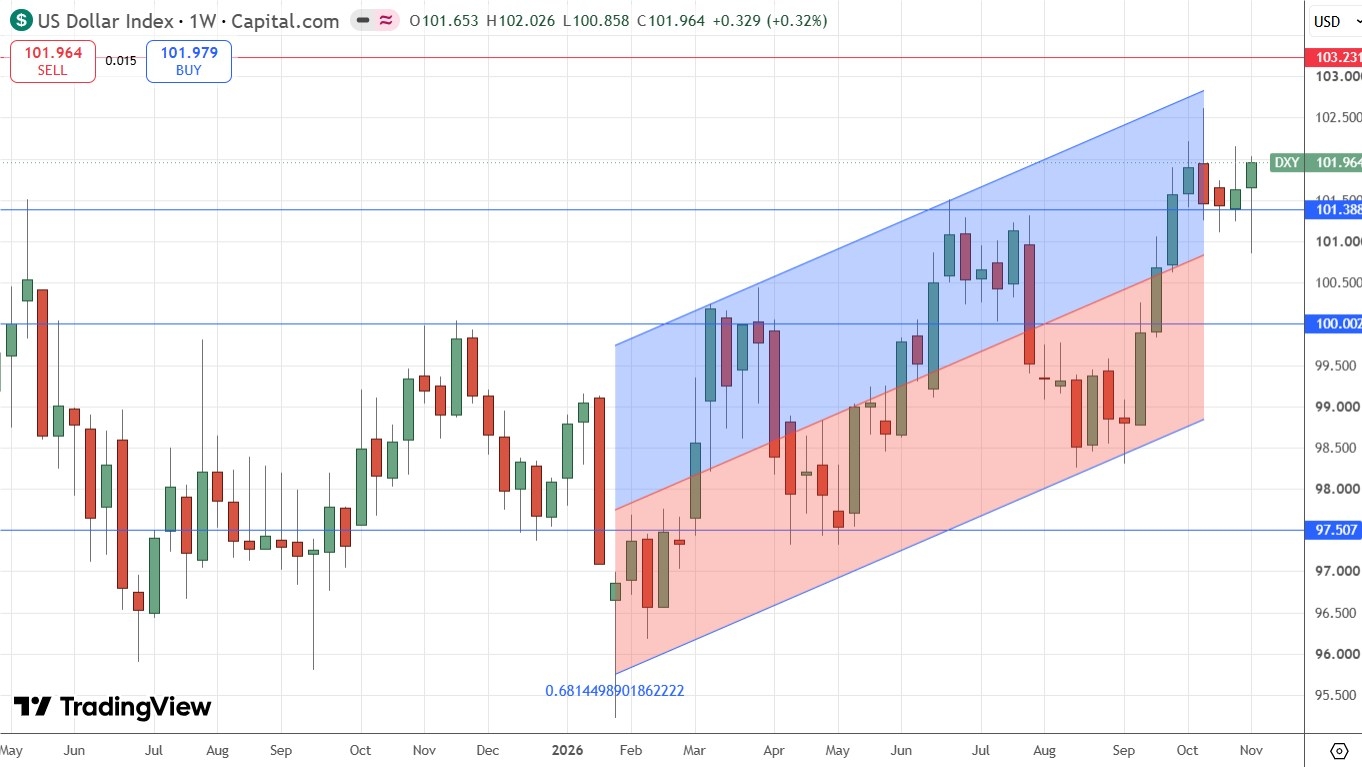
US Dollar Index Weekly Price Chart – Near 17-Month High
EUR/USD
The EUR/USD currency pair felt last week, printing a bearish pin bar, exhibiting a significant upper wick which rejected the area of resistance which keeps finding sellers near the round number at 1.1300. The price also closed very near its low of last week, which is a bearish sign.
The price is obviously in a long-term bearish trend, having made a new 17-month low just last week, despite the slowing bearish momentum, which had been unusually strong lately by the standards of this currency pair.
The technical picture is clearly bearish, and the fundamental picture became more so with Friday’s strong US data, which pushed the USD to its highest weekly close in well over a year. The Euro is looking weak. There are fears over French and Eurozone debt, an energy crisis, and potential conflict with Russia, and all are taking their toll on the Euro.
I will remain in my short trade until we get a daily close above 1.1300. It is quite possible that the price will rise above this area and then turn bearish again, and if that happens, it could be an opportunity to enter a new short trade if that price action is set up. However, I think we are likely to see breakdowns to new long-ter low prices this week, so I am comfortable remaining short, especially as this currency pair has historically tended to trend very reliably.
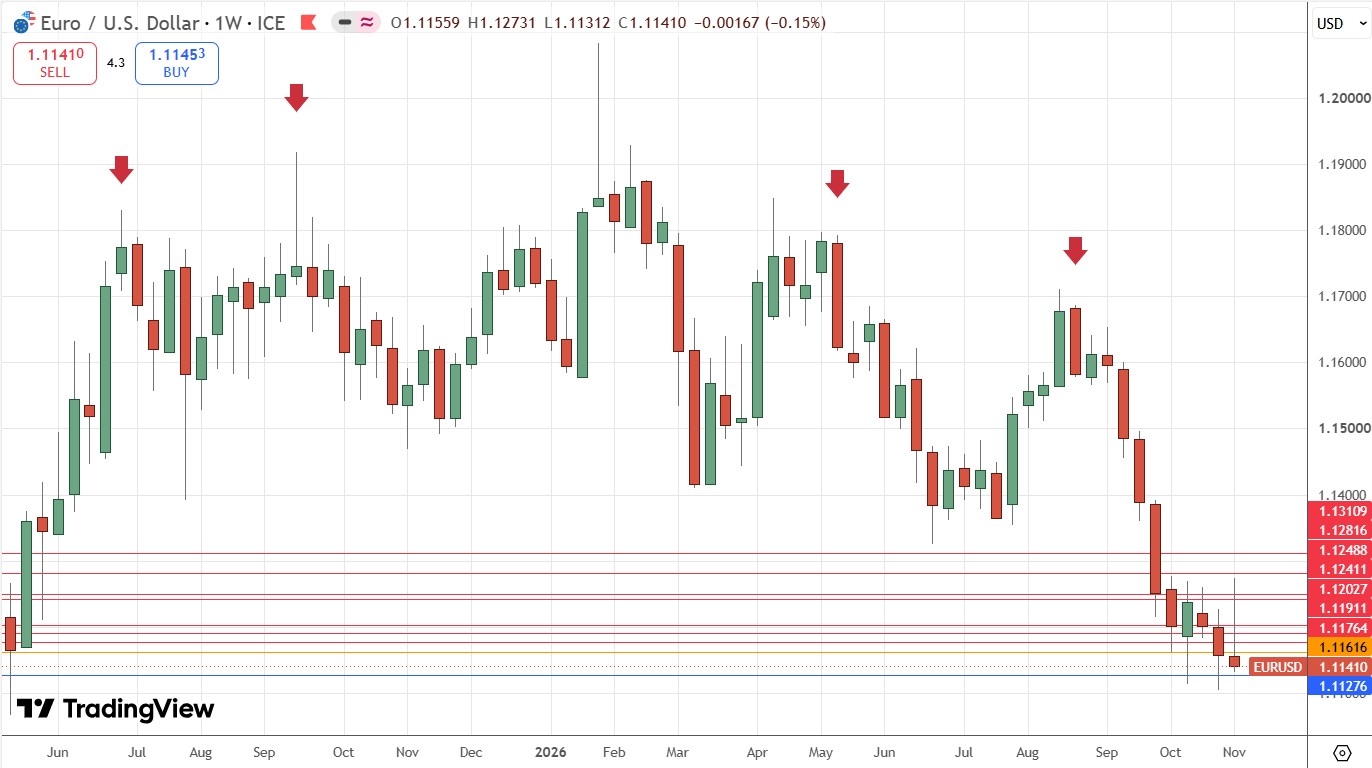
EUR/USD Weekly Price Chart – Heading for a Bearish Breakdown?
AUD/USD
The RBA’s rate hike last week to 4.85% provided interest-rate support, but the split vote and softer guidance reduced expectations for further tightening, giving a dovish pivot which weakened the AUD and made it last week’s worst performing major currency. Slower Chinese growth adds an external headwind.
Turning to the US Dollar, stronger-than-expected October payroll growth of 165,000 and unemployment falling to 4.1% reinforced expectations of another Fed hike. December hike odds rose to around 80%, lifting Treasury yields and the dollar. The bias remains positive while US data support further tightening.
This clear fundamental imbalance was mirrored by a strong downwards movement in the AUD/USD currency pair last week, breaking below several former support levels and closing very near the low of the week’s range. A look at the price chart below shows that the price arrived at an historically infective area of lows, with the 10-month low sitting at 0.6833. This could be a pivotal area: a sustained break lower could see the price plunge even further, but if it starts to hold as support, this price area could again be a long-term low.
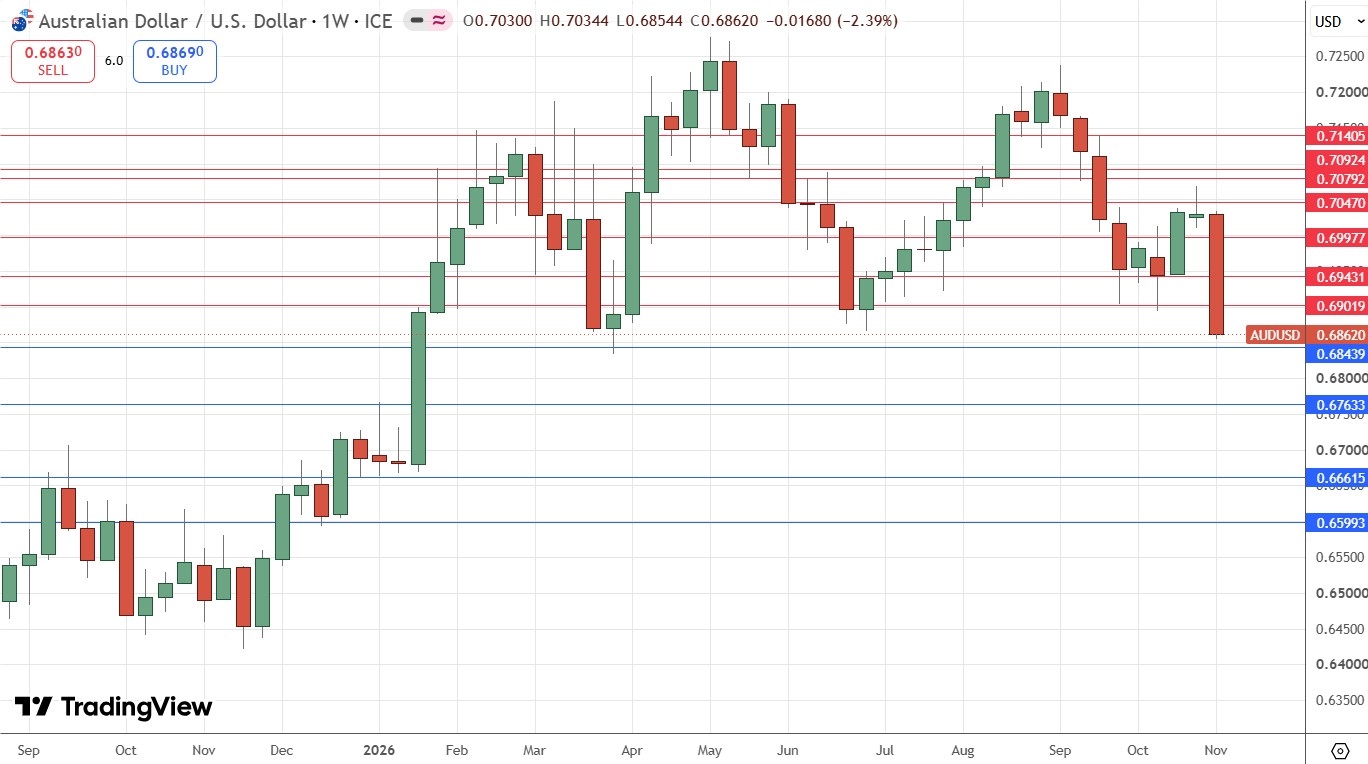
AUD/USD Weekly Price Chart – Approaching Pivotal Long-Term Low
WTI Crude Oil
WTI Crude Oil fell sharply last week for two reasons: firstly, the result of the US Congressional elections saw the Democrats sweep to victory and take control of both Houses, which will make it harder for President Trump to resume kinetic warfare against Iran; secondly, the Vice President JD Vance has been allowed to present communications with Iran concerning a potential deal to fully end the war in a positive and fruitful light. Vance and other political figures in the Republican party have even begun blaming the Iran war for the Republican defeat.
In addition to these factors, although President Trump talks tough, it seems clear to me that he has chickened out of decisively winning the war with Iran. There is some chance he may choose to strike another blow at whatever remains of Iran’s nuclear program before he runs out of opportunity to do so, which will probably happen in January 2027 when the new Congress is sworn in.
The effect of all these factors was to generate a sharp drop in the price of Crude Oil last week. The price fell all the way to the key support level of $87.68, which I have been highlighting for months, before bouncing a bit higher. This level is very important. It might give another bounce which scalpers might exploit if it is tested again, or it could just break down. A bearish break below that level would be very technically significant and could lead to a quick fall lower to the $80.00 area.
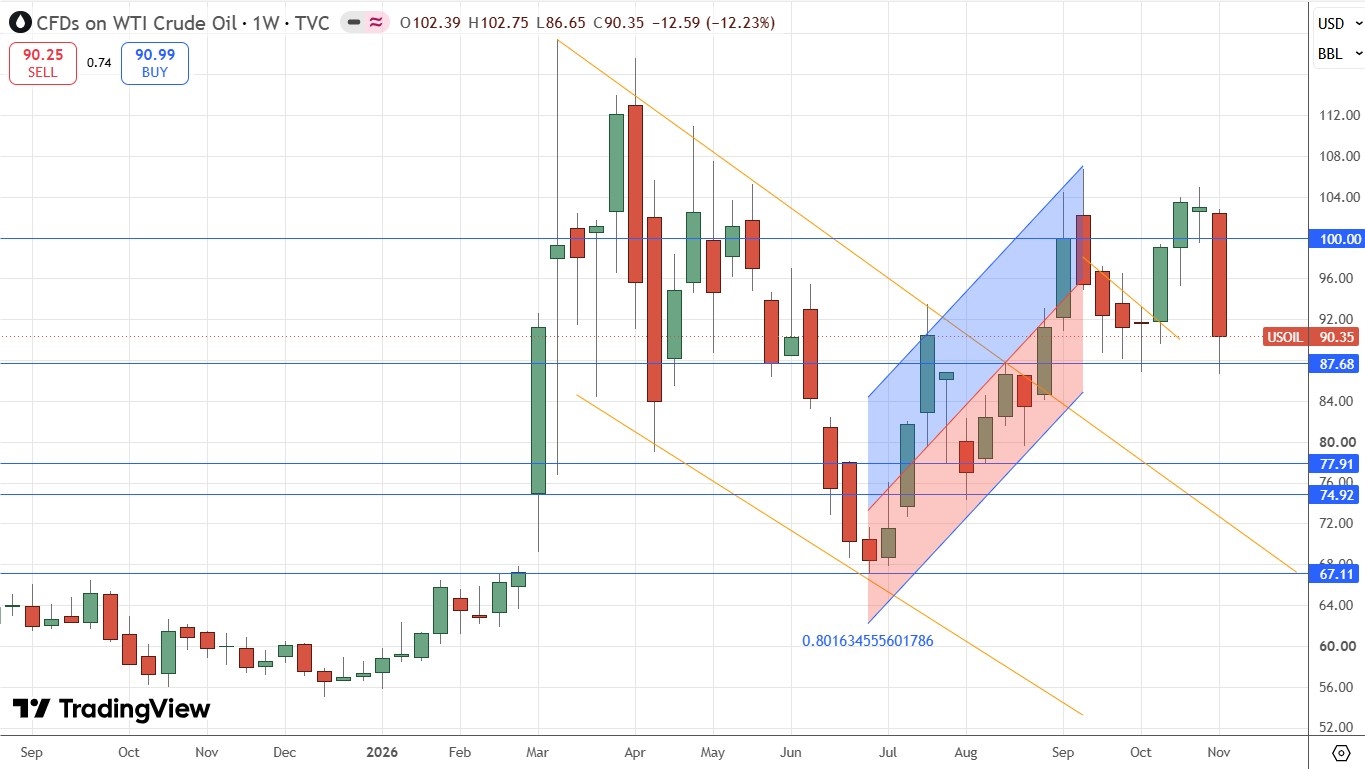
WTI Crude Oil Spot Weekly Price Chart – Bounce at Support
S&P 500 Index
US stocks plunged on Thursday, November 5, as investors feared that Democrats’ sweeping midterm election gains could bring tighter restrictions or pauses on AI data-center construction, undermining growth expectations for chipmakers and other AI beneficiaries. High borrowing costs and doubts about whether huge AI investments will generate sufficient profits amplified the selling.
Last Thursday was the worst day seen in the US stock market in 19 months. This Index fell by 4.4% on that day alone.
Friday produced a bearish inside pin bar that closed very near its low, which is a bearish sign.
Sometimes the US stock market will bounce back the following week after such a strong drop. The case for this scenario may be helped by the fact that the low of last week is very close to the 200-day simple moving average, which can act as moving support.
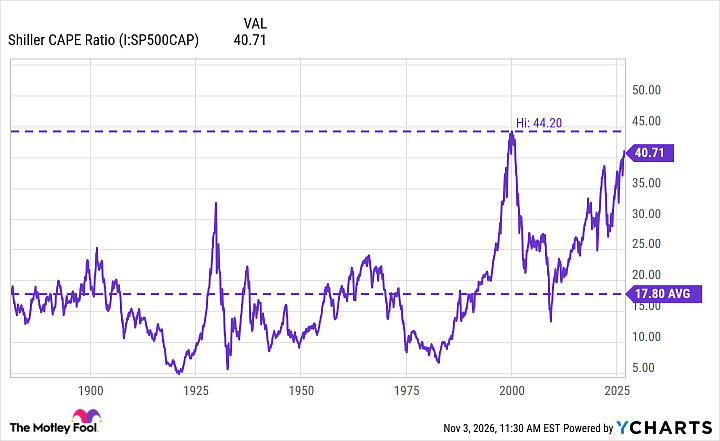
However, I think that this drop is overdue and so driven by a fear of overvaluation in a leading market sector (AI), that I expect the drop is quite likely to continue over the coming week.
It may be wise to reduce any medium-term long position in this Index.
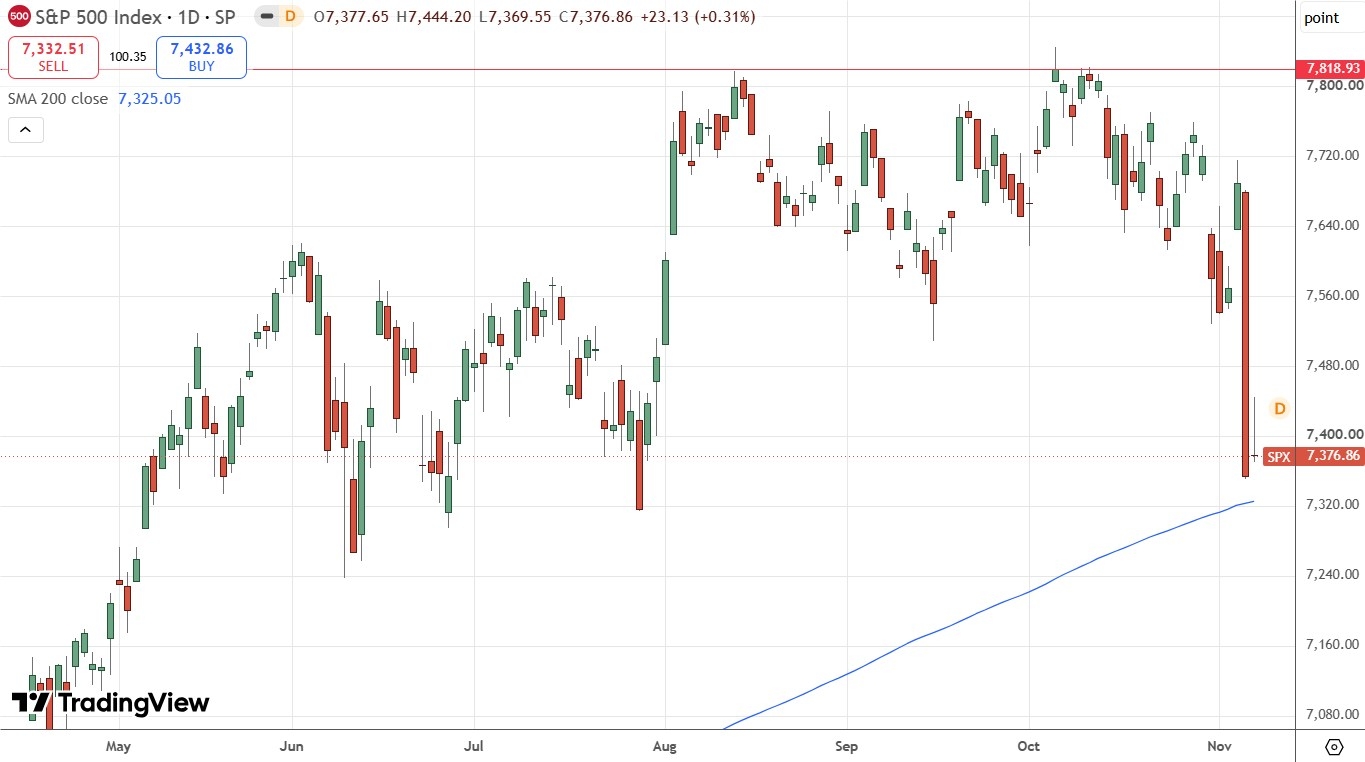
S&P 500 Index Daily Price Chart – Sharp Fall
NASDAQ 100 Index
Following on from my analysis of the S&P 500 Index above, the tech-based NASDAQ 100 Index fell even harder, dropping by 6.4% on Thursday alone. The price is now well within correction territory (down by more than 10% from its recent record high) and seems to be established below its 200-day simple moving average, which is another bearish sign.
AI companies are concentrated in the NASDAQ 100 Index, which is why it has performed so relatively badly, and why its outlook looks even more bearish than the remainder of the US stock market.
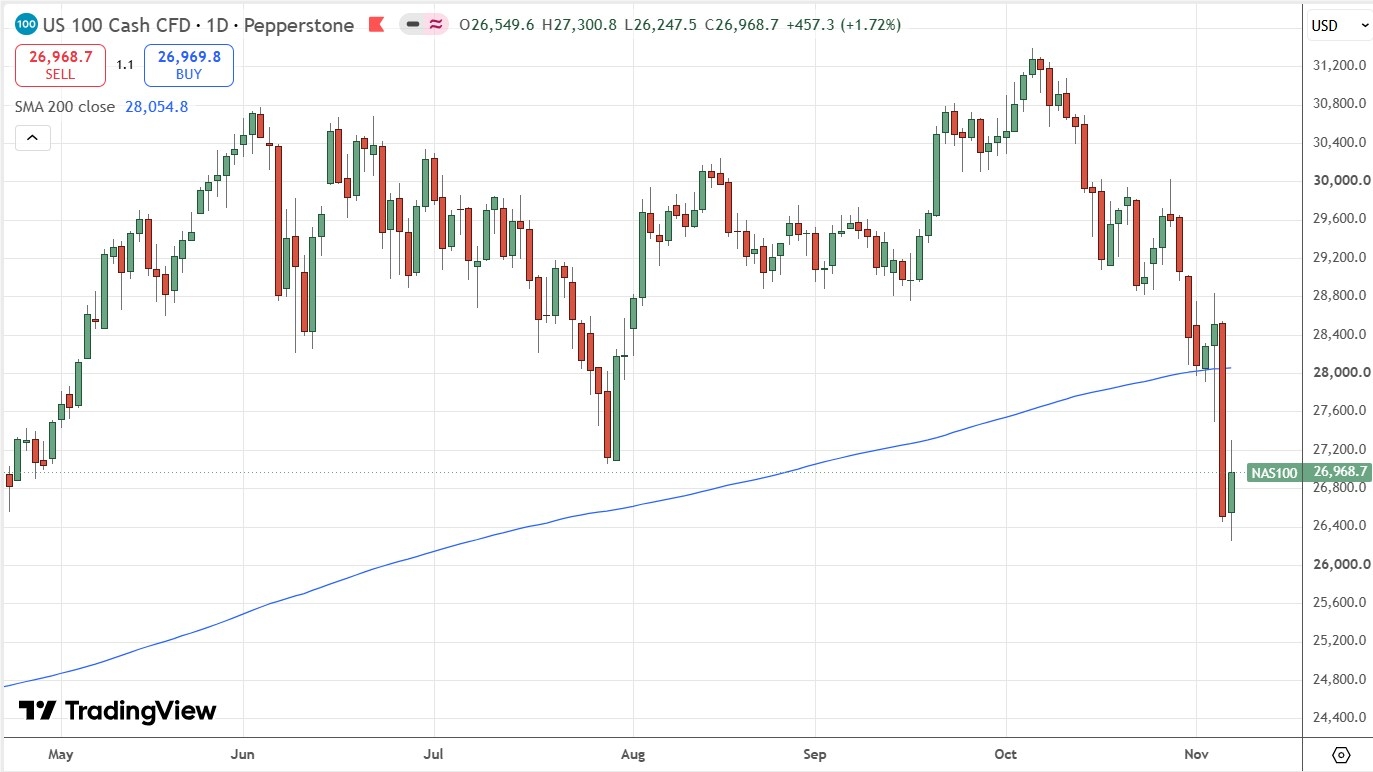
NASDAQ 100 Index Daily Price Chart – Correction Territory
Bottom Line
I see the best trades this week as:
-
Short of the EUR/USD currency pair below 1.1300.