GBP/USD Trades Sideways, USD/CAD Rally Still Looks Strong

GBP/USD is attempting a consolidation phase above 1.33500. USD/CAD is showing positive signs and might aim for more gains above 1.3725.

Important Takeaways for GBP/USD and USD/CAD Analysis Today

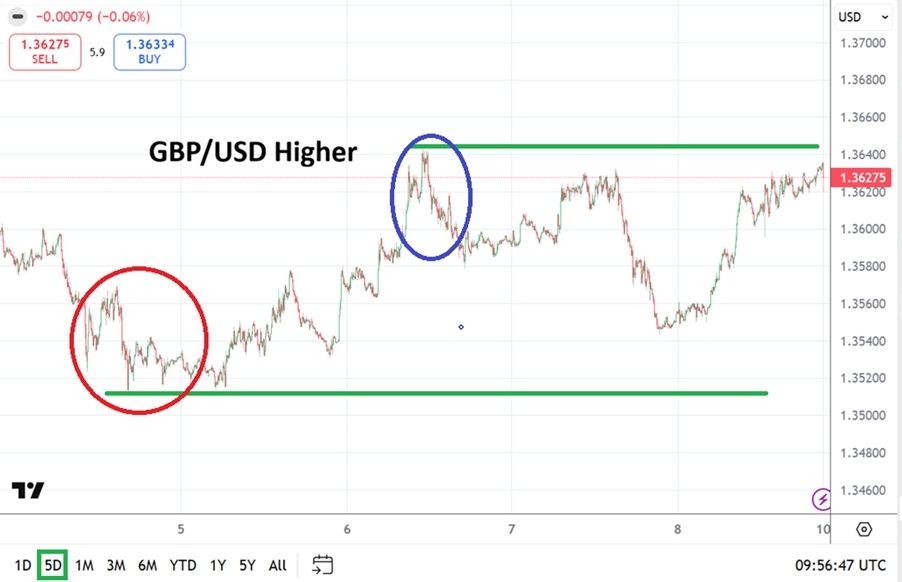
  • The British Pound started a recovery wave above 1.3515 and 1.3550.
  • There is a key bearish trend line forming with resistance near 1.3620 on the hourly chart of GBP/USD at FXOpen.
  • USD/CAD rallied above 1.3650 and 1.3680 before the bears appeared.
  • There was a break above a bearish trend line with resistance at 1.3695 on the hourly chart at FXOpen.

GBP/USD Technical Analysis

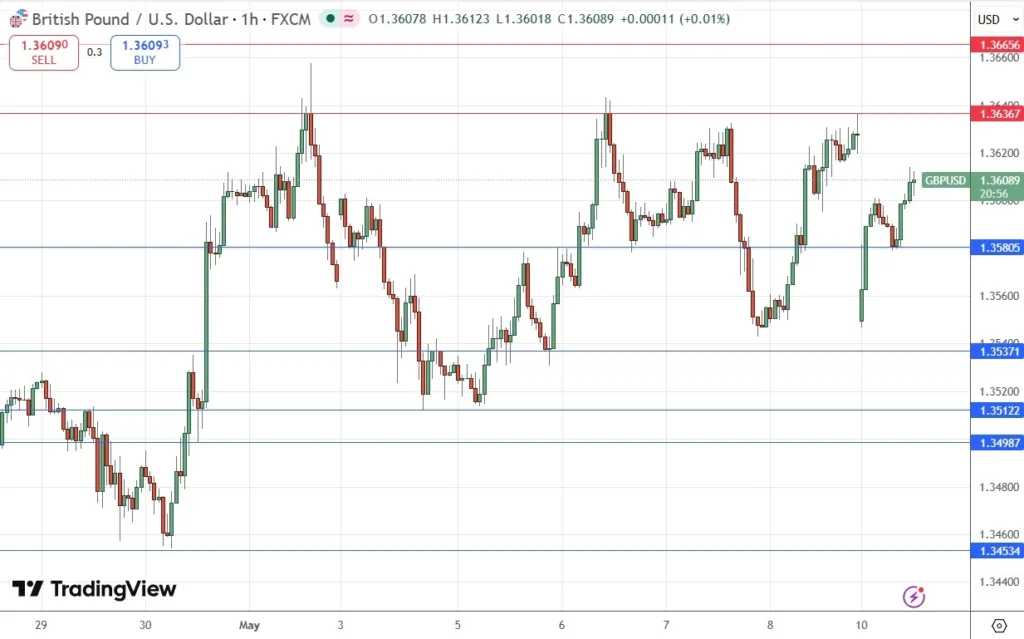
On the hourly chart of GBP/USD at FXOpen, the pair started a fresh decline from 1.3635 after a decent increase. The British Pound traded below 1.3600 to again move into a short-term bearish zone against the US Dollar.

The pair even traded below 1.3580 and the 50-hour simple moving average. Finally, the bulls appeared near 1.3550. A low was formed near 1.3547, and the pair is now attempting a short-term recovery wave.

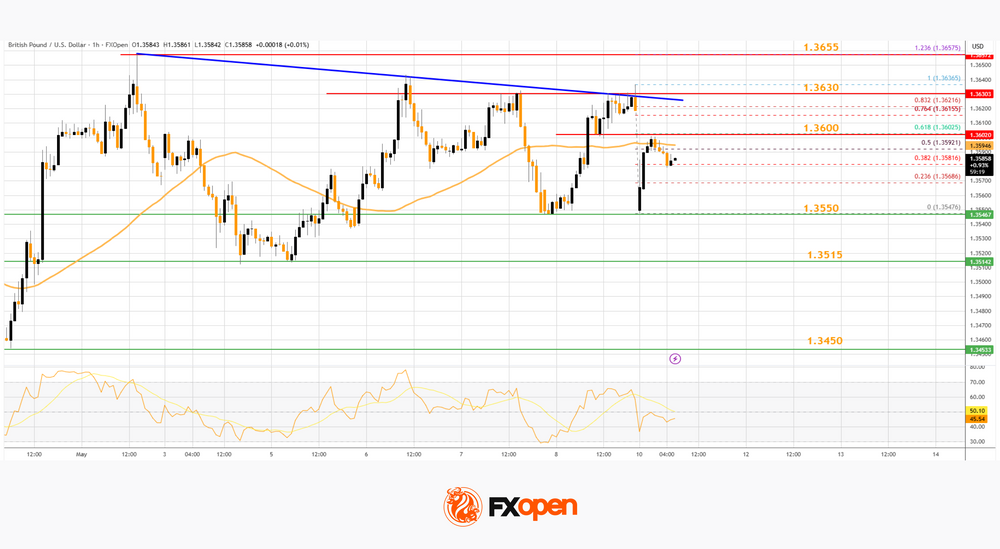
There was a fresh upside above 1.3580 and the 50% Fib retracement level of the downward move from the 1.3636 swing high to the 1.3547 low. The pair is now showing positive signs above 1.3550. Immediate resistance on the upside is near the 61.8% Fib retracement level at 1.3600 or the 50-hour simple moving average.

The first major hurdle for the bulls on the GBP/USD chart is near a bearish trend line at 1.3620. A close above 1.3620 might spark a decent increase. The next stop for the bulls might be 1.3655. Any more gains could lead the pair toward 1.3710 in the near term.

Initial support sits at 1.3550. The next key area of interest might be 1.3515, below which there is a risk of another sharp decline. In the stated case, the pair could drop toward 1.3450.

USD/CAD Technical Analysis

On the hourly chart of USD/CAD at FXOpen, the pair formed a strong support base above the 1.3580 level. The US Dollar started a fresh increase above 1.3635 against the Canadian Dollar.

The pair cleared the 50-hour simple moving average, climbed above 1.3650, and surpassed a bearish trend line at 1.3695. The last swing high was formed at 1.3723, and the pair is now showing positive signs above the 23.6% Fib retracement level of the upward move from the 1.3579 swing low to the 1.3723 high.

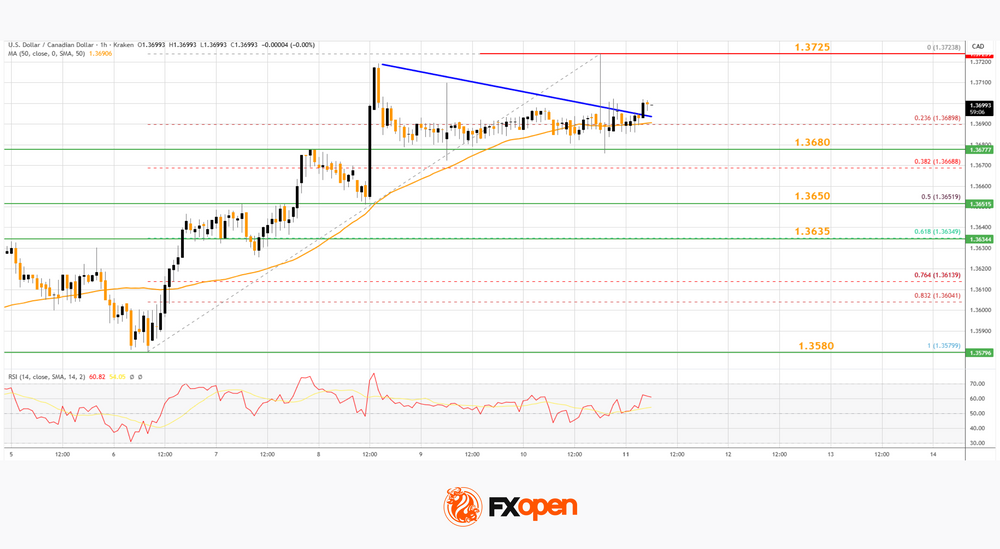
On the upside, Initial resistance sits near 1.3725. The main breakout zone could be 1.3740. A clear upside break above 1.3740 could start another steady increase.

The next major stop for the bulls might be 1.3800. Any more gains could open the doors for a test of 1.4000. If there is a pullback, the pair could find bids near 1.3680 or the 50-hour simple moving average. A downside break below 1.3680 might send the pair toward the 50% Fib retracement at 1.3650.

The next major area on the same USD/CAD chart could be 1.3580. A close below 1.3580 could push the pair further lower. In the stated case, the bears might aim for a test of 1.3500.

Trade over 50 forex markets 24 hours a day with FXOpen. Take advantage of low commissions, deep liquidity, and spreads from 0.0 pips (additional fees may apply). Open your FXOpen account now or learn more about trading forex with FXOpen.

This article represents the opinion of the Companies operating under the FXOpen brand only. It is not to be construed as an offer, solicitation, or recommendation with respect to products and services provided by the Companies operating under the FXOpen brand, nor is it to be considered financial advice.

Source link

Visited 1 times, 1 visit(s) today

Related Article

The Labour Market Failed to Boost the Dollar

The Labour Market Failed to Boost the Dollar

Strong US employment figures were not enough to prevent the dollar from falling. Geopolitics and risk appetite remain the key drivers. The US dollar came under pressure from sellers on Friday, and a strong labour market report failed to reverse the trend, merely slowing the pace of the decline. Non-farm payrolls rose by 115K in

Technical Analysis of US Crude, XAUUSD, and EURUSD for Today (May 11, 2026)

Technical Analysis of US Crude, XAUUSD, and EURUSD for Today (May 11, 2026)

2026.05.11 2026.05.11 Short-Term Analysis for Oil, Gold, and EURUSD for 11.05.2026 Alex Rodionovhttps://www.litefinance.org/blog/authors/alex-rodionov/ Welcome, my fellow traders! I have prepared a price forecast for the USCrude, XAUUSD, and EURUSD using a combination of the margin zones method and technical analysis. Based on the market analysis, I suggest entry signals for intraday traders. Today, oil is

Yen Extends Losses Despite Intervention. Forecast as of 11.05.2026 | LiteFinance

Yen Extends Losses Despite Intervention. Forecast as of 11.05.2026

2026.05.11 2026.05.11 Yen Extends Losses Despite Intervention. Forecast as of 11.05.2026 Dmitri Demidenkohttps://www.litefinance.org/blog/authors/dmitri-demidenko/ Japan has most likely sold US Treasuries to intervene in the currency market and push USD/JPY lower. If such interventions become more frequent, they could drive US Treasury yields higher, creating an additional headwind for the US economy. Let’s discuss this topic

AI Trading Platforms for Beginners in 2026 

10 Best AI Trading Bots for Beginners in 2026

In 2026, automated trading continues expanding across cryptocurrency, stock, and forex markets.  AI trading bots are used across cryptocurrency, stock, and forex markets to automate trade execution, monitor market conditions, and assist with strategy management. As market volatility remains elevated across cryptocurrencies, equities, and forex markets, some retail investors are incorporating automation into their trading

Is Day Trading Worth It?

12 Best AI Day Trading Platforms for Beginners (2026 Guide)

For beginners, one of the fastest ways to start day trading is by understanding which trading platforms are best suited for modern markets. Day trading is a short-term trading strategy focused on profiting from price movements within the same trading day. Because markets move quickly, successful day traders often rely on fast execution, accurate market

Short-Term Analysis for BTCUSD, XRPUSD, and ETHUSD for 11.05.2026 | LiteFinance

Short-Term Analysis for BTCUSD, XRPUSD, and ETHUSD for 11.05.2026

2026.05.11 2026.05.11 Short-Term Analysis for BTCUSD, XRPUSD, and ETHUSD for 11.05.2026 Roman Oneginhttps://www.litefinance.org/blog/authors/roman-onegin/ Dear readers, I’ve prepared a short-term forecast for Bitcoin, Ripple, and Ethereum based on Elliott Wave analysis. Last week’s forecasts are still relevant. Bitcoin and Ethereum continue to rise, while Ripple has already started to decline. The article covers the following subjects:

image

GBP/USD Bulls Facing Strong Resistance Overhead

The GBP/USD currency pair continues to trade within a range, which has been most notable by its repeated failures over recent days to break above the $1.3637 area. This currency pair usually moves quickly and easily into new price spaces with relatively few genuine retracements, so when it consolidates, traders can get discouraged easily. This

US Dollar Advances As Trump Labels Peace Offer 'Unacceptable'. Forecast as of 11.05.2026 | LiteFinance

US Dollar Advances As Trump Labels Peace Offer ‘Unacceptable’. Forecast as of 11.05.2026

2026.05.11 2026.05.11 US Dollar Advances As Trump Labels Peace Offer ‘Unacceptable’. Forecast as of 11.05.2026 Dmitri Demidenkohttps://www.litefinance.org/blog/authors/dmitri-demidenko/ Despite a strong US jobs report, the EUR/USD pair rose as US stock indices hit new record highs, driven by improved global risk appetite. However, the euro later faced a new gap. Let’s discuss these topics and develop a trading plan. The

CFDs broker YaMarkets shuts down

CFDs broker YaMarkets shuts down

Offshore CFDs broker YaMarkets is shutting down. The company, run mainly from Dubai and India and focused primarily on the Indian market, has taken down the yamarkets.com website, which now shows a Service Closure Announcement, that reads as follows: We would like to inform all clients and partners that Yamarkets has officially closed all services and

Image used for representation purpose only

Rupee crashes 139 paise to 94.90 against U.S. dollar

Image used for representation purpose only | Photo Credit: Getty Images/iStockphoto The rupee crashed 139 paise to 94.90 against the greenback in early trade on Monday (May 11, 2026) after President Donald Trump rejected Iran’s response to the U.S.’s peace proposal, following which crude oil prices surged rapidly. A strengthening U.S. dollar and steep FPI

EUR/USD Poised For Upside Break As Buying Pressure Builds

EUR/USD Poised For Upside Break As Buying Pressure Builds

Key Highlights EUR/USD stayed above 1.1675 and might attempt another increase. A bullish trend line is forming with support at 1.1750 on the 4-hour chart. GBP/USD seems to be consolidating gains above 1.3520. Bitcoin remains supported and might aim for a move above $82,000. EUR/USD Technical Analysis The Euro found support near 1.1675 against the

Canada’s Industry Data to Show Steadiness Amid Pressure from Tariffs, Disruptions

Canada’s Industry Data to Show Steadiness Amid Pressure from Tariffs, Disruptions

The week ahead is relatively quiet for major Canadian data releases, but industry reports will offer important signals about the economy’s momentum heading into spring. Early signs from Statistics Canada’s advance estimates suggest wholesale trade for April on Thursday and manufacturing sales next Friday should show the sectors finding their footing after significant disruptions to

The Weekly Bottom Line: Labor Market Resilient Despite Energy Shock

The Weekly Bottom Line: Labor Market Resilient Despite Energy Shock

Canadian Highlights Canada’s labour market remained soft in April, with employment down and the unemployment rate rising to 6.9%. Canada’s trade balance returned to surplus in March on stronger commodity exports, though net trade is still likely to subtract from Q1 GDP growth. A soft labour market and weak ex-energy trade should keep the Bank

GBP/USD Weekly Forecast - 10/05: Holds Higher Ground (Chart)

GBP/USD Weekly Forecast – 10/05: Holds Higher Ground (Chart)

Having seen a high around the 1.36450 mark on Wednesday, the GBP/USD went into this weekend around 1.36274. The currency pair has been correlating to the global Forex market in a straightforward manner per USD centric sentiment depending on what time of the day it is. While that sentence may seem to be a bit

EUR/CHF Weekly Outlook - ActionForex

EUR/CHF Weekly Outlook – ActionForex

EUR/CHF edged lower last week but failed to get rid of 0.9155 cluster support (38.2% retracement of 0.8979 to 0.9264 at 0.9155) cleanly. Initial bias stays neutral this week first. On the upside, break of 0.9177 minor resistance will turn bias back to the upside for 0.9264 resistance. However, sustained trading below 0.9155 will turn

Table of prices Gold 10/05/2026

Weekly Pairs in Focus 10th to 15th Mayo 2026 (Charts)

Gold The gold market has initially felt during the week only to turn around and show signs of strength again. The $4,600 level continues to be very important, and I think you need to watch this very closely as it is an area that has caused both support and resistance multiple times in the past.

EUR/AUD Weekly Outlook - ActionForex

EUR/AUD Weekly Outlook – ActionForex

EUR/AUD’s fall from 1.6842 extended lower last week but recovered ahead of 1.6125 low. Initial bias is turned neutral this week first. On the downside, decisive break of 1.6125 will resume larger fall from 1.8554. Nevertheless, break of 1.6371 resistance will indicate short term bottoming, and turn bias back to the upside for stronger rebound

EUR/GBP Weekly Outlook - ActionForex

EUR/GBP Weekly Outlook – ActionForex

EUR/GBP recovered last week as it failed to break through 0.8610 support. Initial bias stays neutral this week first. On the downside, firm break of 0.8610 will carry larger bearish implications and pave the way to 0.8466 fibonacci level next. Nevertheless, firm break of 0.8676 will turn bias back to the upside for stronger rebound

EUR/JPY Weekly Outlook - ActionForex

EUR/JPY Weekly Outlook – ActionForex

EUR/JPY edged lower to 182.01 last week but rebounded since then. Initial bias remains neutral this week first. Break of 182.01 will extend the fall from 187.93 to 180.78 support. Nevertheless, firm break of 185.02 will suggest that pullback from 187.93 has completed, and turn bias back to the upside for retesting this high. In

0
Would love your thoughts, please comment.x
()
x