Gold
The gold market has initially felt during the week only to turn around and show signs of strength again. The $4,600 level continues to be very important, and I think you need to watch this very closely as it is an area that has caused both support and resistance multiple times in the past.

Gold, I think still has a very good shot at grinding to the upside, but I think ultimately, we have a situation where the interest rate markets continue to make things very difficult. In that environment, I think gold will continue to be choppy. On the longer-term charts, it still looks very bullish to me, and I think we will eventually make our way to the $5,000 level. That probably takes several things to happen, not the least of which would be the war in the Middle East to settle down.
USD/CHF
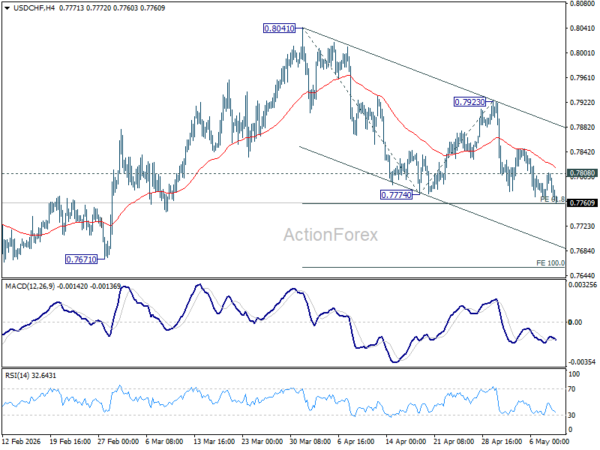
The US dollar initially rallied against the Swiss franc but has since fallen pretty significantly. Now it looks to be threatening an area of potential support near the 0.7750 level. This is one of those few pairs that I actually prefer the US dollar from a longer-term standpoint, but there are a lot of concerns out there as rates are dropping and people are concerned that war could expand and that does drive a bit of demand for the Swiss franc.

Ironically, once peace breaks out, rates will drop in America, but demand for the Swiss franc will drop, so this will be headline driven. Longer term I do think we will go higher.
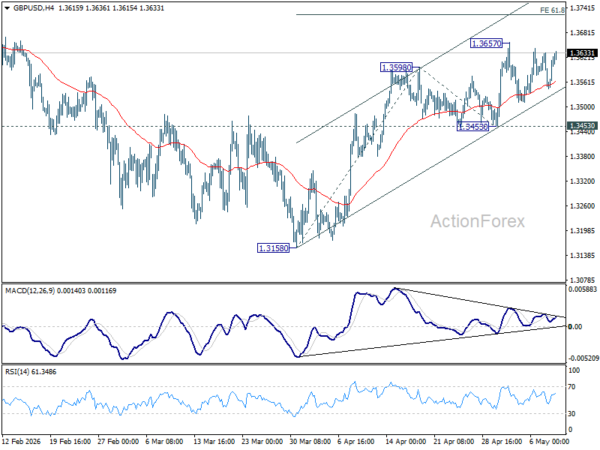
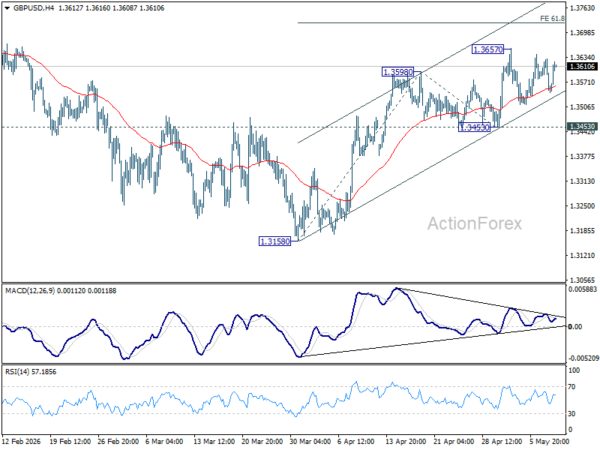
EUR/USD
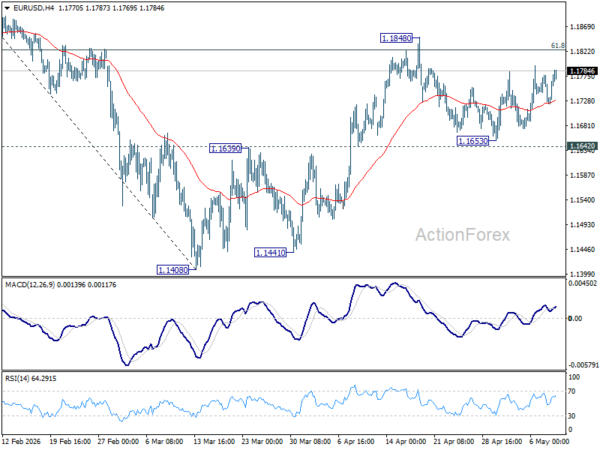
The Euro initially fell and then turned around to show signs of strength again, but we still have the same resistance near the 1.18 level extending all the way to the 1.1850 level. The 1.1850 level is a large area of selling pressure that we have seen keep markets compacted since summer of last year.

With this we will have to see if we can break out because we did try to do it a couple of times and every time we do, massive selling comes back into the picture. I suspect the range still holds.
BTC/USD
Bitcoin rallied for the week but has given back some gains, but it is worth noting that despite the fact that we formed a bit of a shooting star, the previous candlestick was also a hammer. This tells me that Bitcoin might spend some time going sideways for a while.

If we can break above the $84,000 level, that would be a very bullish sign, and I think ultimately could lead to much bigger moves higher. Short-term pullbacks I think continue to be buying opportunities for most traders.
USD/ZAR
If you were looking for volatility, you certainly would have found it trading the South African Rand during the week. We initially tried to rally, but we have dropped as the US dollar continues to struggle. This is something that I think continues to be the story here; you are looking to fade short-term rallies as the interest rate differential continues to favor South Africa and will for as long as we can probably imagine.

With that being said, I think ultimately you have a market that looks likely to reach the 16.20 level again, but the reality is that it is going to be more of a grind. It is a matter of collecting swap at the end of the day.
NASDAQ 100
The Nasdaq 100 continues to ignore gravity and now is extraordinarily overbought. This is a market that is in a ridiculous uptrend that sooner or later will see a significant pullback that probably hurts a lot of traders who get a little greedy.

That being said, I think the 28,000 level would be an area of interest that a lot of people will be trying to see if we can get back to and attract buyers.
USD/MXN
The US dollar has shown itself to be weak against the Mexican peso for some time. It continues to see the 17.50 level offer a major resistance barrier. The 17.50 level is an area where we have seen a lot of selling pressure previously, and I think ultimately this is a market that is still very much in a trading range between 17.20 at the bottom and 17.50 on the top.

Ultimately, I think if we can break above the weekly candlesticks of the last two weeks, that could allow the US dollar to go looking to the 18 level, but I suspect that would take some type of fear-based trade. Ultimately, it is probably more of a “fade the rally” type of scenario.
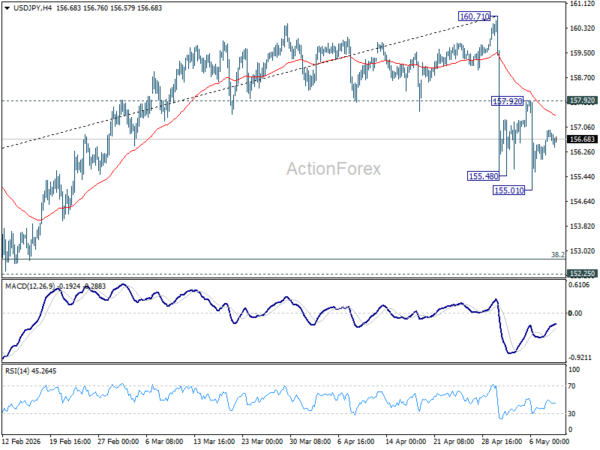
USD/JPY
The US dollar has been all over the place during the trading week against the Japanese yen after last week’s intervention by the Bank of Japan.

That being said, it is forming a candle that looks like it is stabilizing and this tells me there is a real possibility that we see another stab at the upside here. A break above 160.50 or maybe even the 162 region opens up a fresh new high from resistance going all the way back to 1990.