GBP/USD Bulls Facing Strong Resistance Overhead

The GBP/USD currency pair continues to trade within a range, which has been most notable by its repeated failures over recent days to break above the $1.3637 area. This currency pair usually moves quickly and easily into new price spaces with relatively few genuine retracements, so when it consolidates, traders can get discouraged easily.

This ranging pattern could be about to change, as bullish pressure is evidenced by the higher lows which can be seen in the recent price action over the past week or so.

What makes the USD currency pairs more interesting now is the relative uncertainty over the direction of the US Dollar, although the price action at the end of last week did suggest the Dollar looked heavy and could break to new lows.

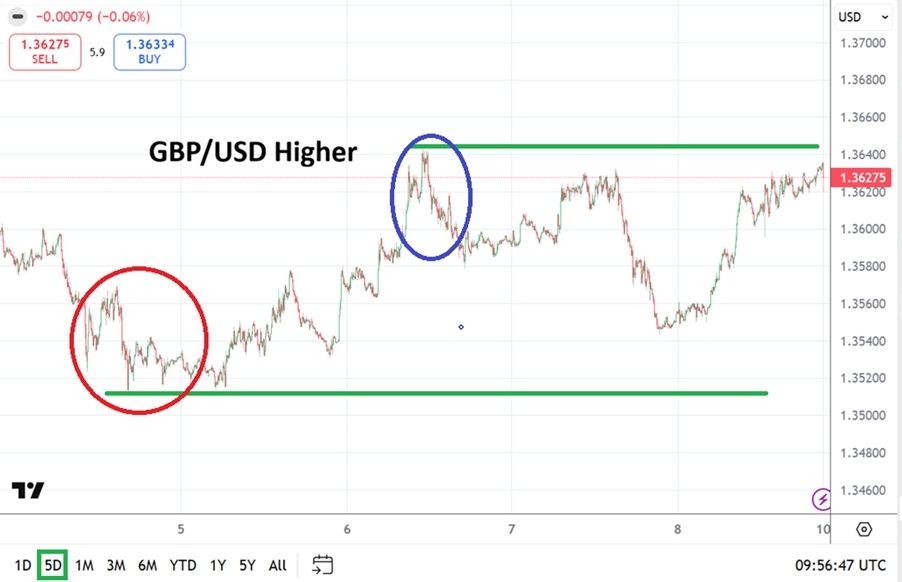
With the US Dollar looking uncertain but potentially vulnerable, this solidifies the anticipation of a potentially significant bullish breakout beyond the $1.3637 area. Looking at the price chart below, we can see that this level has been tested three times already. Repeated failures before a successful breakout tends to produce a more powerful breakout, which could generate powerful profits on the long side. However, it is worth noting that there is another key resistance level not far above $1.3637 which bulls would also have to overcome to make strong progress in a long trade.

It is this “coiling” below $1.3637 which is attracting the interest of more traders.

GBP/USD Technical Analysis

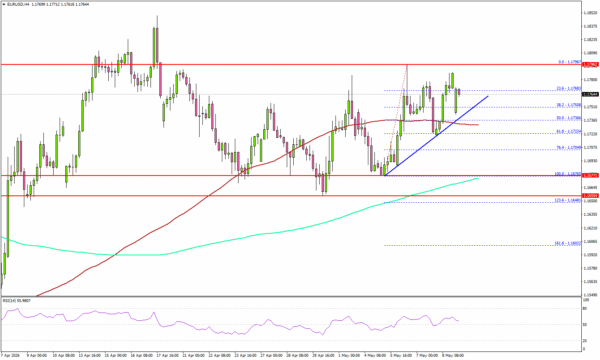
The price action is showing higher lows since 4th May but there is a clear line of resistance which is confluent with the round number at $1.3637 and then another one above that at $1.3666. There is no strong long-term trend, which supports the tendency of the price to range, although there is arguably a weak medium-term bullish trend, so I am generally more comfortable looking for a long. These features can be seen in the price chart below.

Trading this pair tends to work better on breakouts than pull backs, because it has such a tendency to make impulsive market movements quite easily – it is less liquid than the EUR/USD, with which it tends to be positively correlated.

The month of May has produced a consolidation with a flat top and a series of higher lows, and the pressure on the sell orders at about $1.3637 looks like it must be increasing.

Even if we do see a bullish breakout above $1.13637, it is not clear how much room the price will have to rise – there is a key resistance levels overhead nearby at $1.3666, although the next one beyond that is 40 pips away which is more meaningful.

image

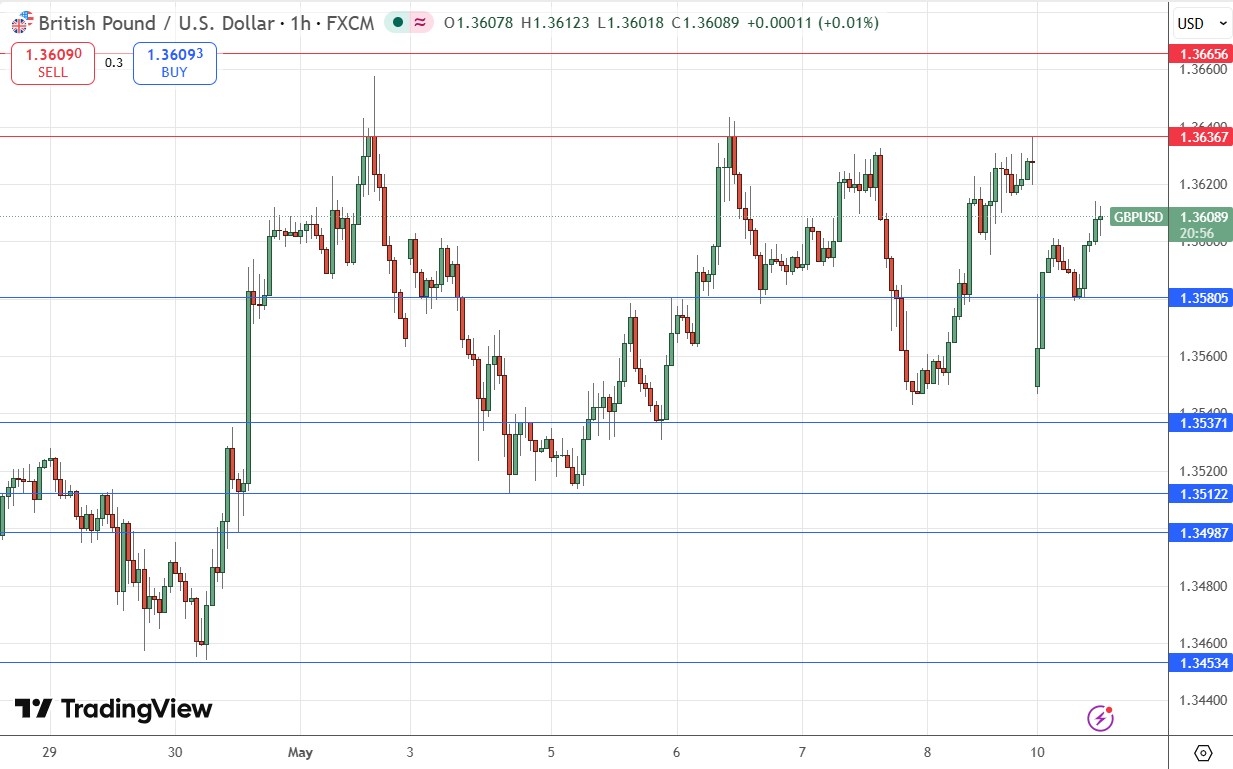
(image11052026gbpusd)

Watch Out for Sudden USD Strength

The USA / Iran war and related tensions have been going on for several months, so it is easy to forget about it, especially as President Trump has made so many threats that he did not follow through with. However, with Iran strongly rejecting US deal offers to end the war and insisting on terms which are well beyond President Trump’s red lines.

This means that a return to kinetic war, which would happen very suddenly, is a possibility. Although President Trump tries to make his military moves over weekends when financial markets are closed, sudden news of action, or even an accidental clash or escalation, could send the USD higher as it tends to get a boost as a safe haven in these circumstances.

Could a Short Trade Set Up?

It is usually best in Forex not to take too strong a directional bias. Although I see the best potential opportunity which will be likely to set up today as a long trade above $1.3666, don’t ignore the potential for a final and decisive rejection of the strong area of resistance confluent with the round number at $1.3637. After all, bulls face two resistance levels, and this pair is somewhat less bullish than the EUR/USD, suggesting if you are looking for a long against the USD, the EUR/USD currency pair would be better to trade.

A strong bearish rejection of the $1.3637 area with a large candle showing some impulsive bearish momentum, could be a good signal to go short, especially if that is accompanied by some news about the Iran conflict which points away from a peace agreement in the near term. The price should be able to fall all the way to $1.3580 without encountering any strong support.

My Take on GBP/USD

The thing to watch here today is likely going to be how the price reacts when it reaches $1.3637. This will probably be today’s pivotal point. If it gets established above $1.3666 long trades will likely be good opportunities; if it rejects $1.3637 with a firmly bearish move, a short trade will be an option.

It is a Monday today with zero high-impact economic data releases scheduled, so it might be a relatively slow day without a great deal of directional price movement.

Review, Support & Resistance Levels

My previous GBP/USD signal on 13th April was not triggered.

  • Risk 0.75%.
  • Trades must be taken before 5pm London time today.

Long Trade Ideas

  • Long entry following a bullish price action reversal on the H1 timeframe immediately upon the next touch of $1.3581, $1.3537, or $1.3512.

  • Place the stop loss 1 pip below the local swing low.

  • Move the stop loss to break even once the trade is 25 pips in profit.

  • Remove 50% of the position as profit when the price reaches 25 pips in profit and leave the remainder of the position to ride.

Short Trade Ideas

  • Go short following a bearish price action reversal on the H1 timeframe immediately upon the next touch of $1.3637, $1.3666, or $1.3707.

  • Place the stop loss 1 pip above the local swing high.

  • Move the stop loss to break even once the trade is 25 pips in profit.

  • Remove 50% of the position as profit when the price reaches 25 pips in profit and leave the remainder of the position to ride.

The best method to identify a classic “price action reversal” is for an hourly candle to close, such as a pin bar, a doji, an outside or even just an engulfing candle with a higher close. You can exploit these levels or zones by watching the price action that occurs at the given levels.

There is nothing of high importance scheduled today concerning either the British Pound or the US Dollar.

Ready to trade our daily Forex signals? Here is our list of the best Forex brokers in the world worth checking out.

Source link

Visited 1 times, 1 visit(s) today

Related Article

US Dollar Advances As Trump Labels Peace Offer 'Unacceptable'. Forecast as of 11.05.2026 | LiteFinance

US Dollar Advances As Trump Labels Peace Offer ‘Unacceptable’. Forecast as of 11.05.2026

2026.05.11 2026.05.11 US Dollar Advances As Trump Labels Peace Offer ‘Unacceptable’. Forecast as of 11.05.2026 Dmitri Demidenkohttps://www.litefinance.org/blog/authors/dmitri-demidenko/ Despite a strong US jobs report, the EUR/USD pair rose as US stock indices hit new record highs, driven by improved global risk appetite. However, the euro later faced a new gap. Let’s discuss these topics and develop a trading plan. The

CFDs broker YaMarkets shuts down

CFDs broker YaMarkets shuts down

Offshore CFDs broker YaMarkets is shutting down. The company, run mainly from Dubai and India and focused primarily on the Indian market, has taken down the yamarkets.com website, which now shows a Service Closure Announcement, that reads as follows: We would like to inform all clients and partners that Yamarkets has officially closed all services and

Image used for representation purpose only

Rupee crashes 139 paise to 94.90 against U.S. dollar

Image used for representation purpose only | Photo Credit: Getty Images/iStockphoto The rupee crashed 139 paise to 94.90 against the greenback in early trade on Monday (May 11, 2026) after President Donald Trump rejected Iran’s response to the U.S.’s peace proposal, following which crude oil prices surged rapidly. A strengthening U.S. dollar and steep FPI

EUR/USD Poised For Upside Break As Buying Pressure Builds

EUR/USD Poised For Upside Break As Buying Pressure Builds

Key Highlights EUR/USD stayed above 1.1675 and might attempt another increase. A bullish trend line is forming with support at 1.1750 on the 4-hour chart. GBP/USD seems to be consolidating gains above 1.3520. Bitcoin remains supported and might aim for a move above $82,000. EUR/USD Technical Analysis The Euro found support near 1.1675 against the

Canada’s Industry Data to Show Steadiness Amid Pressure from Tariffs, Disruptions

Canada’s Industry Data to Show Steadiness Amid Pressure from Tariffs, Disruptions

The week ahead is relatively quiet for major Canadian data releases, but industry reports will offer important signals about the economy’s momentum heading into spring. Early signs from Statistics Canada’s advance estimates suggest wholesale trade for April on Thursday and manufacturing sales next Friday should show the sectors finding their footing after significant disruptions to

The Weekly Bottom Line: Labor Market Resilient Despite Energy Shock

The Weekly Bottom Line: Labor Market Resilient Despite Energy Shock

Canadian Highlights Canada’s labour market remained soft in April, with employment down and the unemployment rate rising to 6.9%. Canada’s trade balance returned to surplus in March on stronger commodity exports, though net trade is still likely to subtract from Q1 GDP growth. A soft labour market and weak ex-energy trade should keep the Bank

GBP/USD Weekly Forecast - 10/05: Holds Higher Ground (Chart)

GBP/USD Weekly Forecast – 10/05: Holds Higher Ground (Chart)

Having seen a high around the 1.36450 mark on Wednesday, the GBP/USD went into this weekend around 1.36274. The currency pair has been correlating to the global Forex market in a straightforward manner per USD centric sentiment depending on what time of the day it is. While that sentence may seem to be a bit

EUR/CHF Weekly Outlook - ActionForex

EUR/CHF Weekly Outlook – ActionForex

EUR/CHF edged lower last week but failed to get rid of 0.9155 cluster support (38.2% retracement of 0.8979 to 0.9264 at 0.9155) cleanly. Initial bias stays neutral this week first. On the upside, break of 0.9177 minor resistance will turn bias back to the upside for 0.9264 resistance. However, sustained trading below 0.9155 will turn

Table of prices Gold 10/05/2026

Weekly Pairs in Focus 10th to 15th Mayo 2026 (Charts)

Gold The gold market has initially felt during the week only to turn around and show signs of strength again. The $4,600 level continues to be very important, and I think you need to watch this very closely as it is an area that has caused both support and resistance multiple times in the past.

EUR/AUD Weekly Outlook - ActionForex

EUR/AUD Weekly Outlook – ActionForex

EUR/AUD’s fall from 1.6842 extended lower last week but recovered ahead of 1.6125 low. Initial bias is turned neutral this week first. On the downside, decisive break of 1.6125 will resume larger fall from 1.8554. Nevertheless, break of 1.6371 resistance will indicate short term bottoming, and turn bias back to the upside for stronger rebound

EUR/GBP Weekly Outlook - ActionForex

EUR/GBP Weekly Outlook – ActionForex

EUR/GBP recovered last week as it failed to break through 0.8610 support. Initial bias stays neutral this week first. On the downside, firm break of 0.8610 will carry larger bearish implications and pave the way to 0.8466 fibonacci level next. Nevertheless, firm break of 0.8676 will turn bias back to the upside for stronger rebound

EUR/JPY Weekly Outlook - ActionForex

EUR/JPY Weekly Outlook – ActionForex

EUR/JPY edged lower to 182.01 last week but rebounded since then. Initial bias remains neutral this week first. Break of 182.01 will extend the fall from 187.93 to 180.78 support. Nevertheless, firm break of 185.02 will suggest that pullback from 187.93 has completed, and turn bias back to the upside for retesting this high. In

GBP/JPY Weekly Outlook - ActionForex

GBP/JPY Weekly Outlook – ActionForex

GBP/JPY stayed in range of 210.43/214.21 last week and outlook is unchanged. Initial bias remains neutral this week first. Below 210.43 will extend the fall from 216.58 to 209.58 support first. However, firm break of 214.21 will argue that the pullback from 216.58 has completed, and turn bias back to the upside for retesting this

USD/CAD Weekly Outlook - ActionForex

USD/CAD Weekly Outlook – ActionForex

USD/CAD recovered last week but upside is capped by 1.3709 resistance. Initial bias remains neutral this week first. On the downside, below 1.3549 will extend the fall from 1.3965 to retest 1.3480 low. Decisive break there will resume whole down trend from 1.4791. However, sustained break of 1.3709 will confirm short term bottoming, and turn

AUD/USD Weekly Report - ActionForex

AUD/USD Weekly Report – ActionForex

AUD/USD edged higher to 0.7277 last week as up trend continued, but retreated since then. Initial bias remains neutral this week for consolidations. Further rise is expected as long as 0.7101 support holds. Above 0.7277 will target 61.8% projection of 0.6420 to 0.7187 from 0.6832 at 0.7306. In the bigger picture, rise from 0.5913 (2024

USD/CHF Weekly Outlook - ActionForex

USD/CHF Weekly Outlook – ActionForex

USD/CHF’s decline from 0.8041 resumed last week. Initial bias stays on the downside this week. Firm break of 61.8% projection of 0.8041 to 0.7774 from 0.7923 at 0.7758 will target 100% projection at 0.7656. On the upside, above 0.7808 minor resistance will turn intraday bias neutral again first. In the bigger picture, as long as

EUR/USD Weekly Outlook - ActionForex

EUR/USD Weekly Outlook – ActionForex

EUR/USD stayed in range below 1.1848 last week and outlook is unchanged. Initial bias remains neutral, and further rise is expected with 1.1642 support intact. On the upside, firm break of 1.1848 will target 1.2081 high next. However, firm break of 1.1662 support will indicate the the rebound from 1.1408 has completed, and bring deeper

Markets Ignore Geopolitical Risks, Chase AI Rally, and Dump Dollar

Markets Ignore Geopolitical Risks, Chase AI Rally, and Dump Dollar

Markets spent last week aggressively chasing the AI-driven equity rally while largely ignoring geopolitical tensions in the Middle East. Despite renewed uncertainty over a promised peace deal, stocks surged to new records while Dollar weakened broadly on strong risk appetite. S&P 500 followed NASDAQ to fresh records, while Asia’s major technology-heavy benchmarks exploded higher as

USD/JPY Weekly Outlook - ActionForex

USD/JPY Weekly Outlook – ActionForex

USD/JPY dipped to 155.01 last week but recovered since then. Initial bias stays neutral this week first. On the downside, break of 155.01 will resume the fall from 160.71 to 152.25 support next. On the upside, however, firm break of 157.92 will indicate that pullback from 160.71 has completed, and turn bias back to the

0
Would love your thoughts, please comment.x
()
x