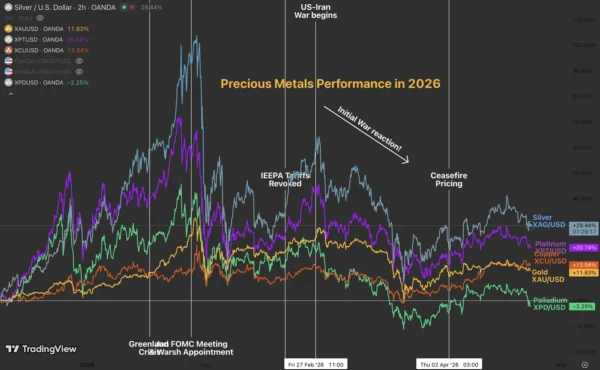
Weekly Pairs in Focus 26th April to 1st May 2026 (Charts)

Silver

The silver market has fallen pretty significantly during the course of the week as interest rates continue to be a main driver. After all, we are in a situation where a lot of traders just don’t know what to do with the risk coming out of the Middle East as the war seemingly although much calmer than it once was, is still some distance away from having an agreement between the United States and Iran.

Table of prices silver 26/04/2026

The $80 level is a little bit of resistance, if we were to break above there, then we could go higher, perhaps reaching towards the $90 level. Underneath, I would look at the $70 level as the floor.

Gold

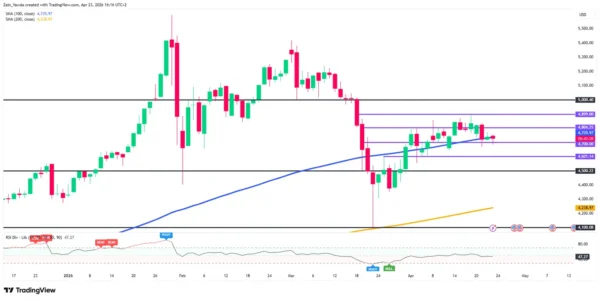
The gold market has gone back and forth during the trading week, showing the area just above the $4,600 level as being important. Much like the silver market, we have seen a lot of sensitivity to the interest rate market. So therefore, I watch the US 10-year yield, the 4.30 level continues to be a very important level and therefore I think you need to try to pay close attention to that. If we are above 4.3%, typically speaking, that’s negative for the gold market.
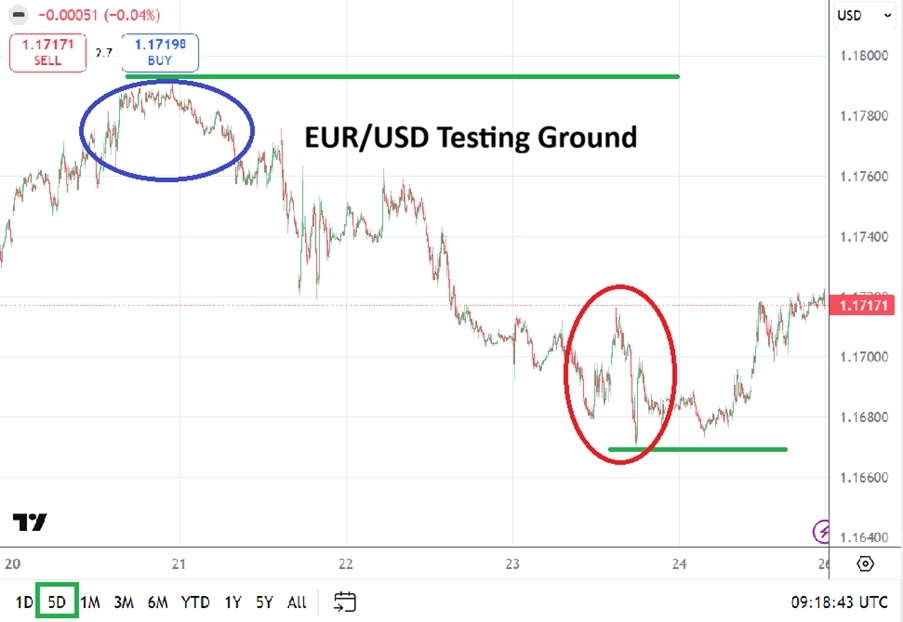
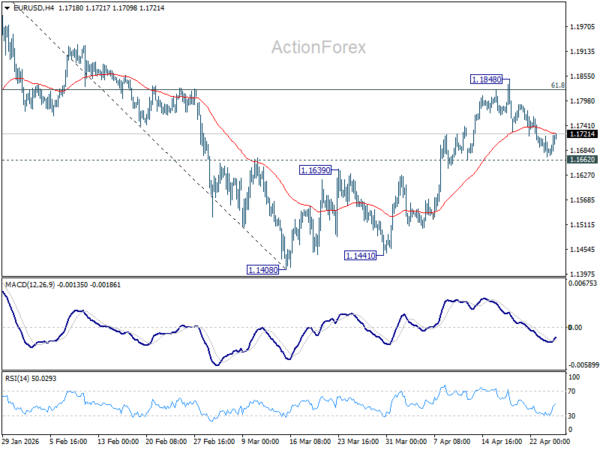
Table of prices gold 26/04/2026

EUR/USD

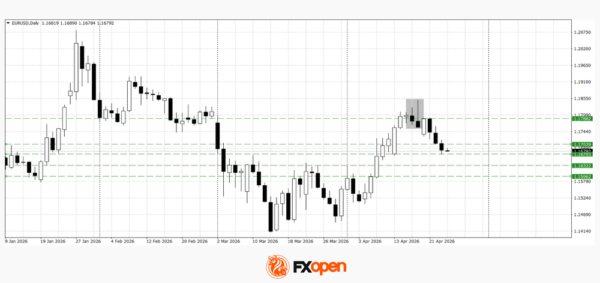
The Euro has been noisy during the week; we even tested the 1.18 level but ended a little bit negatively. Quite frankly we are close to the top of the range we have been in since this time last year, so I’m not really looking for anything major here. I think you’ve got a situation where traders are just trying to go back and forth.

Table of prices EUR/USD 26/04/2026

That being said interest rates in the United States and Germany are higher than they should be and with that and the news coming out of the war there is a lot of distortion in the market. Regardless though it is interesting that we have been sitting in the same range for so long and now that we are closer to the top, we’re starting to see selling pressure again.

GBP/USD

The British pound ended up in a fairly tight range for the week as traders are trying to sort out whether or not the war is going to end and of course what that means for interest rates.

The 1.35 level is an area that I think being not only a large round psychologically significant figure but it is also an area where a lot of people will be watching very closely. This is a market that I think is trying to determine where to go next.

Table of prices GBP/USD 26/04/2026

If we can break above the high of the previous week then we could go looking to the 1.3750 level. If we pull back then I’m looking at the 1.3350 level as a potential target for short sellers.

USD/MXN

The US dollar has been noisy during the week against the Mexican peso testing the 17.5 level.

This is an area that is significant support in the past as well as resistance so a lot of market memory could be here. If we can break above the 17.50 level, then it’s possible that we could go looking into the 17.8 level.

Table of prices USD/MXN 26/04/2026

A pullback from here just means that the US dollar is likely to continue to consolidate between the 17 and the 17.5 level. The interest rate differential continues to favor Mexico but if we do get more risk destruction out there the dollar will pick up.

NASDAQ 100

The Nasdaq 100 rallied rather significantly yet again during the week for the fourth week in a row we have seen a massive move to the upside. Short-term pullbacks I think open up the possibility of buying on some type of bounce in order to get on the right-hand side of the V. The 26,250 level is an area that previously had been resistance, and I would anticipate it would be support if we do in fact drop from here.

Table of prices Nasdaq 100 26/04/2026

Keep in mind that a lot of what the Nasdaq 100 is moving on is artificial intelligence and unfortunately headlines coming out of the Middle East.

BTC/USD

The Bitcoin market has rallied during the week, but it continues to see a little bit of pressure to the downside. This is going to be a slow grind higher as it looks like the Bitcoin market is going to try to get to the $84,000 level. That is an area that previously was a support level, and it should now be resistance.
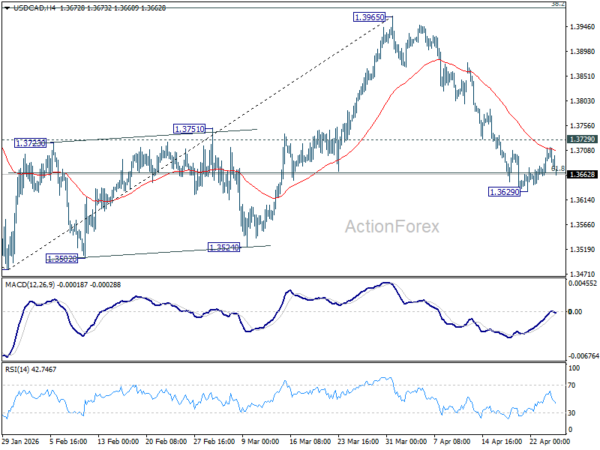
Table of prices BTC/USD 26/04/2026

USD/CAD

The $72,000 level continues to be important on pullbacks, and I would look at that as a potential area of buyers jumping back into this market to lift it up.

Table of prices USD/CAD 26/04/2026

The US dollar initially fell against the Canadian dollar but found enough support at the 200-week EMA to turn things around and form a bit of hammer.

If the market were to break above the 1.37 level, then we could see the US dollar go looking to the 1.38 level. The interest rate differential continues to favor the US dollar, and I think that will be a major driver of where we go.

Source link

Visited 1 times, 1 visit(s) today

Related Article

EUR/USD Weekly Forecast 26/04: Unstable Range (Chart)

EUR/USD Weekly Forecast 26/04: Unstable Range (Chart)

Created on April 26, 2026 The U.S Federal Reserve will release its FOMC Statement this coming weekend and is not expected to change the Federal Funds Rate. Now that this bit of information is out of the way, day traders should continue to focus on sentiment shifts developing because of the lack of clarity regarding

Forex Trading Platform Market Analysis By Application, Type,

Forex Trading Platform Market Analysis By Application, Type,

The Forex Trading Platform Market reached a valuation of 12.43 billion in 2025 and is anticipated to expand at a CAGR of 10.11% during the forecast period from 2026 to 2033, ultimately attaining an estimated value of 26.86 billion by 2033. Market growth is being driven by increasing demand across industrial, commercial, and technology-oriented applications,

RMB hiking play in forex options mkt

RMB hiking play in forex options mkt

A billboard in Shanghai displays renminbi”s foreign exchange rates. China Daily The renminbi’s rising prominence in global foreign exchange options is not an isolated development, but part of a broader, accelerating expansion of the Chinese currency’s international role across investment, financing and commodity pricing, analysts said. According to the London-based clearing house LCH, the yuan

EUR/CHF Weekly Outlook - ActionForex

EUR/CHF Weekly Outlook – ActionForex

EUR/CHF edged lower to 0.9159 last week but recovered just ahead of 0.9155 support. Outlook is unchanged and initial bias remains neutral this week for more consolidations below 0.9264. Further rally is expected with 0.9155 support intact. On the upside, firm break of 0.9264 will resume the rise from 0.8979 to 0.9394 resistance next. However,

EUR/GBP Weekly Outlook - ActionForex

EUR/GBP Weekly Outlook – ActionForex

EUR/GBP’s extended decline last week suggests that rebound from 0.8610 has completed at 0.8740 already. But as a temporary low was formed at 0.8652, initial bias stays neutral this week first. On the downside, below 0.8652 will resume the fall from 0.8740 to retest 0.8610 support next. Nevertheless, firm break of 0.8685 support turned resistance

EUR/JPY Weekly Outlook - ActionForex

EUR/JPY Weekly Outlook – ActionForex

EUR/JPY stayed in sideway trading last week and the development suggests that it’s merely in a near term consolidations. Initial bias remains neutral this week first. In case of another fall, downside should be contained by 38.2% retracement of 182.56 to 187.93 at 185.87 to bring rebound. On the upside, firm break of 187.93 will

USD/CAD Weekly Outlook - ActionForex

USD/CAD Weekly Outlook – ActionForex

USD/CAD fell to as low as 1.3629 last week but recovered since then. Initial bias remains neutral this week first. On the downside, sustained trading below 61.8% retracement of 1.3480 to 1.3965 at 1.3665 will pave the way to retest 1.3480 low. Nevertheless, break of 1.3729 minor resistance will turn bias back to the upside

USD/JPY Weekly Outlook - ActionForex

USD/JPY Weekly Outlook – ActionForex

USD/JPY extended consolidations below 160.45 last week and outlook is unchanged. Initial bias remains neutral this week. Further rise is expected with 157.49 cluster support (38.2% retracement of 152.25 to 160.45 at 157.31) intact. On the upside break of 160.45 will target a retest on 161.94 high. However, firm break of 157.31/49 will bring deeper

USD/CHF Weekly Outlook - ActionForex

USD/CHF Weekly Outlook – ActionForex

USD/CHF turned into consolidations last week and recovered, but overall outlook is unchanged. Initial bias remains neutral this week first. On the downside sustained break of 61.8% retracement of 0.7603 to 0.8041 at 0.7770 will pave the way to retest 0.7603 low. However, break of 0.7933 resistance will bring stronger rise back to retest 0.8041

EUR/USD Weekly Outlook - ActionForex

EUR/USD Weekly Outlook – ActionForex

EUR/USD’s gyrated lower last week but recovered ahead of 1.1662 support. Initial bias remains neutral this week first, and further rise is in favor. On the upside, sustained trading above 61.8% retracement of 1.2081 to 1.1408 at 1.1824 will pave the way to retest 1.2081 high. However, firm break of 1.1662 support will indicate the

EUR/AUD Weekly Outlook - ActionForex

EUR/AUD Weekly Outlook – ActionForex

EUR/AUD’s fall from 1.6842 extended lower to 1.6340 last week. But a temporary low should be in place on loss of momentum. Initial bias is turned neutral this week first. Further decline is expected as long as 1.6497 support turned resistance holds. Below 1.6340 will target a retest on 1.6125 low. Nevertheless, firm break of

USD/CHF Mid-Day Outlook - ActionForex

USD/CHF Mid-Day Outlook – ActionForex

Daily Pivots: (S1) 0.7808; (P) 0.7830; (R1) 0.7867; More…. USD/CHF recovers further today but stays well below 0.7933 resistance. Intraday bias remains neutral and further decline is expected. Sustained break of 61.8% retracement of 0.7603 to 0.8041 at 0.7770 will resume the decline from 0.8041 to retest 0.7603 low. In the bigger picture, rebound from

USD/CHF Price Analysis: Bulls Eye Key Resistance After Base Formation

USD/CHF Price Analysis: Bulls Eye Key Resistance After Base Formation

On the daily chart, USD/CHF is in a recovery phase, currently sandwiched between the 50-day MA (0.7845) and 100-day MA (0.7865). The H4 chart shows a more defined bullish structure, featuring a “Golden Cross” (100-period MA above 200-period MA). Failure to hold above the 0.7846 short-term support would negate the bullish setup and likely lead

EUR/USD and EUR/CAD Continue Correction Ahead of Key Data

EUR/USD and EUR/CAD Continue Correction Ahead of Key Data

The euro remains under pressure, extending its corrective decline following the previous impulsive rally. Market participants are taking profits and trimming positions ahead of key macroeconomic releases, reducing demand for the single currency and keeping both pairs near important levels, with the potential for increased volatility. Ongoing geopolitical uncertainty in the Middle East continues to

Silver (XAG/USD) Under Pressure from Ceasefire Clouds – In-depth Analysis

Silver (XAG/USD) Under Pressure from Ceasefire Clouds – In-depth Analysis

Precious metals have been the victim of a severe reality check since late January. Subjects of severe melt-ups since August 2025, following a slow but consistent grind higher from de-dollarization trends, the commodities got swept on all sides with extreme leverage and volatility. And in Financial Markets, it rarely translates into anything good – Silver

0
Would love your thoughts, please comment.x
()
x