USD/CHF Price Analysis: Bulls Eye Key Resistance After Base Formation

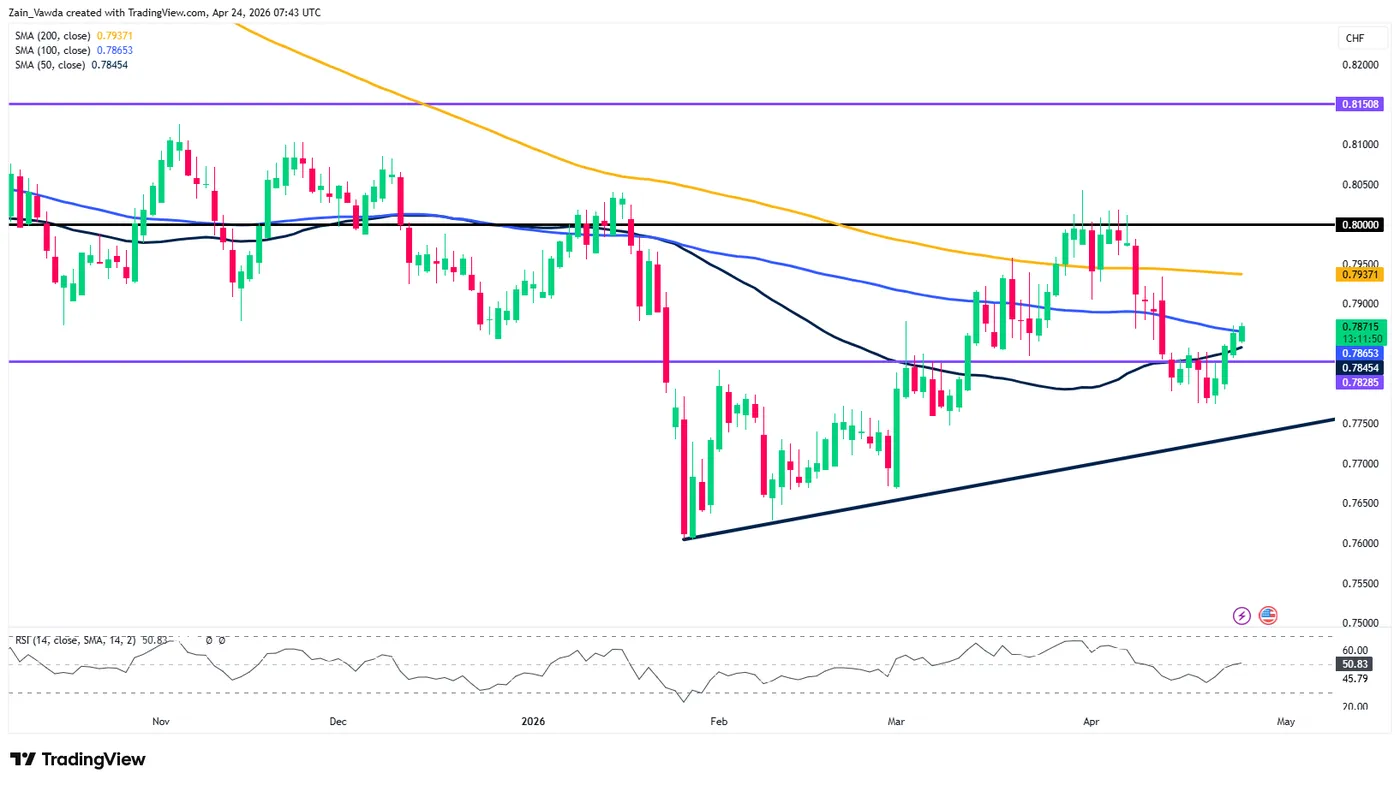
  • On the daily chart, USD/CHF is in a recovery phase, currently sandwiched between the 50-day MA (0.7845) and 100-day MA (0.7865).
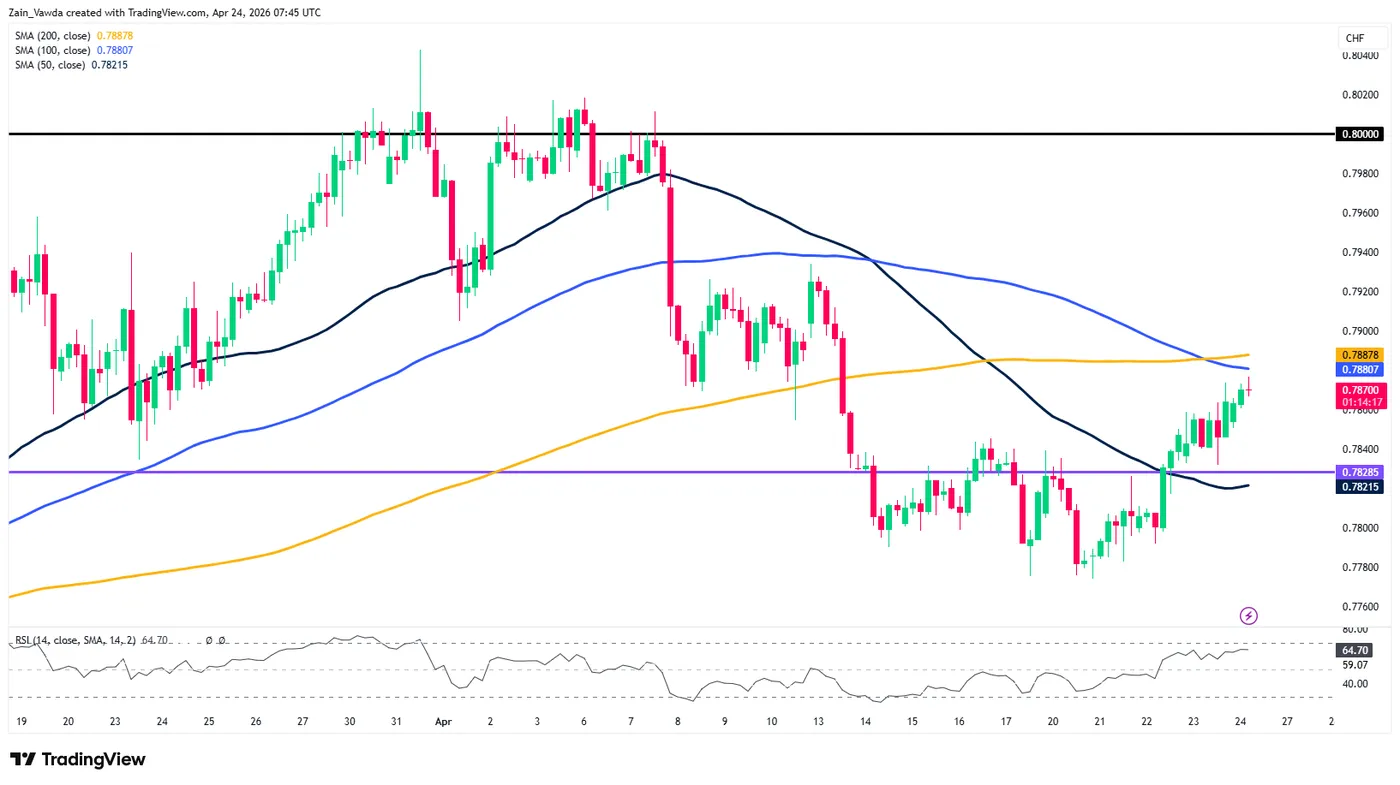
  • The H4 chart shows a more defined bullish structure, featuring a “Golden Cross” (100-period MA above 200-period MA).
  • Failure to hold above the 0.7846 short-term support would negate the bullish setup and likely lead to a retest of the 0.7828 support level.

USD/CHF Daily Chart: Building a Base Above Key Support

The daily timeframe shows USD/CHF in a recovery phase following the sharp sell-off witnessed in early 2026. After bottoming out near the 0.7600 handle, the pair has formed a series of higher lows, currently supported by an ascending trendline.

Price action is currently sandwiched between the 50-day MA (0.7845) and the 100-day MA (0.7865). A daily candle close above the 100-day MA would be a significant bullish signal, suggesting a shift in medium-term momentum.

However, the overhead 200-day MA at 0.7937 remains the “line in the sand” for bulls. Until that level is reclaimed, the overall daily structure remains cautious.

The RSI is hovering around the 50 midline, indicating a lack of clear directional conviction at this stage.

USD/CHF Daily Chart, April 24, 2026
Source: TradingView (click to enlarge)

H4 Chart: Testing the Golden Cross Zone

Moving down to the 4-hour chart, we see a more defined bullish structure. USD/CHF has successfully pushed above the 0.7828 horizontal support level, which previously acted as a ceiling during the consolidation in mid-April.

Notably, the H4 chart shows the 100-period MA crossing above the 200-period MA, often a precursor to sustained bullish momentum.

Price is currently testing the 200-period MA (0.7887). A sustained break above this level would open the door for a retest of the psychological 0.8000 resistance area. The RSI on this timeframe is rising toward 65.00, suggesting there is still room for further upside before reaching overbought conditions.

USD/CHF Four-Hour Chart, April 24, 2026
Source: TradingView (click to enlarge)

H1 Chart: Intra-day Scenarios and Key Levels

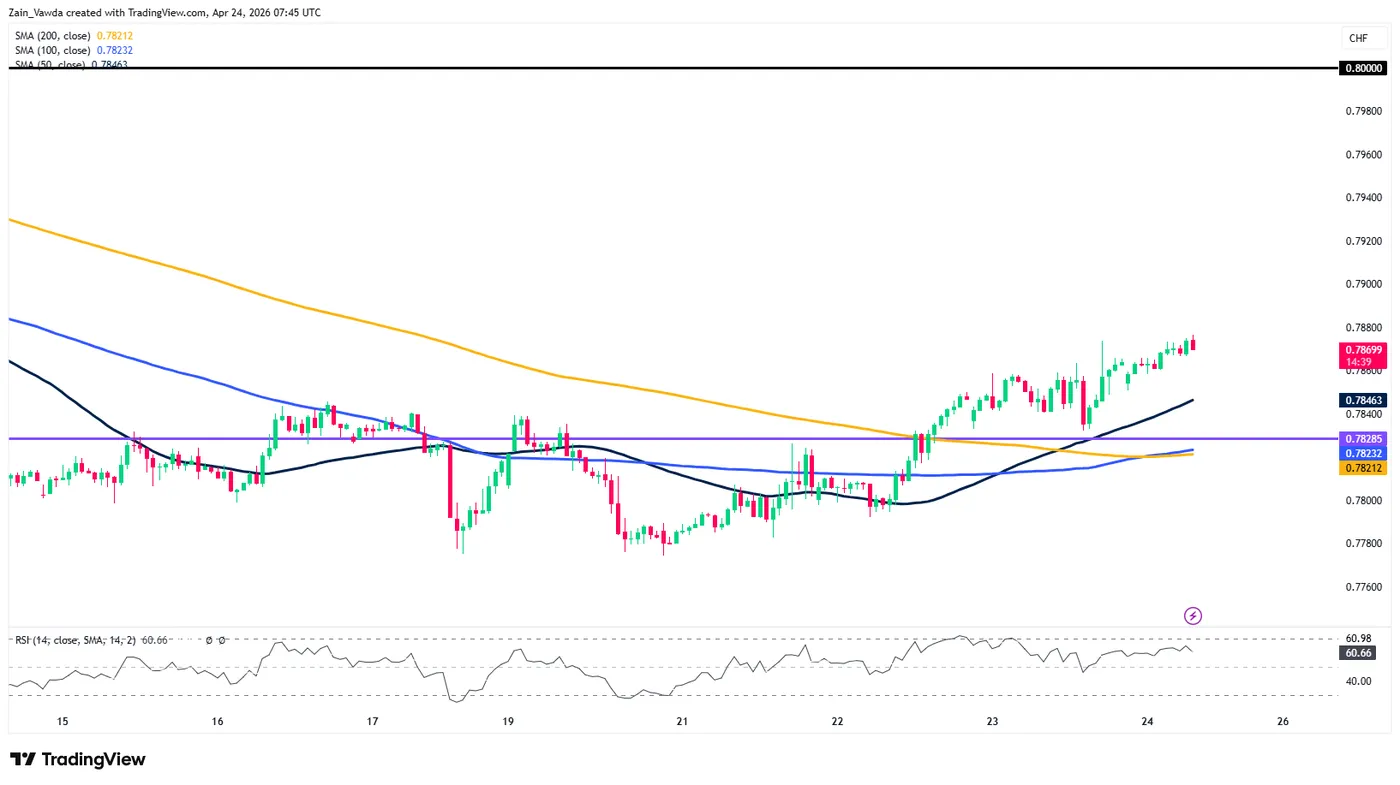
The 1-hour chart provides a granular view of the current breakout attempt. Price has found a foothold above all three major moving averages (50, 100, and 200), which are now beginning to fan out, supporting the bullish thesis.

Potential Bullish Scenario: If USD/CHF can maintain its position above the 0.7846 level (the recent swing high and current H1 support), bulls will likely target the 0.7887 (H4 200 MA) followed by the 0.7920 area. A clean break of 0.7920 would suggest a run toward the major psychological barrier at 0.8000. The path of least resistance currently appears to be to the upside, provided the 0.7840-0.7828 support zone holds.

Potential Bearish Scenario: Failure to clear the immediate overhead resistance near 0.7870/80 could result in a “bull trap.” If the pair slips back below the 0.7846 mark, it would likely revisit the 0.7828 support level. A break below 0.7828 would negate the short-term bullish bias and could see the pair slide back toward the 0.7800 handle as sellers regain control.

Key Levels to Watch:

  • Resistance: 0.7887, 0.7937, 0.8000
  • Support: 0.7846, 0.7828, 0.7780

USD/CHF One-Hour Chart, April 24, 2026
Source: TradingView (click to enlarge)

USD/CHF is at a critical juncture. The daily chart shows a recovery in progress, while the lower timeframes suggest an imminent breakout. Traders should watch the 0.7887 level closely; a breakout here could ignite a fresh wave of buying interest heading into the weekend.


Source link

Visited 1 times, 1 visit(s) today

Related Article

Stock Market Sell-Off: History Says This Is the Best Move to Make Right Now

So your portfolio is redder than a stoplight, and your AI stocks are doing their best impression of a deflating balloon. The Nasdaq Composite (^IXIC -0.21%) has fallen 7.6% from its early October highs, dragging other market indicators lower. Pullbacks of this magnitude tend to rattle investors, particularly those who piled into artificial intelligence plays

What the New Class C Share Structure Actually Means for Meta Platforms Stock Investors

Meta Platforms (META) is introducing non-voting Class C shares to widen its options for raising capital, rewarding employees, and financing acquisitions without weakening CEO Mark Zuckerberg’s voting control. On Wednesday, Oct. 21, the board approved the charter amendment alongside its Q3 results, with a revised certificate of incorporation scheduled to take effect on Tuesday, Jan.

5 Oversold AI Stocks: Where Wall Street Analysts Are Spotting 50%+ Upside

The AI selloff has opened a wide gap between share prices and Wall Street’s expectations. Some of the stocks below have lost nearly half their value in 30 days, while their average analyst targets still imply gains well above 50%. It sounds like an opportunity but can also mean the market has moved faster than

Is Nike Still a Growth Stock? Here’s the Answer.

By now, Nike (NYSE: NKE) shareholders are well aware that the company’s fiscal 2027 could be a tough stretch. In the company’s 2027 first-quarter earnings report, revenue fell 4% year over year to $11.2 billion, and net income slid 2% to $712 million. The athletic wear giant has been in the midst of a turnaround

Banner

UK police arrest 15-year-old boy for photoshopping local politician into rabbit

West Midlands Police in the United Kingdom, on August 3, detained a 15-year-old boy identified only as Fraser, for allegedly mocking a local politician, Simon Bennett, in social media posts, including one that photoshopped him into a rabbit. Police officers stormed the teenager’s family home in the early hours of the day while he was

Jim Cramer’s Case for “Accidental High Yielders” When the Fed Shakes the Market

Quick Read Verizon’s 6.3% yield is backed by strong coverage, with dividends consuming only 57% of EPS guidance and 58% of first-half free cash flow. T. Rowe Price’s quarterly dividend grew from $1.24 to $1.30 while its share price fell 37%, but $56.9 billion in 2025 client outflows signal real business damage. Cramer calls accidental

Verizon (VZ) Stock Looks Reasonable After A 62% Three Year Gain

Verizon Communications has delivered a strong multi year share price gain, leaving investors asking whether the current US$44.66 stock price is fully supported by the earnings the business is generating today. Over the past 3 years the stock has returned 62.4%, which puts more weight on the question of how closely its market value now

Air pollution, chemicals fuelling South Asia’s diabetes and heart disease crisis: Lancet paper

Diet and sedentary lifestyle only explain part of South Asia’s health epidemic. A new paper on Lancet argues that environmental exposure, including air pollution, endocrine-disrupting chemicals, and climate-related stress, is driving the surge in diseases Excess calorie consumption and physical inactivity are often cited as the main drivers of obesity, diabetes and heart disease. Yet,

Top 10 Best Places in the World to Visit in 2027

From Canada’s historic cities and coastal landscapes to Europe’s lesser-known cultural destinations, 2027 is shaping up to be an exciting year for travellers looking to explore somewhere different. While famous tourist hotspots continue to attract millions of visitors, destinations offering authentic local experiences, natural beauty, and distinctive cultural heritage are becoming increasingly appealing. The destinations

Storm Boelo causes chaos at Stansted as ‘do not travel’ warning issued | News UK

Back-to-back storms are causing havoc on the railway this weekend (Picture: Shutterstock/David Cold Weather) If you’re hoping to get to Stansted Airport this weekend, you may have to find alternative means thanks to Storm Boelo. Stormy weather disrupted Stansted Express services today, with a ‘do not travel’ warning issued. Yesterday evening, Greater Anglia said a

Can GigaCloud Technology (GCT) Stay Below Fair Value On Cash Flow?

GigaCloud Technology has delivered a very strong share price run in recent years, which naturally raises a question for anyone looking at the stock today. Are the cash flows behind GigaCloud Technology robust enough, and predictable enough, to support where the share price now trades? Over the past 3 years, GigaCloud Technology has produced a

0
Would love your thoughts, please comment.x
()
x