USD/CAD – Technical Analysis Forecast


  • Canada CPI and BOC Overnight Rate schedule
  • Technical Analysis for Monthly, Daily, and 4-hour charts

The Canadian Dollar opened 2024 with a decline against the US Dollar, the Forex pair USD/CAD rose from 1.3180 in late December 2023 to its current average price of 1.3380 and has been trading near this level for a few days. The pair held steady throughout the US CPI data release as well as the recent upside move in oil prices. Next week, markets are looking forward to December’s 2023 CPI data from Canada, the previous median CPI y/y was 3.4%, and the m/m was 0.1%. Traders will be watching the CPI data closely as the release is scheduled ahead of the Bank of Canada Monetary Policy Report, Overnight Rate, and Rate Statement scheduled on the morning of January 24th, 2024 local time. It is also important to bear in mind the potential risks that may arise due to the recent developments in the Middle East and its potential impact on Oil Prices.
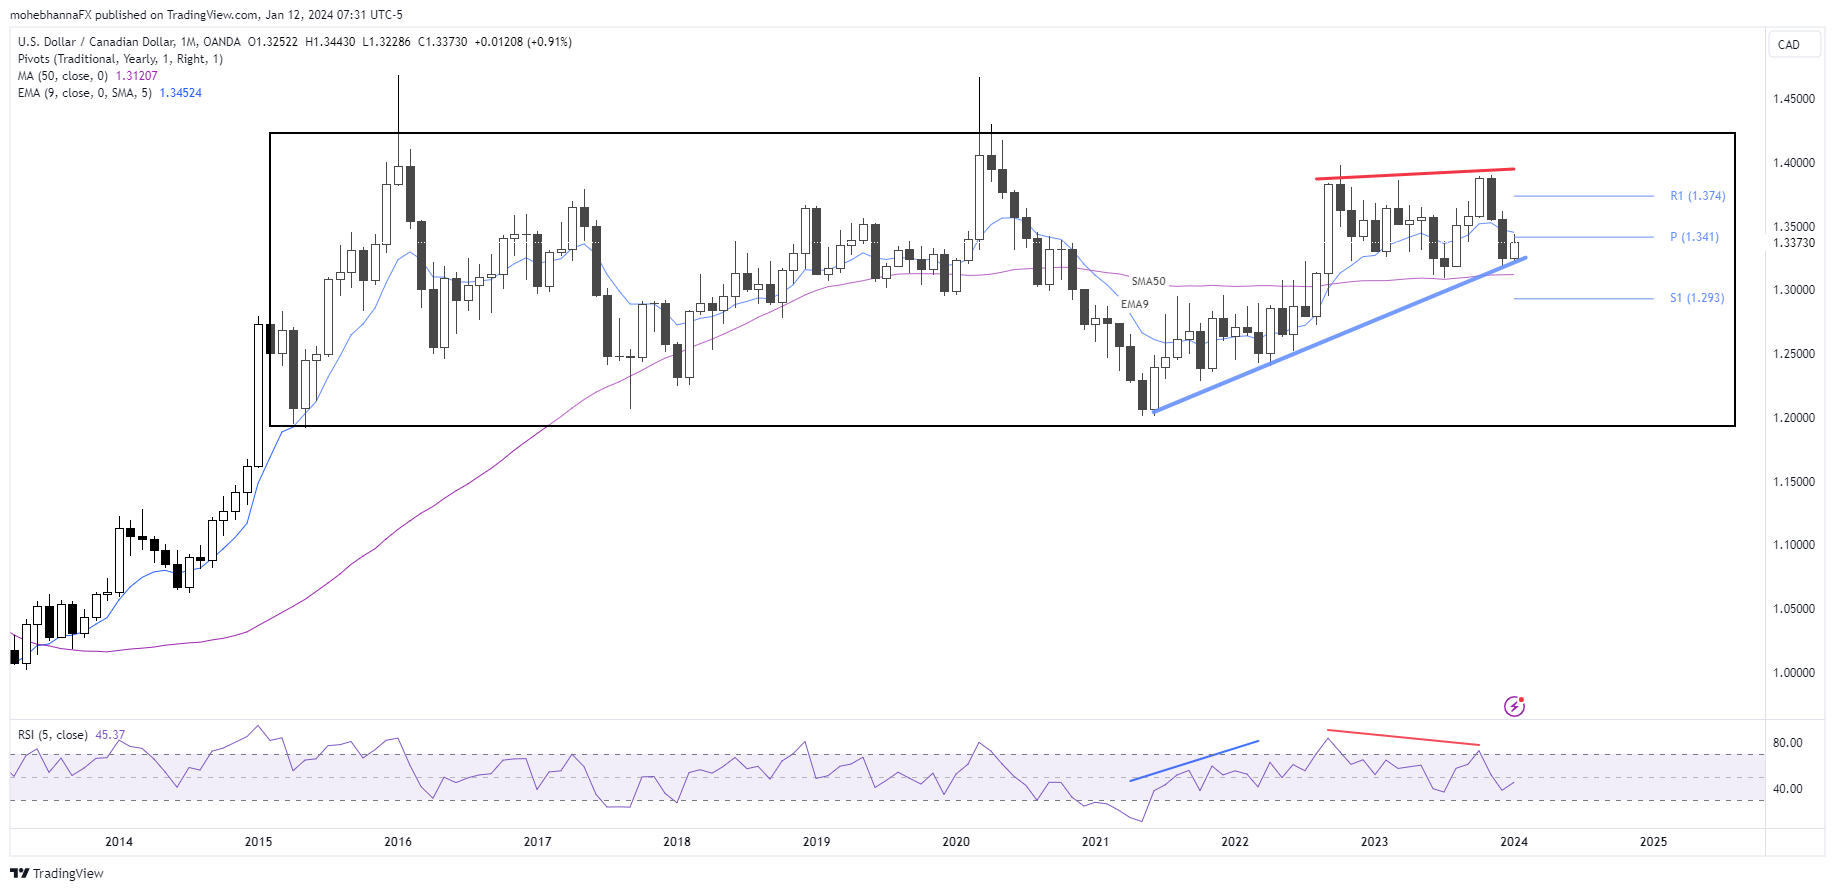
Monthly Chart

  • Price action continues to trade within its long-term trading range established in 2015, price is currently at mid-range (Rectangular area), however, price action is still finding support above the ascending trendline established in mid-2021. (Blue line)
  • Negative divergence between price action and RSI indicator (Red lines), price action made higher highs while RSI plotted a lower high for the same move. Although RSI is moving towards its oversold territory, it remains near the indicator’s neutral level.
  • Price action continues to trade below its EMA9 which intersects with the annual pivot point of 1.3410, price attempted to break above this level in January but has been unsuccessful so far. On the other hand, price action remains above its SMA50 which intersects with the ascending blue trendline.
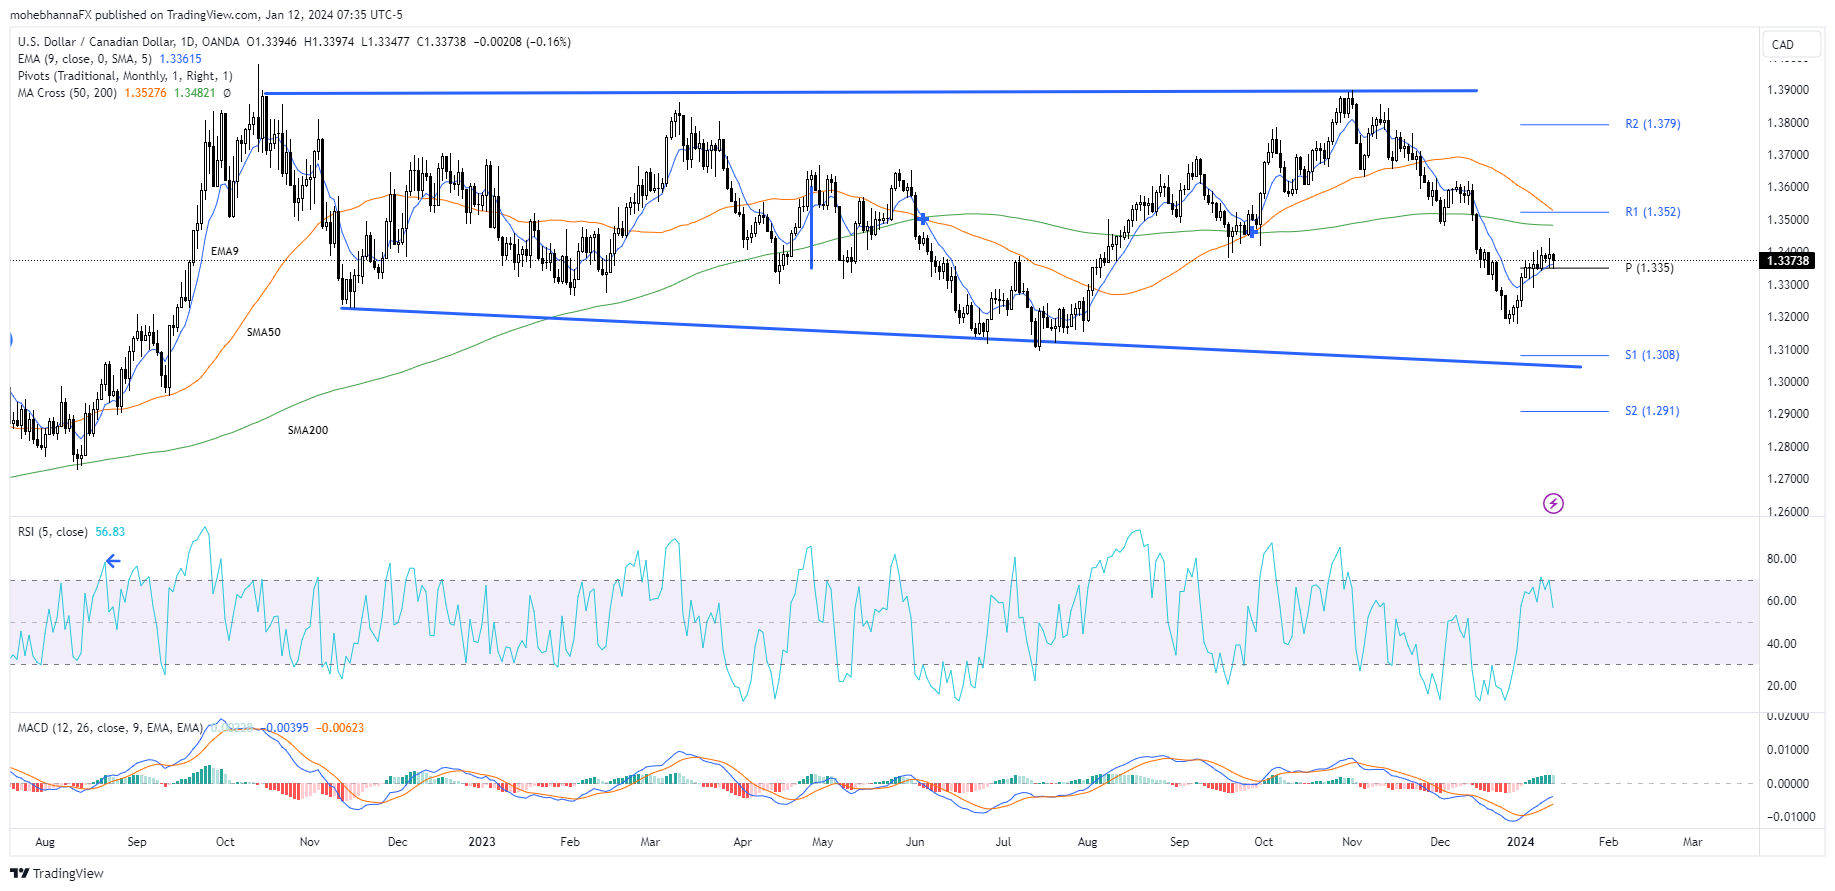
Daily Chart

Price action continues to trade within its 2023 trading range, and is at mid-range, the same as the monthly chart.

  • Price is trading below its SMA 50 and SMA 200, however, it recently found support above its EMA9 and has been trading above its monthly pivot point of 1.3350 for a few days so far.
  • RSI is within its overbought level, inline with recent price action, while MACD line crossed above its signal line.
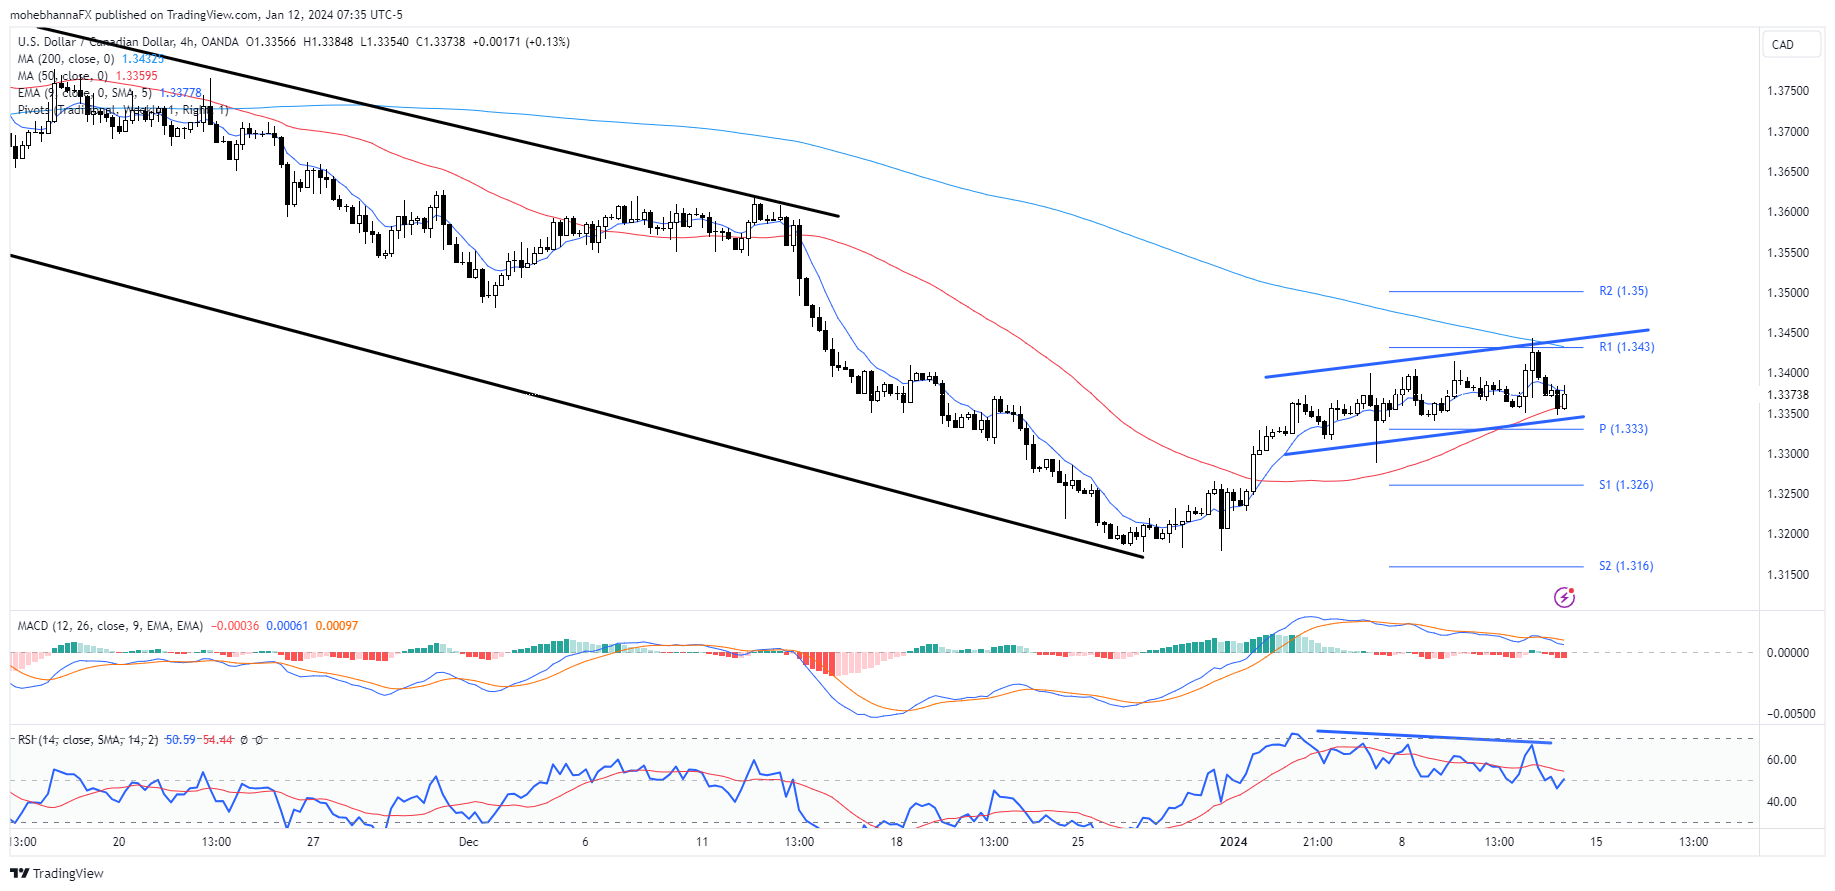
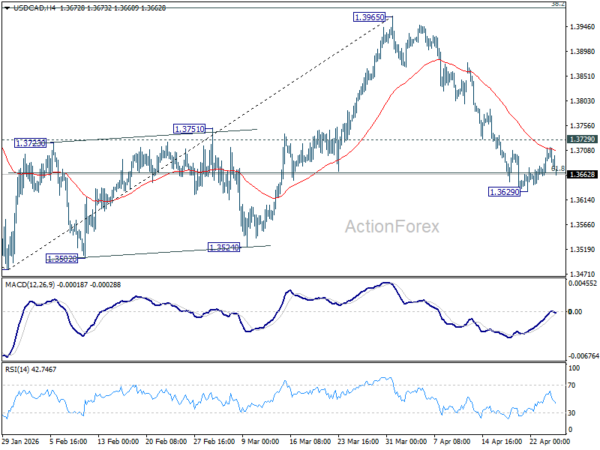
4-Hour Chart

  • Price was trading within a descending channel and currently appears to be attempting to complete a rising wedge formation. If price action breaks below and continues to trade below the wedge pattern, it can be considered a continuation pattern for the descending channel.
  • The same wedge pattern is also accompanied by a negative divergence on RSI.
  • The MACD line is reflecting a negative divergence and the MACD line just crossed below the signal line


Source link

Visited 1 times, 1 visit(s) today

Related Article

EUR/USD Tests Support—Can It Recover And Resume Upside?

EUR/USD Tests Support—Can It Recover And Resume Upside?

Key Highlights EUR/USD corrected gains and tested the 1.1665 support. A bullish trend line is forming with support at 1.1690 on the 4-hour chart. GBP/USD could continue to move higher toward the 1.3620 resistance. Gold prices are stuck in a range below the $4,800 resistance. EUR/USD Technical Analysis The Euro started a downside correction from

GBP/USD Builds Momentum While EUR/GBP Dips Once More

GBP/USD Builds Momentum While EUR/GBP Dips Once More

GBP/USD is showing positive signs above 1.3500 and 1.3525. EUR/GBP declined and is now consolidating losses below 0.8700. Important Takeaways for GBP/USD and EUR/GBP Analysis Today The British Pound started a fresh increase above 1.3500 to enter a positive zone. There was a break above a key bearish trend line with resistance at 1.3510 on

CFI trading volumes hit record $2.3 trillion in Q1 2026

CFI trading volumes hit record $2.3 trillion in Q1 2026

Leading online trading services provider CFI Financial Group has announced that it started 2026 with its strongest quarter to date, recording trading volumes of USD $2.3 trillion. This represents an 11% increase compared to Q4 2025,and an 81% rise year-on-year, building on the momentum of a strong 2025, where total volumes reached USD $6.4 trillion.

USD/CAD Daily Outlook - ActionForex

USD/CAD Daily Outlook – ActionForex

Daily Pivots: (S1) 1.3651; (P) 1.3683; (R1) 1.3705; More… Intraday bias in USD/CAD stays neutral and more consolidations could be seen above 1.3629. Further decline is expected with 1.3729 resistance intact. On the downside, sustained trading below 61.8% retracement of 1.3480 to 1.3965 at 1.3665 will pave the way to retest 1.3480 low. Nevertheless, break

USD/CHF Daily Outlook - ActionForex

USD/CHF Daily Outlook – ActionForex

Daily Pivots: (S1) 0.7837; (P) 0.7858; (R1) 0.7870; More…. Intraday bias in USD/CHF remains neutral for the moment. Further decline is expected as long as 0.7933 resistance holds. On the downside, sustained break of 61.8% retracement of 0.7603 to 0.8041 at 0.7770 will pave the way to retest 0.7603 low. However, break of 0.7933 resistance

Table of prices silver 26/04/2026

Weekly Pairs in Focus 26th April to 1st May 2026 (Charts)

Created on April 26, 2026 Silver The silver market has fallen pretty significantly during the course of the week as interest rates continue to be a main driver. After all, we are in a situation where a lot of traders just don’t know what to do with the risk coming out of the Middle East

EUR/USD Weekly Forecast 26/04: Unstable Range (Chart)

EUR/USD Weekly Forecast 26/04: Unstable Range (Chart)

Created on April 26, 2026 The U.S Federal Reserve will release its FOMC Statement this coming weekend and is not expected to change the Federal Funds Rate. Now that this bit of information is out of the way, day traders should continue to focus on sentiment shifts developing because of the lack of clarity regarding

Forex Trading Platform Market Analysis By Application, Type,

Forex Trading Platform Market Analysis By Application, Type,

The Forex Trading Platform Market reached a valuation of 12.43 billion in 2025 and is anticipated to expand at a CAGR of 10.11% during the forecast period from 2026 to 2033, ultimately attaining an estimated value of 26.86 billion by 2033. Market growth is being driven by increasing demand across industrial, commercial, and technology-oriented applications,

RMB hiking play in forex options mkt

RMB hiking play in forex options mkt

A billboard in Shanghai displays renminbi”s foreign exchange rates. China Daily The renminbi’s rising prominence in global foreign exchange options is not an isolated development, but part of a broader, accelerating expansion of the Chinese currency’s international role across investment, financing and commodity pricing, analysts said. According to the London-based clearing house LCH, the yuan

EUR/CHF Weekly Outlook - ActionForex

EUR/CHF Weekly Outlook – ActionForex

EUR/CHF edged lower to 0.9159 last week but recovered just ahead of 0.9155 support. Outlook is unchanged and initial bias remains neutral this week for more consolidations below 0.9264. Further rally is expected with 0.9155 support intact. On the upside, firm break of 0.9264 will resume the rise from 0.8979 to 0.9394 resistance next. However,

EUR/GBP Weekly Outlook - ActionForex

EUR/GBP Weekly Outlook – ActionForex

EUR/GBP’s extended decline last week suggests that rebound from 0.8610 has completed at 0.8740 already. But as a temporary low was formed at 0.8652, initial bias stays neutral this week first. On the downside, below 0.8652 will resume the fall from 0.8740 to retest 0.8610 support next. Nevertheless, firm break of 0.8685 support turned resistance

EUR/JPY Weekly Outlook - ActionForex

EUR/JPY Weekly Outlook – ActionForex

EUR/JPY stayed in sideway trading last week and the development suggests that it’s merely in a near term consolidations. Initial bias remains neutral this week first. In case of another fall, downside should be contained by 38.2% retracement of 182.56 to 187.93 at 185.87 to bring rebound. On the upside, firm break of 187.93 will

USD/CAD Weekly Outlook - ActionForex

USD/CAD Weekly Outlook – ActionForex

USD/CAD fell to as low as 1.3629 last week but recovered since then. Initial bias remains neutral this week first. On the downside, sustained trading below 61.8% retracement of 1.3480 to 1.3965 at 1.3665 will pave the way to retest 1.3480 low. Nevertheless, break of 1.3729 minor resistance will turn bias back to the upside

USD/JPY Weekly Outlook - ActionForex

USD/JPY Weekly Outlook – ActionForex

USD/JPY extended consolidations below 160.45 last week and outlook is unchanged. Initial bias remains neutral this week. Further rise is expected with 157.49 cluster support (38.2% retracement of 152.25 to 160.45 at 157.31) intact. On the upside break of 160.45 will target a retest on 161.94 high. However, firm break of 157.31/49 will bring deeper

USD/CHF Weekly Outlook - ActionForex

USD/CHF Weekly Outlook – ActionForex

USD/CHF turned into consolidations last week and recovered, but overall outlook is unchanged. Initial bias remains neutral this week first. On the downside sustained break of 61.8% retracement of 0.7603 to 0.8041 at 0.7770 will pave the way to retest 0.7603 low. However, break of 0.7933 resistance will bring stronger rise back to retest 0.8041

EUR/USD Weekly Outlook - ActionForex

EUR/USD Weekly Outlook – ActionForex

EUR/USD’s gyrated lower last week but recovered ahead of 1.1662 support. Initial bias remains neutral this week first, and further rise is in favor. On the upside, sustained trading above 61.8% retracement of 1.2081 to 1.1408 at 1.1824 will pave the way to retest 1.2081 high. However, firm break of 1.1662 support will indicate the

EUR/AUD Weekly Outlook - ActionForex

EUR/AUD Weekly Outlook – ActionForex

EUR/AUD’s fall from 1.6842 extended lower to 1.6340 last week. But a temporary low should be in place on loss of momentum. Initial bias is turned neutral this week first. Further decline is expected as long as 1.6497 support turned resistance holds. Below 1.6340 will target a retest on 1.6125 low. Nevertheless, firm break of

0
Would love your thoughts, please comment.x
()
x