On September 15, we advised investors to proceed with caution. We pushed out our 8,400 S&P 500 target from year-end 2026 to mid-2027 and set 7,900 as our new year-end target. On October 14, we reiterated our caution. Sure enough, the stock market has been turbulent since mid-September, with AI-related stocks falling sharply.
We are seeing some buying opportunities, but better ones are likely after the November 3 midterm elections. Our main concern is a likely escalation of the Middle East war. That could push oil prices above their $120 peak earlier this year.
I. Stock Market Performance
The S&P 500 is still up double digits ytd at 11.4% (chart). XMAGS is up 13.1%, while MAGS is up only 6.2%. The gap has widened again in recent weeks as MAGS rolled over. Meta led the latest leg down, falling 9.4% last week after reporting earnings.
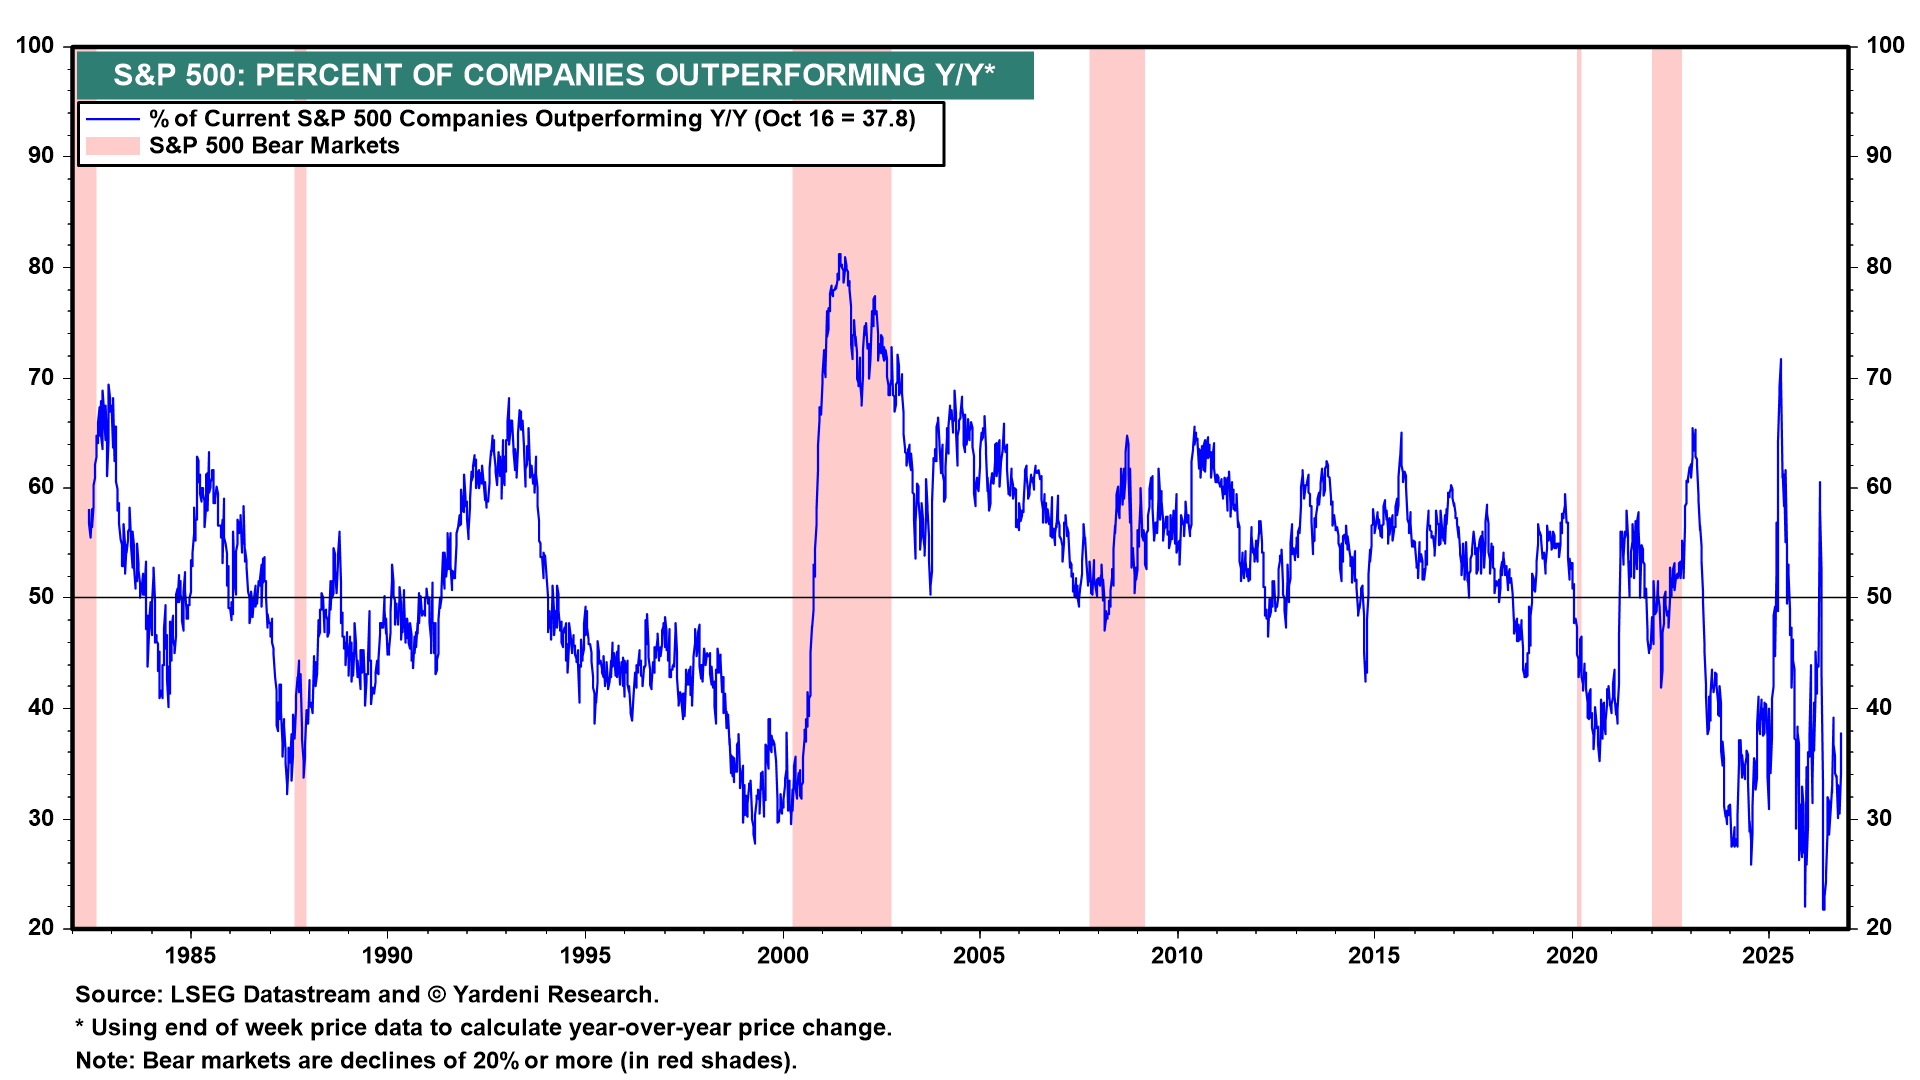
Breadth remained on the weak side. Only 37.8% of S&P 500 companies are outperforming the index on a y/y basis (chart).
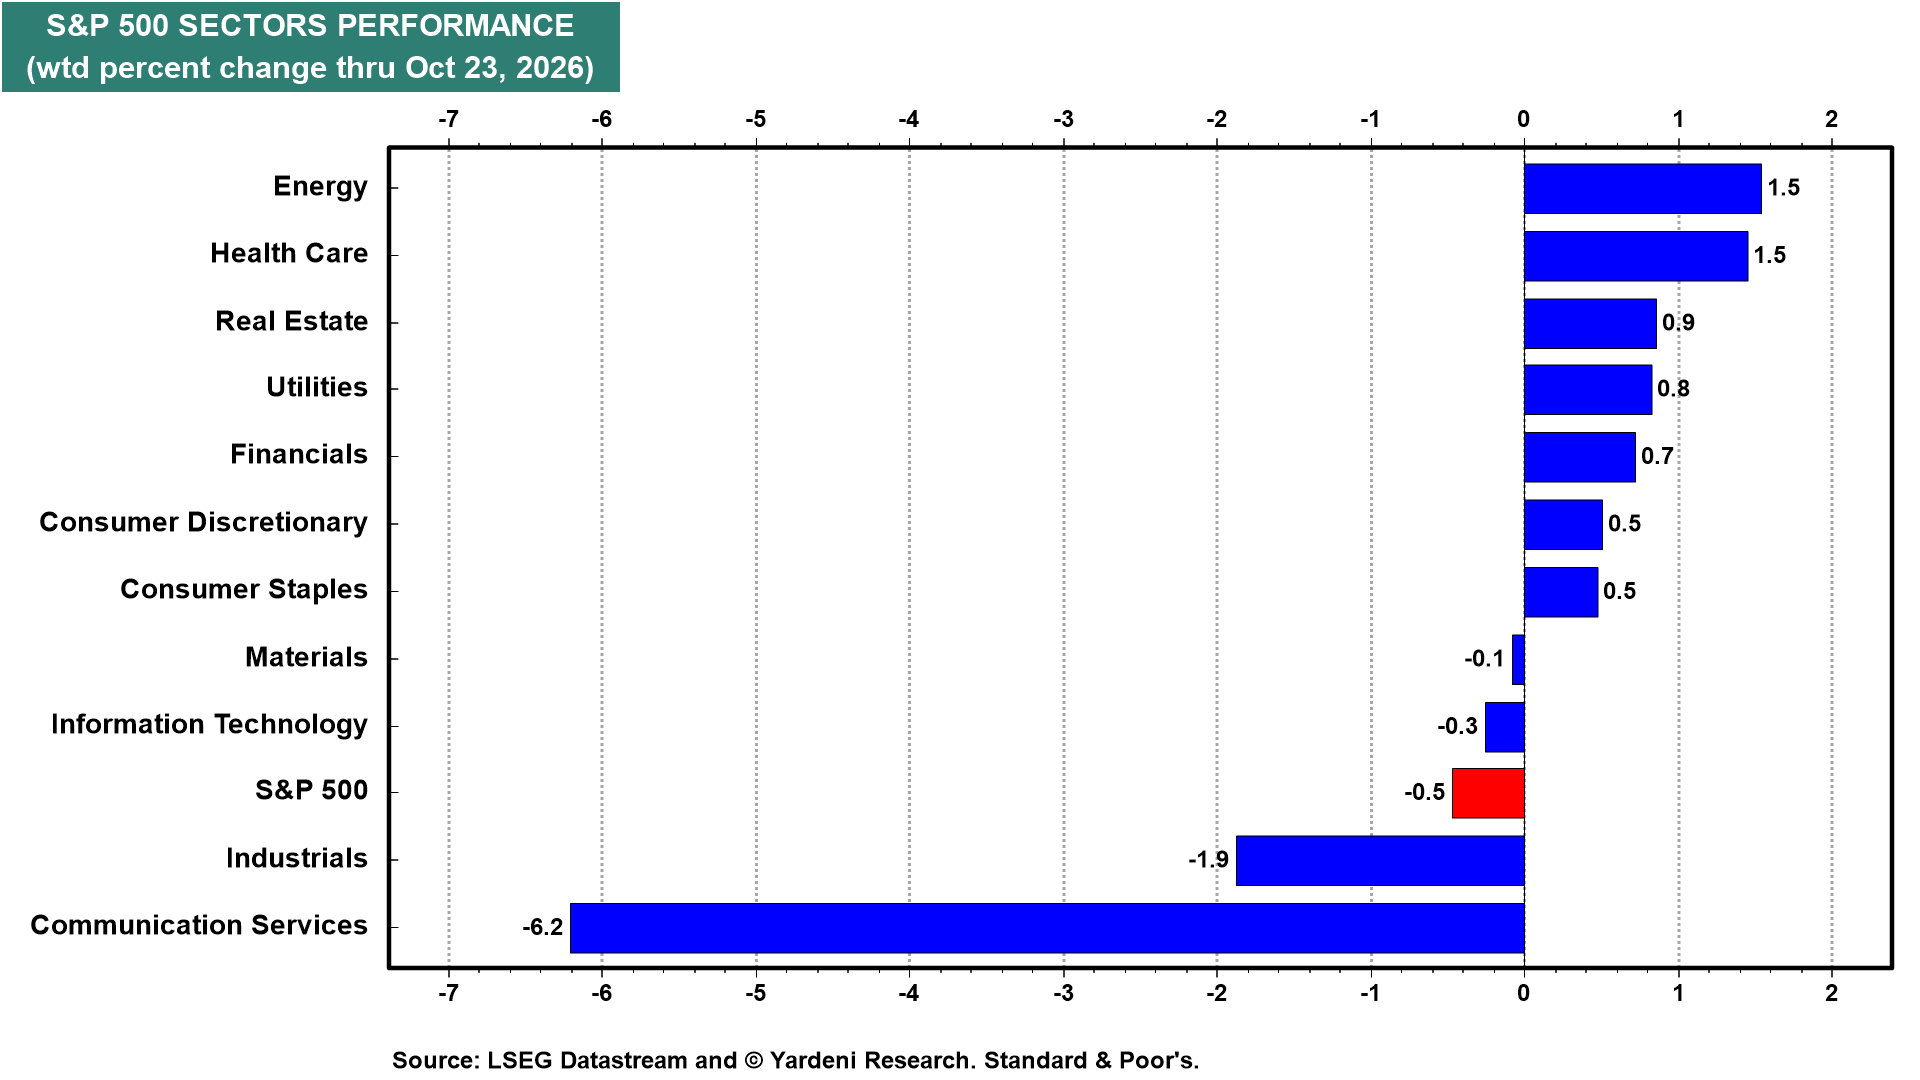
Rotation was notable last week. The S&P 500 Energy and Health Care sectors led with gains of 1.5% each (chart). Communication Services fell 6.2%, and Industrials dropped 1.9%. As bad as the week felt, the S&P 500 was down only 0.5%.
II. S&P 500 Earnings
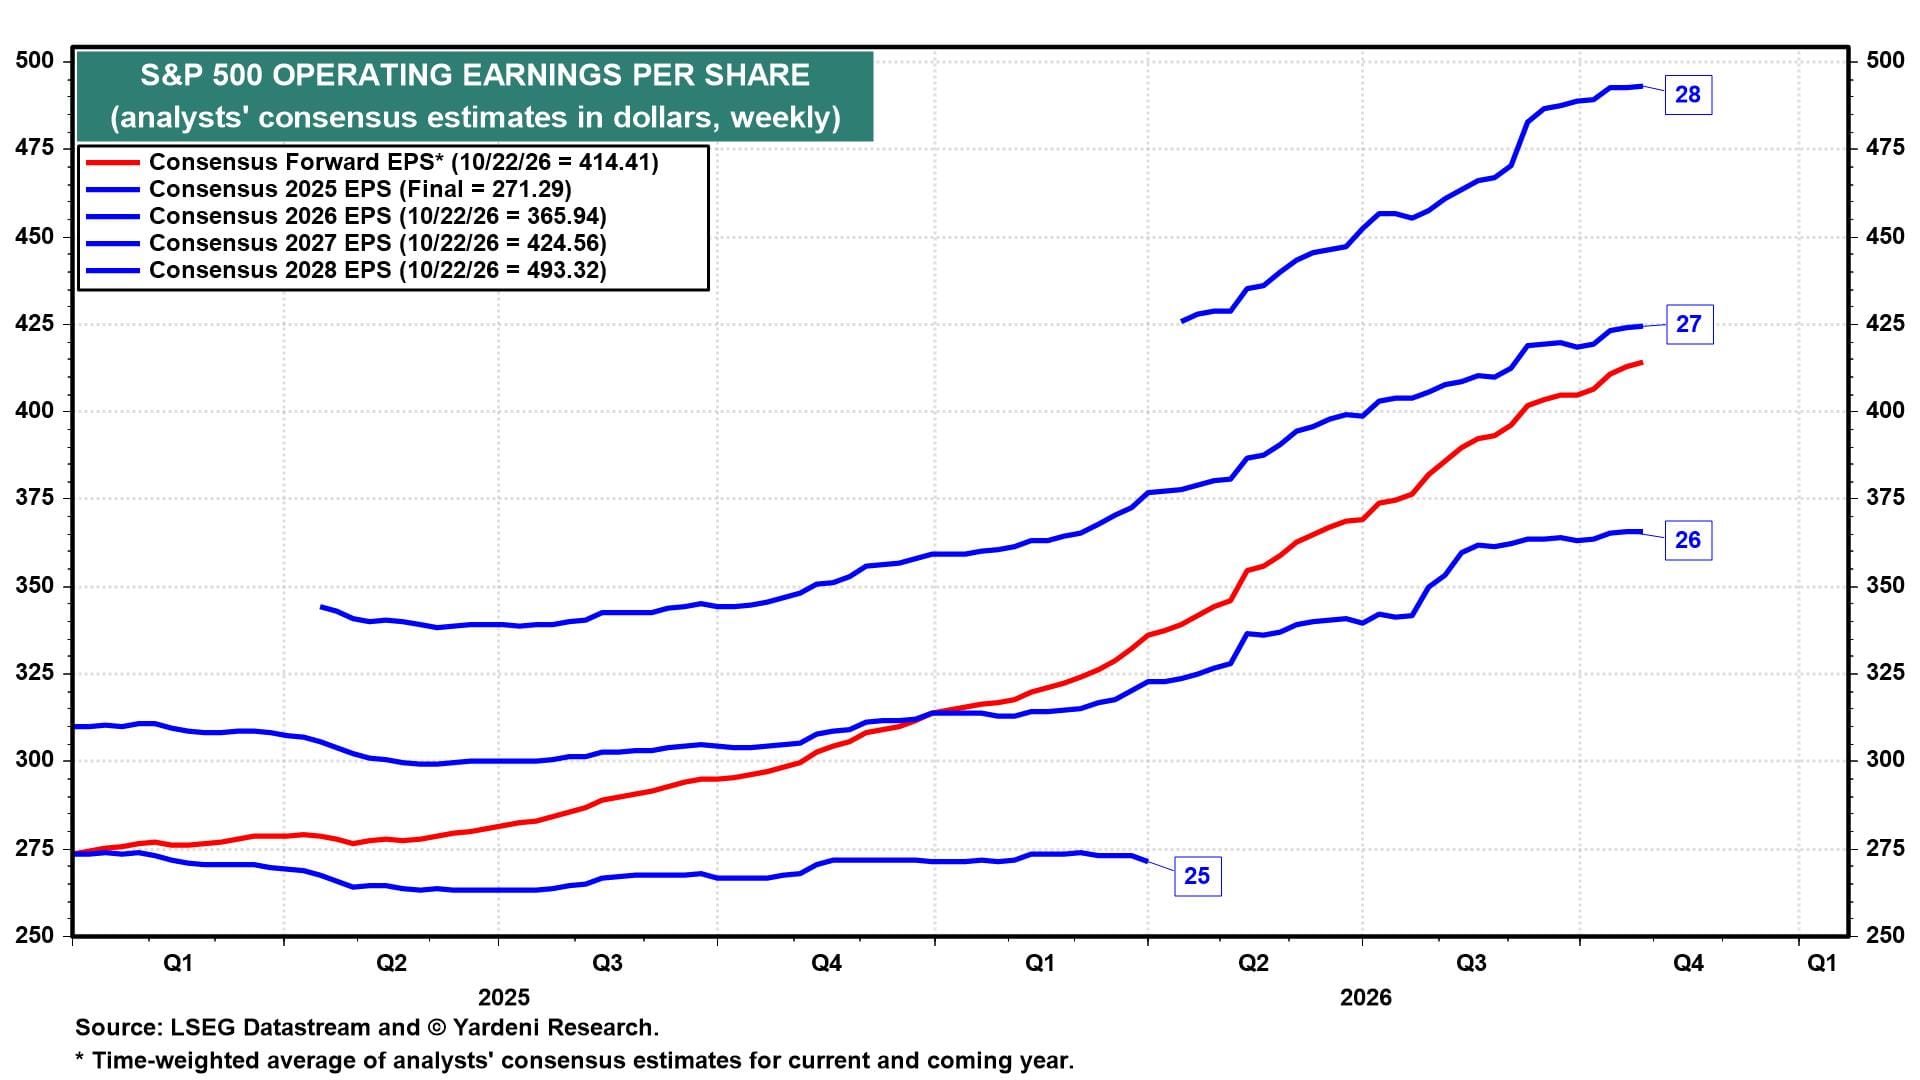
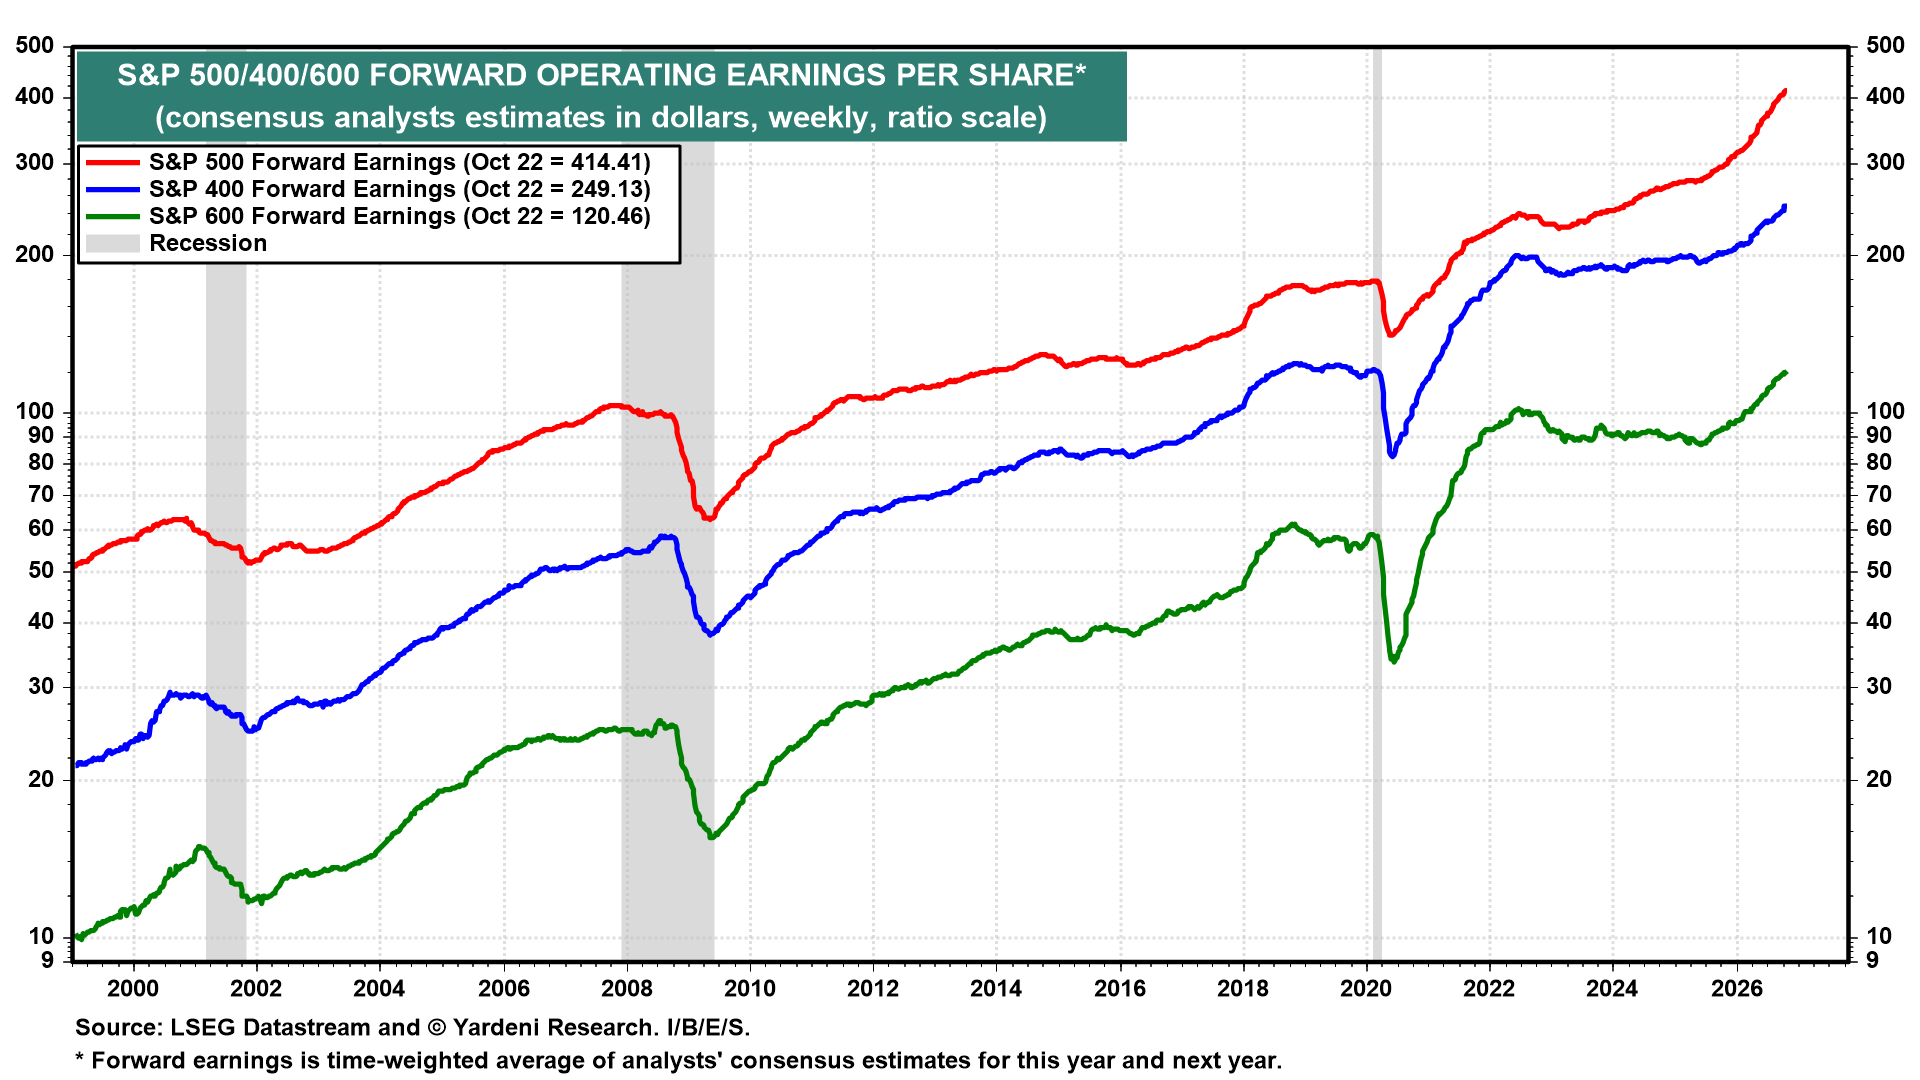
S&P 500 forward earnings per share rose to a record $414.41 during the week of October 22 (chart). It is converging on the analysts’ 2027 consensus estimate of $424.56, up from this year’s estimate of $365.94 (chart).
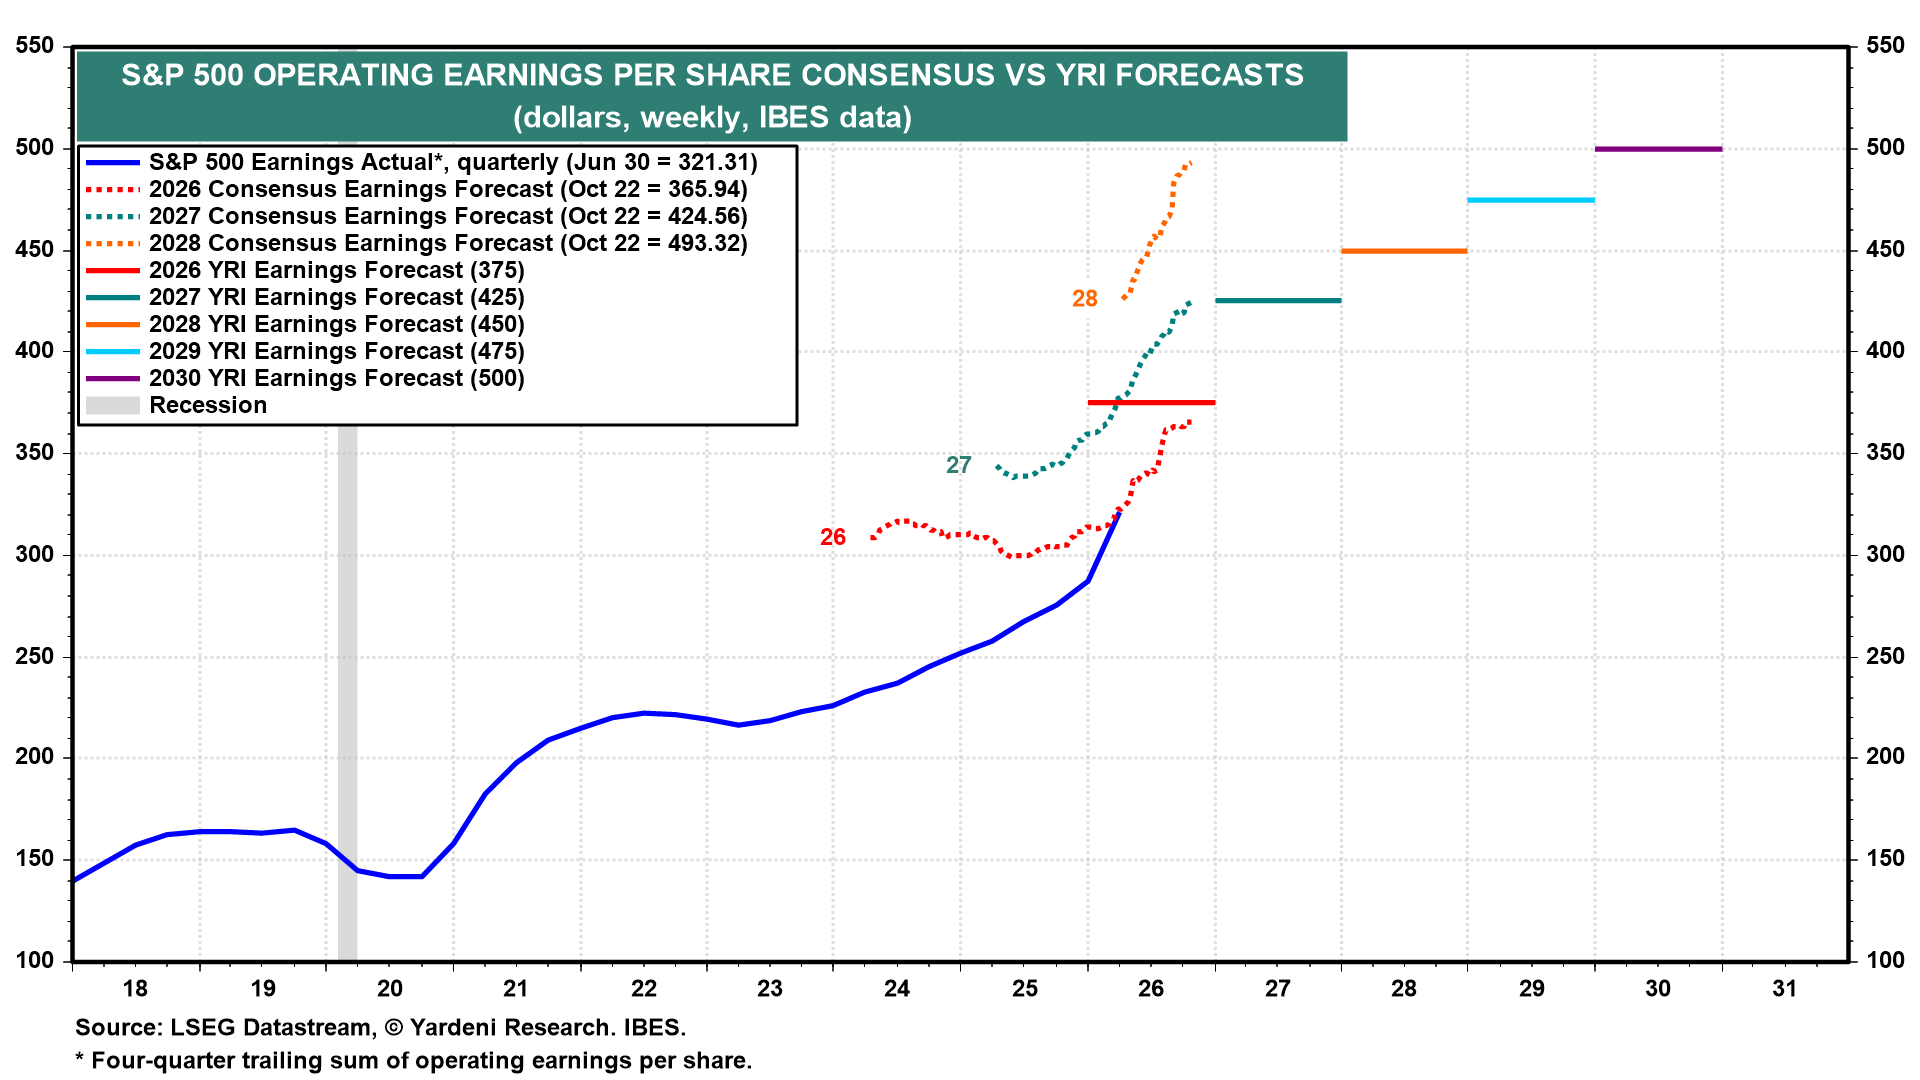
The 2026 consensus is closing in on our $375 per-share forecast (chart). The consensus for 2027 matches our $425 forecast. The 2028 consensus is already $493.32, well above our $450 forecast for that year and almost at our $500 target for 2030! If the analysts are right, the S&P 500 could rise to 10,000 by the end of next year. We are sticking with that target for the end of 2029. We think the analysts are too bullish on earnings.
Forward earnings for the S&P 400 and S&P 600 are also at record highs (chart).
III. Valuation
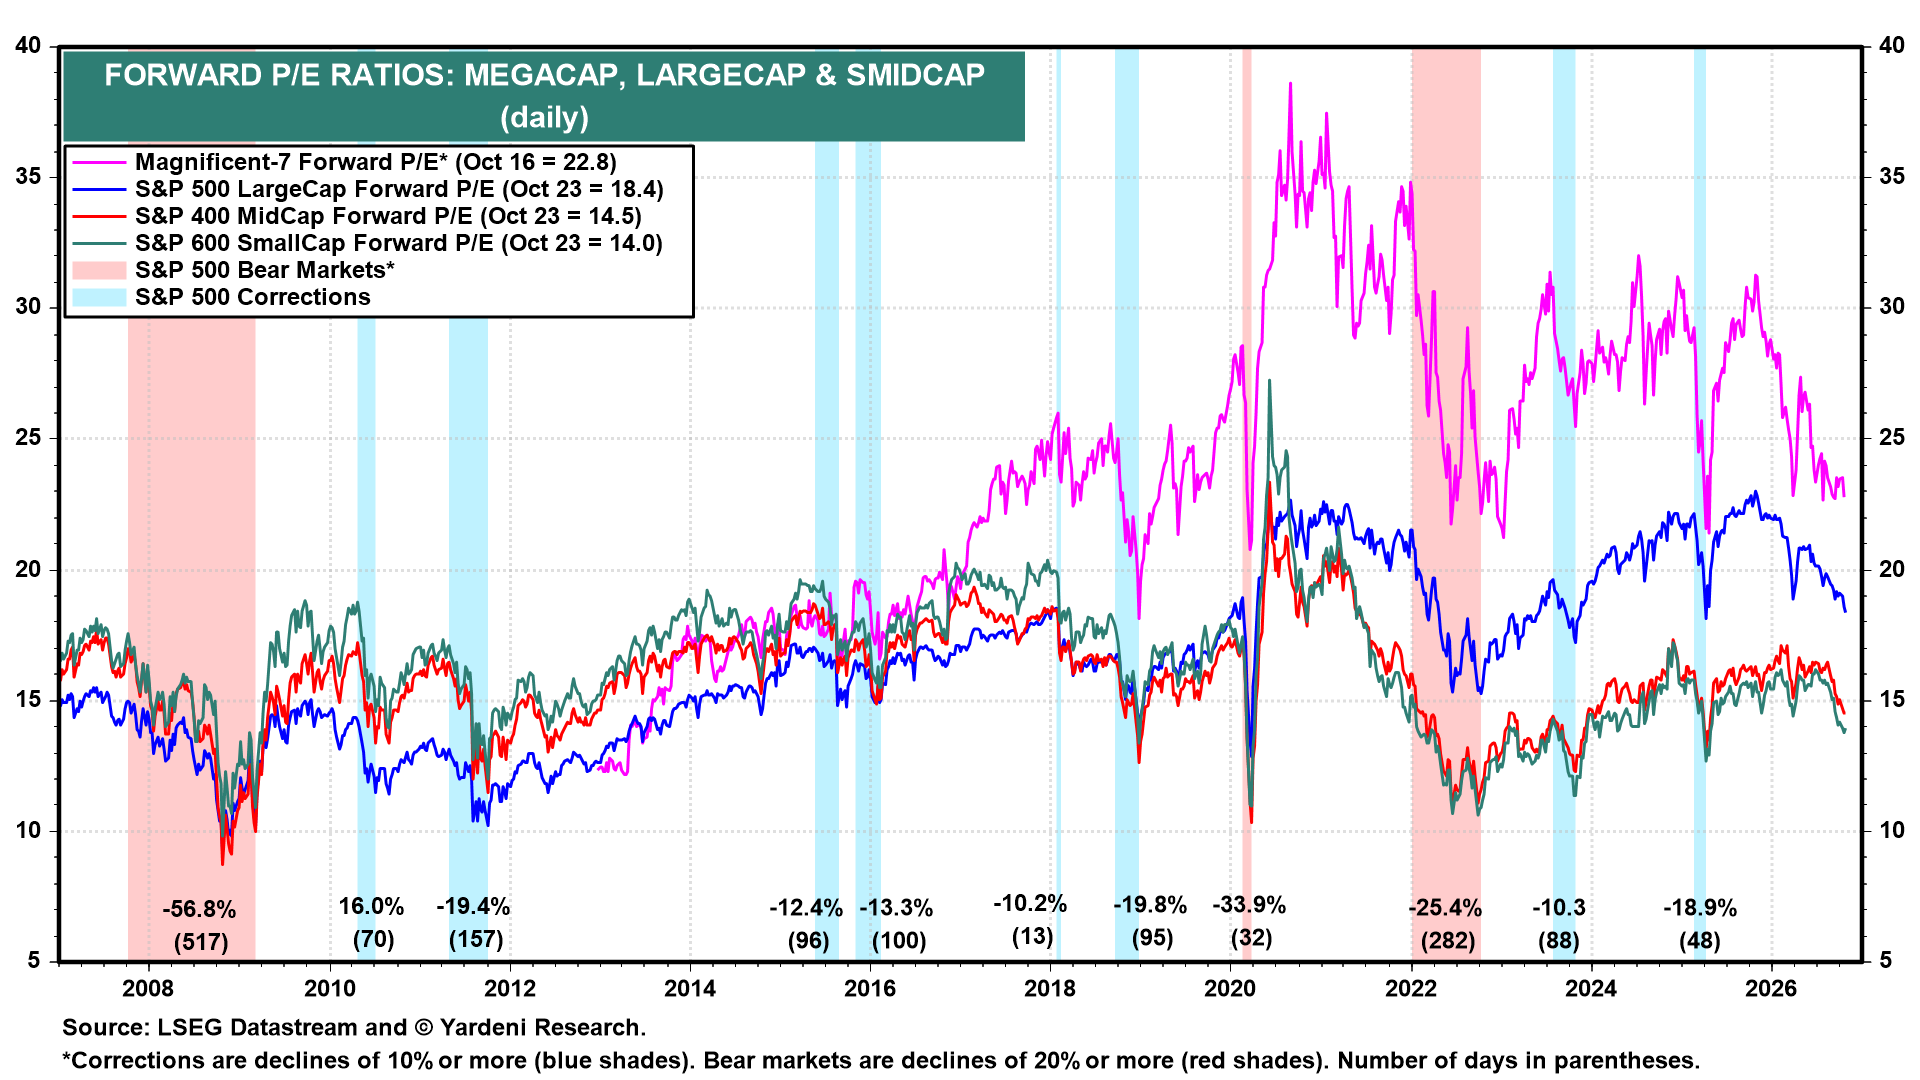
Valuation multiples continue to compress despite strong earnings (chart). The Magnificent-7’s forward P/E is 22.8, down from a 2026 peak of 28.5. The S&P 500, S&P 400, and S&P 600 trade at 18.4, 14.5 and 14.0, respectively.
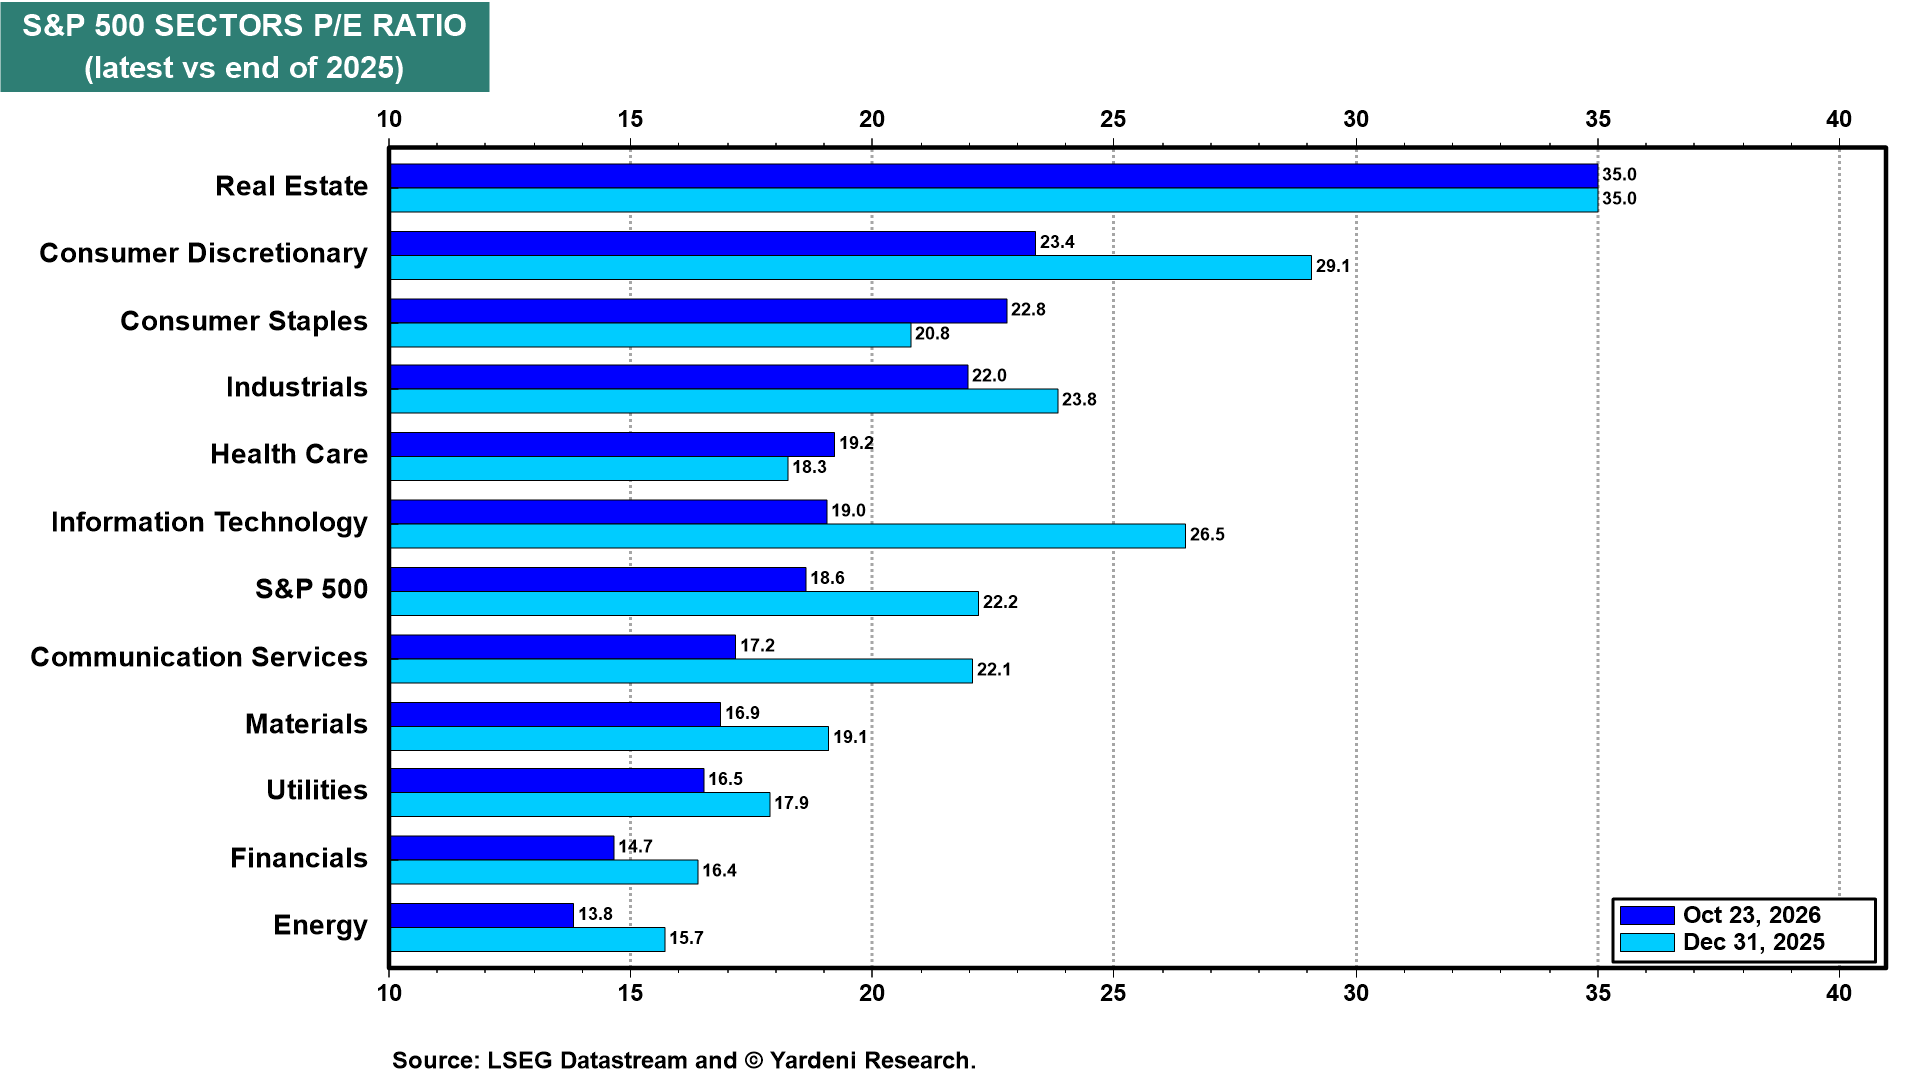
The big valuation story is that for the S&P 500 Information Technology sector. Its forward P/E dropped from 26.5 at the end of 2025 to 19.0 now (chart). The S&P 500 has fallen from 22.2 to 18.6.
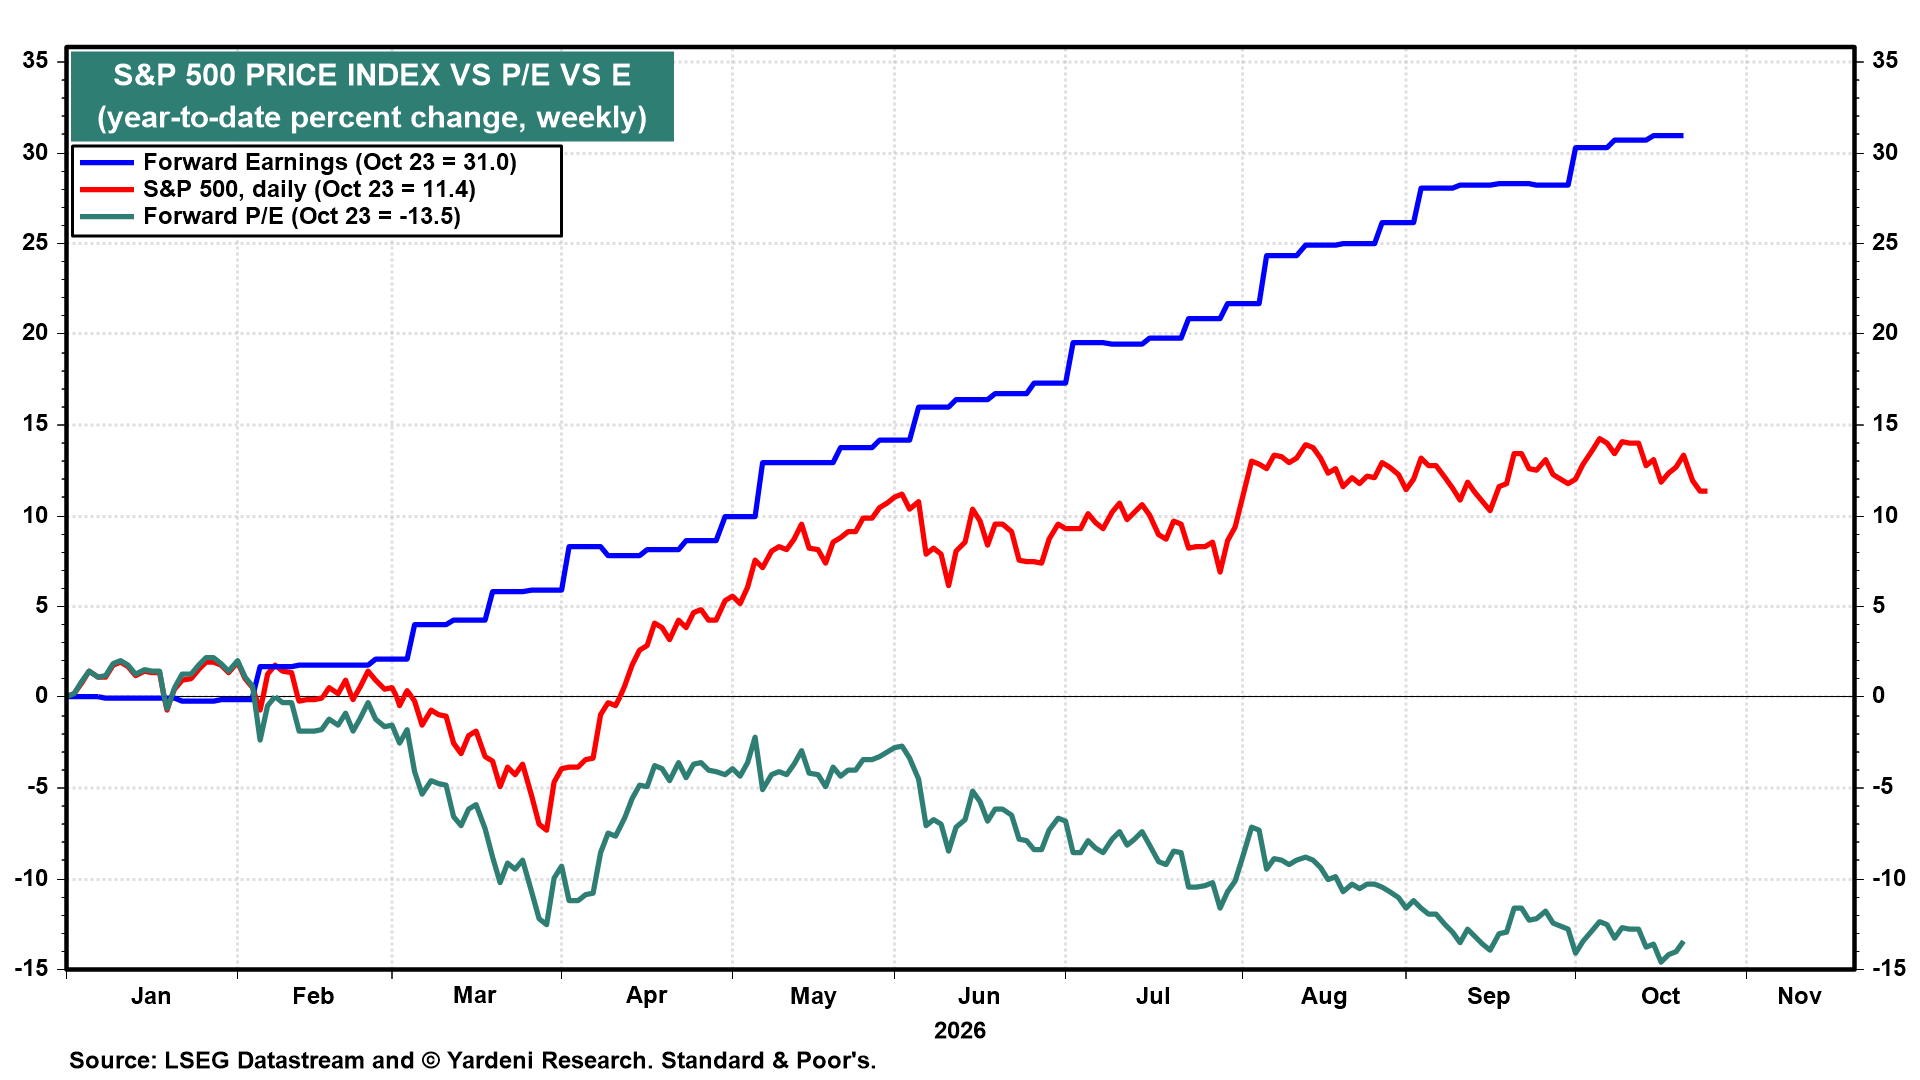
The S&P 500’s forward earnings is up 31.0% ytd (chart). The index is up 11.4%. The forward P/E is down 13.5%. Stocks have gotten significantly cheaper this year.
IV. Bonds
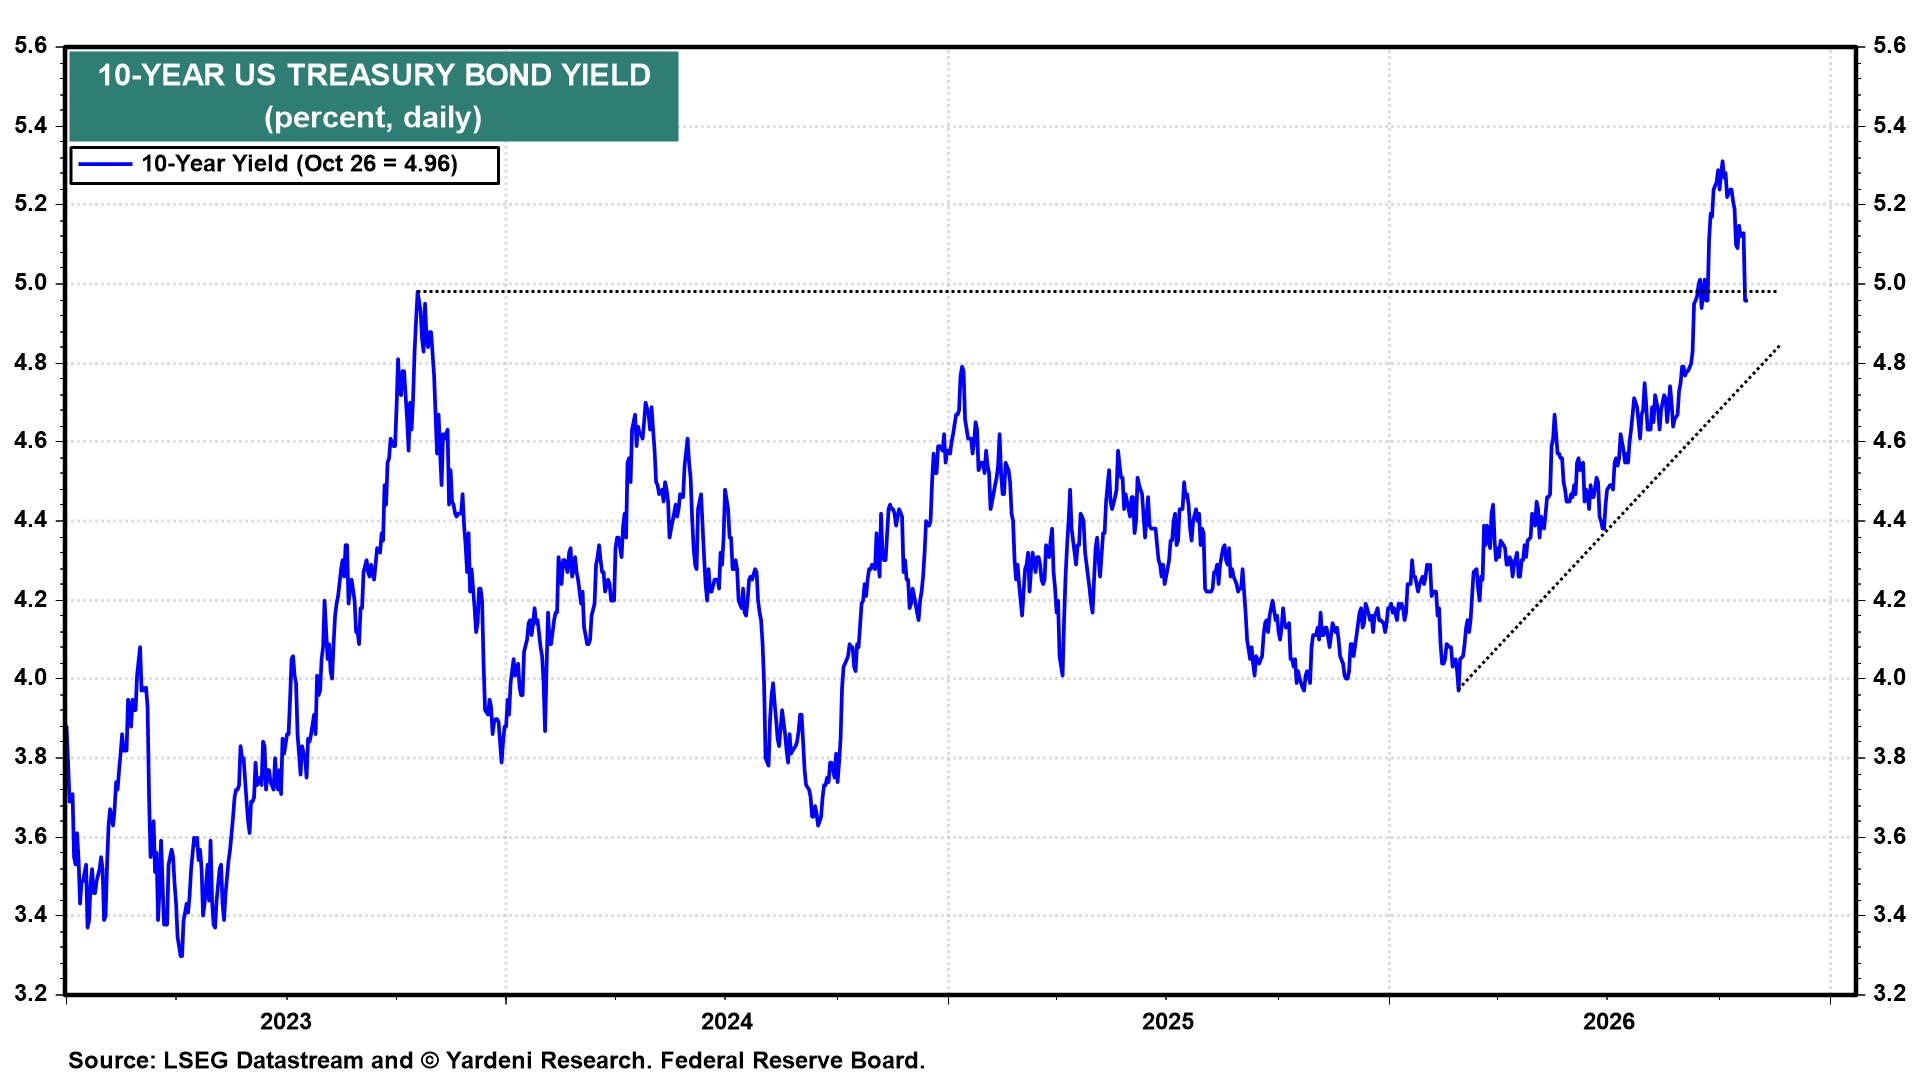
The 10-year Treasury yield is back in the “old normal” range of 4.00%-5.00% (chart). It peaked at 5.35%, attracting many buyers. It is now at 4.96%. Some of that decline reflects safe-haven buying during the recent risk-off selloff in the stock market. But market-based measures of long-term inflation expectations remain subdued. Bond investors seem to expect inflation to subside. We agree.
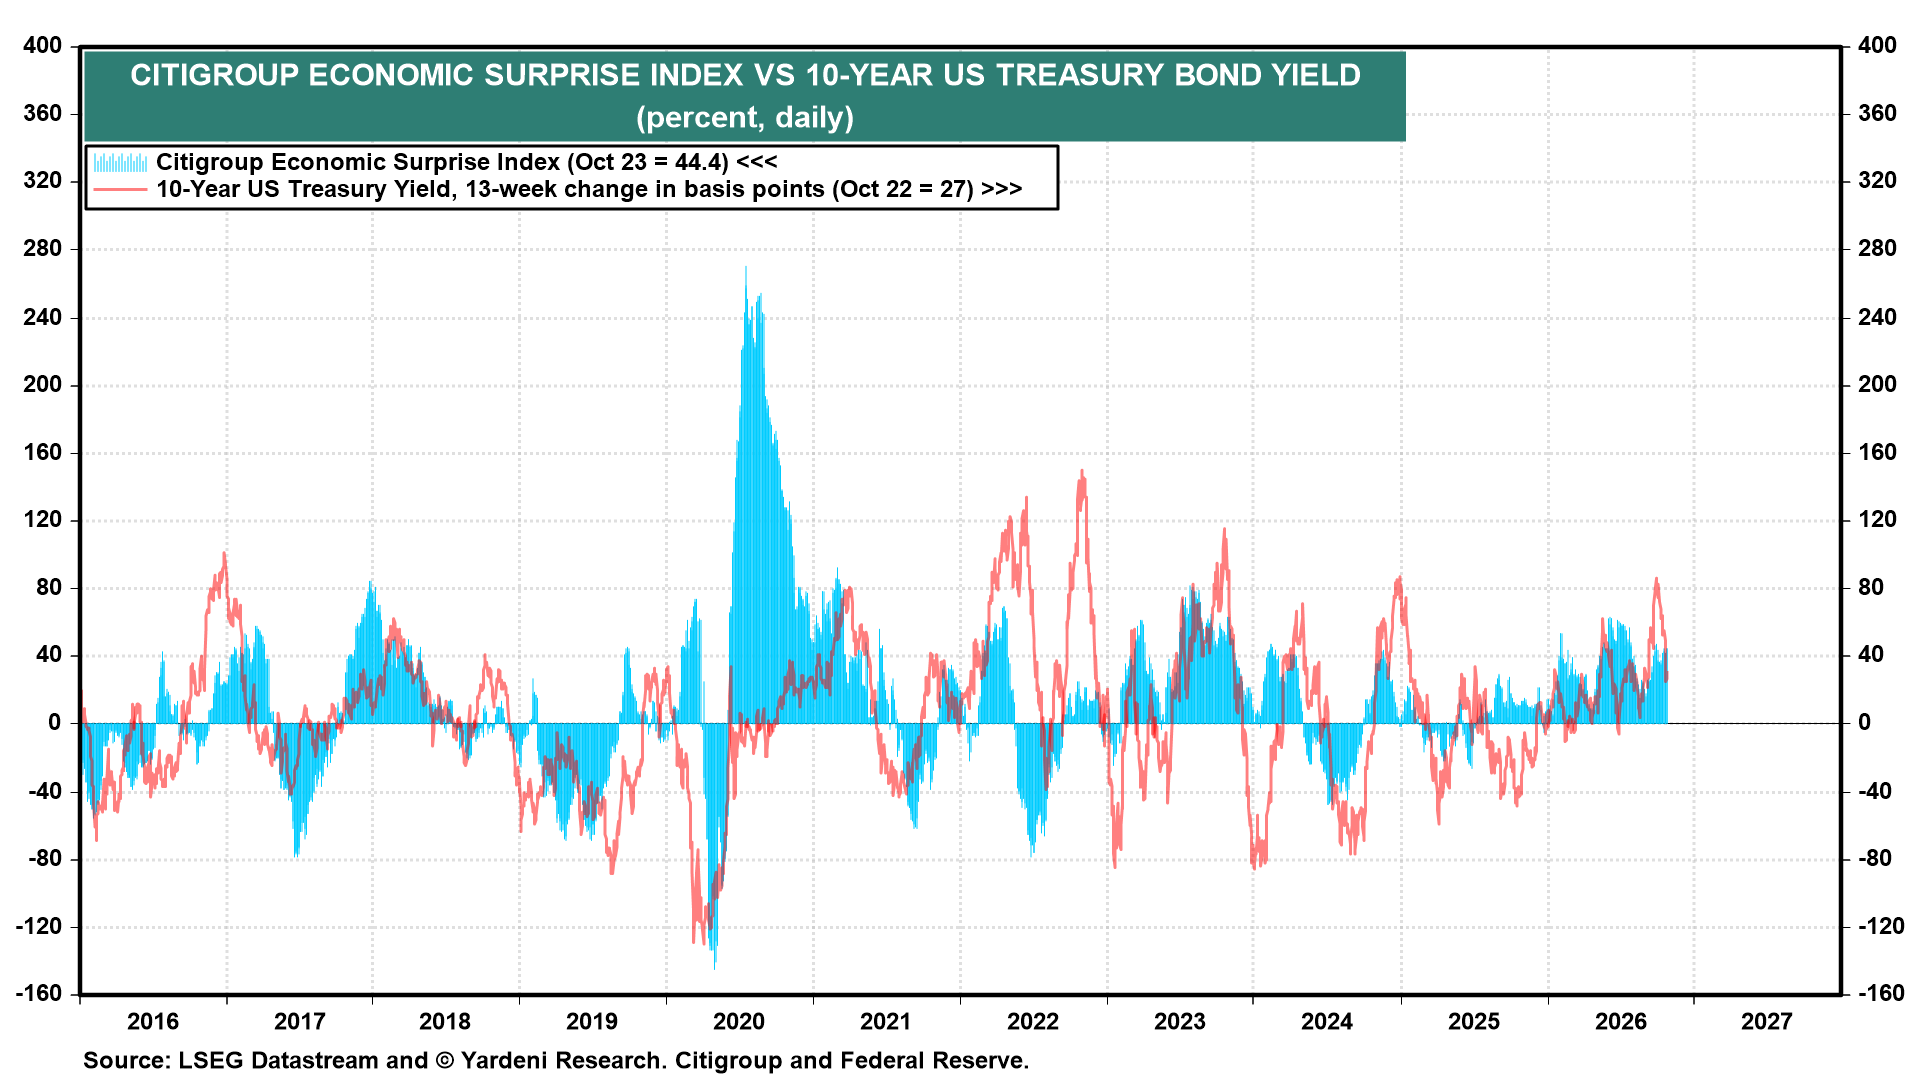
The 13-week change in the 10-year yield tends to track the Citigroup Economic Surprise Index (CESI) (chart). Recently, the yield’s change overshot the index, as it has done before. Now, the 10-year yield is up 27bps over the past 13 weeks, down from over 80bps a few weeks ago.
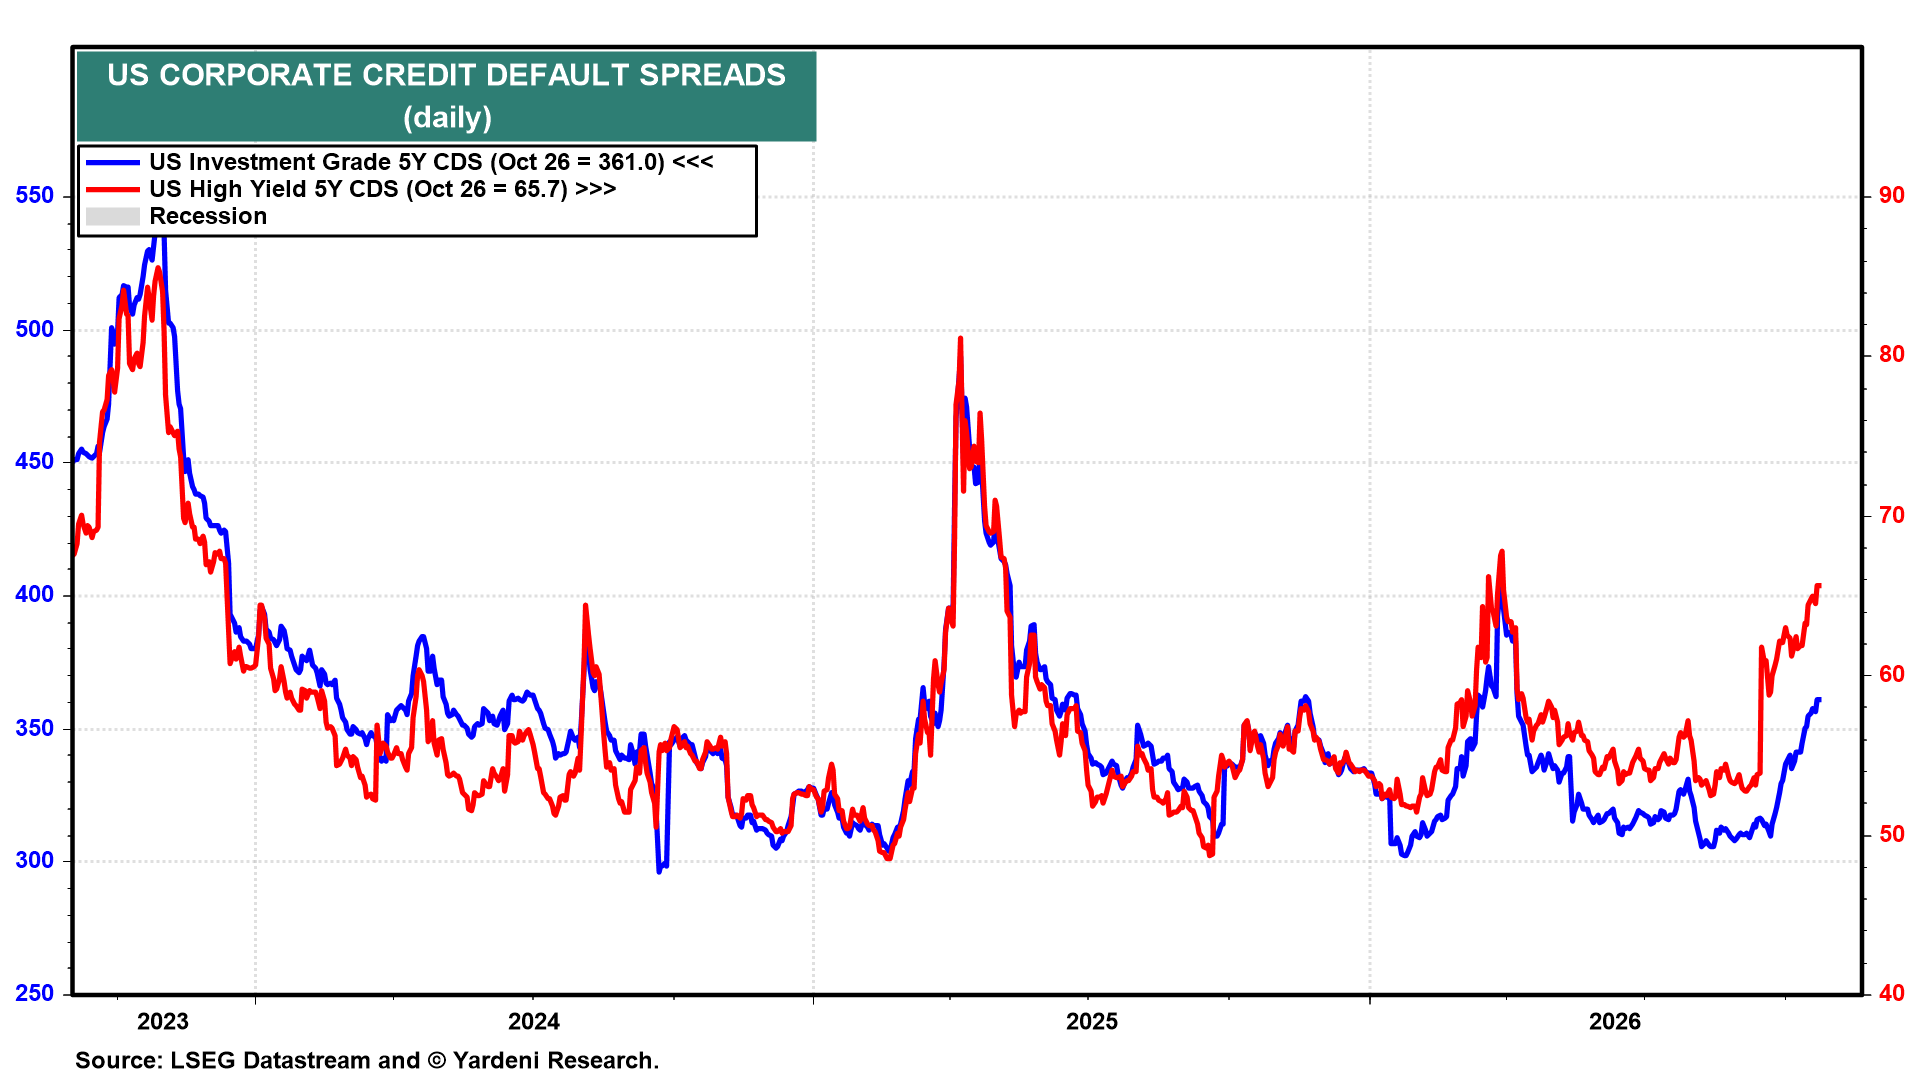
Corporate credit default swap spreads are breaking out again (chart). The widening reflects credit-quality concerns about companies like Oracle and CoreWeave. The Bond Vigilantes are regulating credit in the AI ecosystem. That’s healthy. We aren’t particularly concerned.
💡
Join the discussion with Ed below! To leave comments or questions, log in to the Yardeni QuickTakes website and post them at the end of the QuickTakes article. Paid members’ contributions may be featured in our segment, “Ed Answers Your Questions”.