US Dollar in Tailspin, Price Action Setups on EUR/USD, GBP/USD and AUD/USD


US DOLLAR FORECAST – EUR/USD, GBP/USD, AUD/USD

  • The U.S. dollar extends losses, sinking to its weakest point since early August
  • Meanwhile, EUR/USD, GBP/USD and AUD/USD break out to the topside, clearing key price levels in the process
  • This article focuses on the technical outlook for top forex pairs

Trade Smarter – Sign up for the DailyFX Newsletter

Receive timely and compelling market commentary from the DailyFX team

Subscribe to Newsletter

Most Read: US Dollar Outlook – PCE, Powell to Set Market Tone, Setups on EUR/USD, USD/JPY

The U.S. dollar, as measured by the DXY index, retreated for a fourth straight trading session on Tuesday, settling below the 103.00 threshold and hitting its lowest level since early August, pressured by a pullback in U.S. Treasury yields.

In recent days, U.S. interest rate expectations have shifted in a more dovish direction on bets that the FOMC has finished hiking borrowing costs and will move to ease its stance next year. This sentiment gained momentum today after Federal Reserve Governor Christopher Waller, typically a hawkish voice, stated that he is “increasingly confident” that monetary policy is in the right place and that, if inflation continues to slow, rate cuts could be considered.

Against this backdrop, the euro, British pound, and Australian dollar posted solid gains against the greenback, with their exchange rates breaching key levels in the process. In this article, we analyze the technical outlook for EUR/USD, GBP/USD, and AUD/USD, taking into account market sentiment, price action dynamics and chart formations.

Unsure about the U.S. dollar’s trend? Gain clarity with our Q4 forecast. Request your complimentary guide today!

Recommended by Diego Colman

Get Your Free USD Forecast

EUR/USD TECHNICAL ANALYSIS

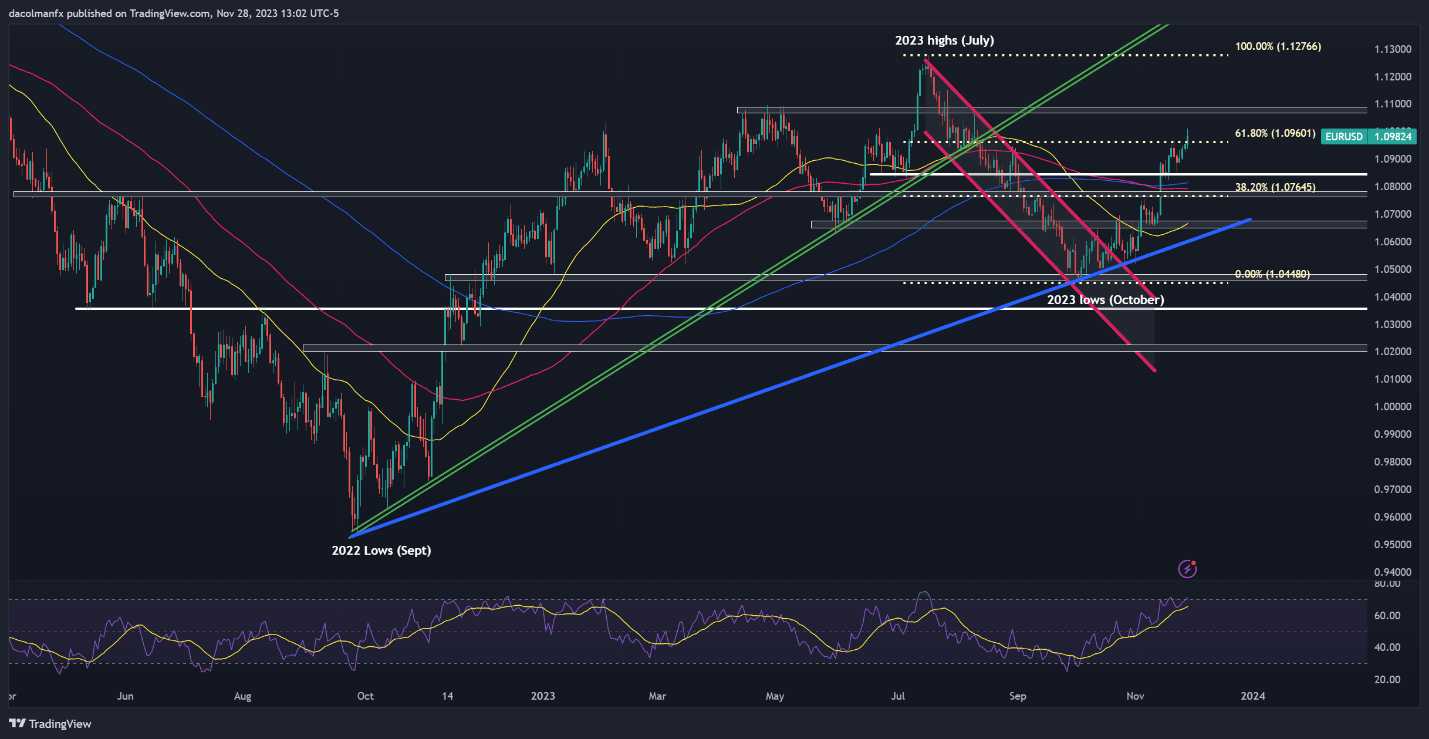
EUR/USD extended its advance on Tuesday, clearing Fibonacci resistance at 1.0960 and rising to its best mark in more than three months. If the pair holds onto recent gains and establishes a support base near 1.0960, there’s a possibility of an upward push towards 1.1080 following a period of consolidation. Should bullish momentum persist, attention could turn to the 2023 highs near 1.1275.

In case of a downward shift from current levels, it is imperative to closely monitor price action around 1.0960, bearing in mind that a breach of this technical zone could send the exchange rate towards 1.0840. On further weakness, we could witness a retreat towards the 200-day simple moving average, located slightly above confluence support near 1.0760.

For a comprehensive assessment of the euro’s medium-term technical and fundamental outlook, request a free copy of our latest forecast!

Recommended by Diego Colman

Get Your Free EUR Forecast

EUR/USD TECHNICAL CHART

EUR/USD Chart Created Using TradingView

Interested in understanding how retail positioning may shape GBP/USD’s trajectory? Our sentiment guide examines crowd psychology in FX markets. Download your free guide now!


of clients are net long.


of clients are net short.

Change in Longs Shorts OI
Daily -14% 3% -4%
Weekly -21% 15% -3%

GBP/USD TECHNICAL ANALYSIS

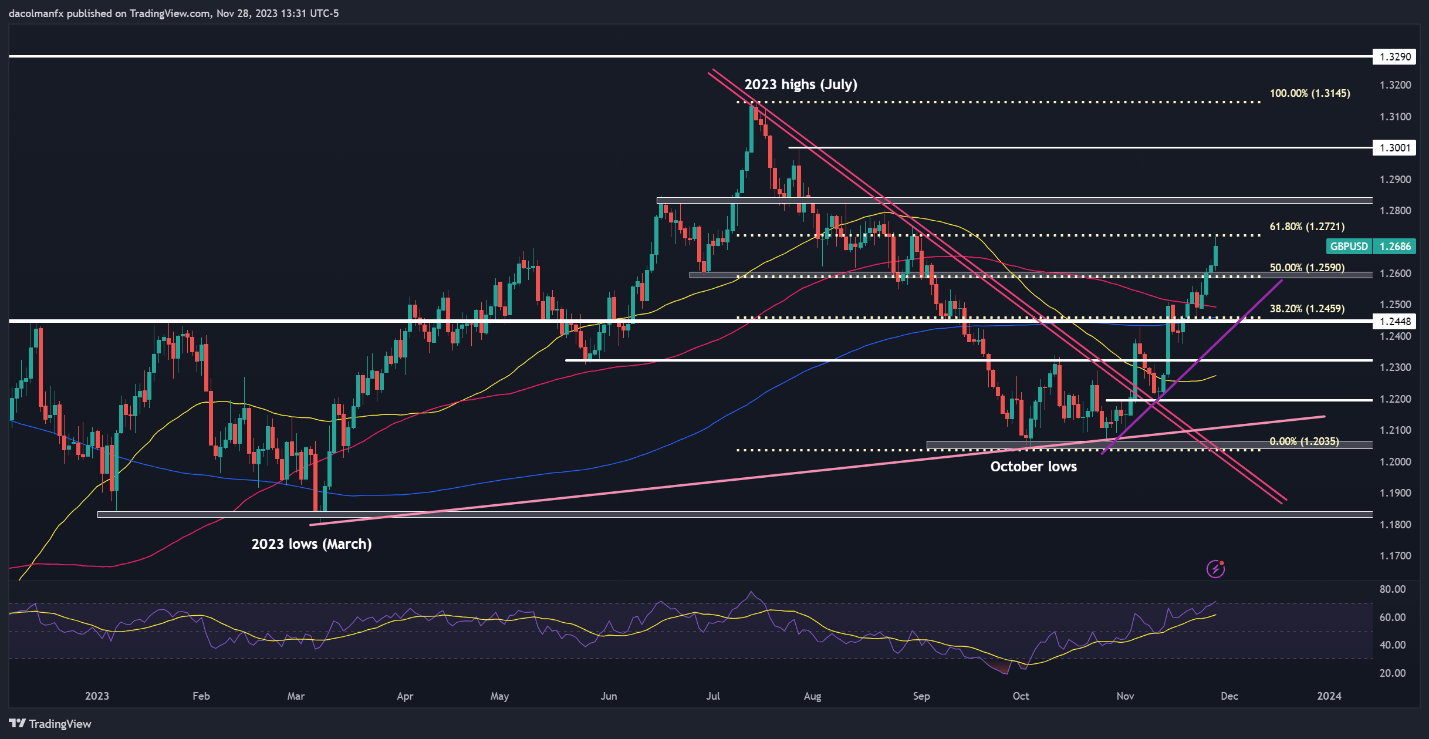
GBP/USD has been on a bullish tear in November, rising nearly 4.5% since the beginning of the month. After Tuesday’s gains, the pair has reached its best level since late August, but has been unable to reclaim the 61.8% Fibonacci retracement of the July/October slump (1.2720). If this ceiling holds, the upside momentum could run out of steam, paving the way for a drop towards 1.2590, followed by 1.2460.

In the event of a clear break above 1.2720, sentiment on sterling is likely to improve, unleashing animal spirits that could propel a potential upward move towards 1.2850. On further strength, buying interest could accelerate, opening the door to a climb toward the 1.3000 handle. Although the bullish case for GBP/USD is strong, it is important to exercise caution as the pair is about to enter overbought territory.

GBP/USD TECHNICAL CHART
A screenshot of a computer screen  Description automatically generated

GBP/USD Chart Created Using TradingView

Curious about what’s on the horizon for the Australian dollar? Get all the answers in our quarterly forecast!

Recommended by Diego Colman

Get Your Free AUD Forecast

AUD/USD TECHNICAL ANALYSIS

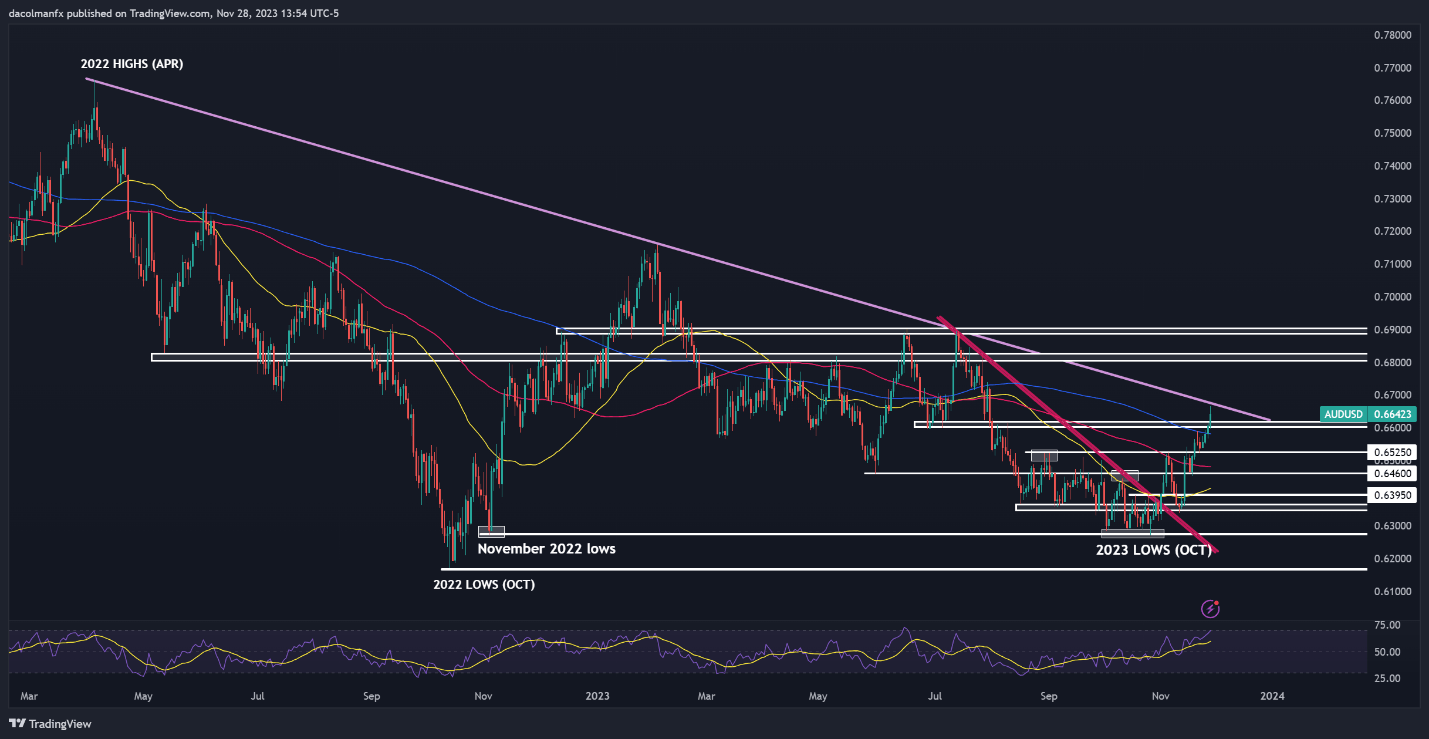
AUD/USD jumped on Tuesday, breaching a key technical ceiling in the 0.6600-06620 band and reaching its strongest level in nearly four months. The bulls have been burned on several occasions by fakeouts in the pair, so caution is warranted after the latest rally, but if this week’s breakout holds, attention might pivot toward trendline resistance at 0.6675. Higher, the focus will be on 0.6800.

Conversely, if profit-taking among bullish traders leads to a price reversal, support appears in the 0.6620/0.6600 area. If this floor caves in, we could see a retracement towards the 200-day simple moving average, potentially followed by a retest of the 0.6525 region. Vigorous defense of this support zone is crucial for the bulls, as a breakdown could trigger a pullback towards 0.6460.

AUD/USD TECHNICAL CHART
A graph of stock market  Description automatically generated

AUD/USD Chart Created Using TradingView


Source link

Visited 1 times, 1 visit(s) today

Related Article

3 Reasons to Sell JACK and 1 Stock to Buy Instead

3 Reasons to Sell JACK and 1 Stock to Buy Instead Since April 2026, Jack in the Box has been in a holding pattern, posting a small loss of 4.4% while floating around $12.15. The stock also fell short of the S&P 500’s 8.9% gain during that period. Is there a buying opportunity in Jack

Sports Team Value Gains Lag Stock Market Since 2022

The cost of buying a sports team has soared in recent years, including record price tags in 2026 for the Los Angeles Lakers ($12.5 billion), Seattle Seahawks ($9.34 billion) and Los Angeles Angels ($4 billion). It has spurred talk of a sports valuation bubble. Yes, sports team values are up huge, but they trail stock

Anthropic to publicly file for IPO as early as Friday, sources say

Anthropic (ANTH.PVT) is set to publicly file its S-1 investor prospectus as soon as Friday, according to three people familiar with the artificial intelligence firm’s plans. The move would mark a crucial next step for what could be the biggest IPO in history. The much-anticipated public debut, expected to surpass SpaceX’s (SPCX) June IPO, is

​Europe stands by Ukraine – but how long can that last? | World news

​Europe stands by Ukraine – but how long can that last? | World news

Europe woke up last Friday to another belligerent outburst from Donald Trump – this time berating Ukraine’s wartime leader Volodymyr Zelenskyy again. Just a few days after his diesel deal with the Kremlin, the US president said Zelenskyy was more difficult to deal with than Vladimir Putin and blamed Ukraine’s leader for rocketing oil prices

Prediction: $150 a Month Invested in Micron Stock Will Be Worth This Much by Year-End 2030

Over the last year, memory chip manufacturers have benefited from extraordinary demand for artificial intelligence (AI). In particular, Micron Technology (NASDAQ: MU) has witnessed its market capitalization propel from just $53 billion at the start of the AI revolution to more than $1 trillion today. MU Market Cap data by YCharts Missed Nvidia in 2009?

Micron Tripled in 2026. Can It Repeat in 2027?

Micron (NASDAQ: MU) stock has more than tripled so far in 2026, making it the fourth-best-performing stock in the S&P 500 (SNPINDEX: ^GSPC) this year. That’s an impressive run, but for investors, the past really doesn’t matter; only the future. So, could Micron repeat this feat in 2027? One metric suggests that the answer to

Penang among world’s top 25 places to visit in 2027

Penang has earned further international recognition in tourism after being named one of the world’s 25 best places to visit in 2027 by National Geographic, highlighting the state’s rich heritage, cultural diversity and renowned food scene. The recognition places Penang on the prestigious list of destinations recommended by the internationally acclaimed publication, making it the

GM Just Beat Earnings Estimates. Is Ford Still the Better Dividend Stock?

Quick Read Ford (F) yields nearly 5% versus GM’s (GM) sub-1%, making Ford the clear winner for investors who need cash income today. GM’s dividend is covered 18 times by free cash flow versus Ford’s 2.6 times, making GM’s payout far safer for long-term holders. GM’s stock gained 187% over ten years versus Ford’s 62%,

HKSAR govt issues travel alert for France

People walk past a looted store after violence erupted during nationwide protests against rising living costs and poor conditions in schools in Paris, Oct 19, 2026. (PHOTO/AP) HONG KONG – The Hong Kong Special Administrative Region government on Tuesday issued an amber outbound travel alert (OTA) for France. The move was made in view of

Trumpflation Is Evolving, and There’s a New Twist That Threatens to Sink Stocks

For the better part of the last four years, the stock market has been unstoppable. The artificial intelligence (AI) infrastructure build-out has helped propel the Dow Jones Industrial Average (DJINDICES:^DJI), S&P 500 (SNPINDEX:^GSPC), and Nasdaq Composite (NASDAQINDEX:^IXIC) to several record highs this year. But these gains may prove fleeting, courtesy of Trumpflation — inflation specifically

Data compiled from the International Monetary Fund’s (IMF) World Economic Outlook 2026 and World Trade Organization (WTO) trade statistics tracks economic performance around leadership changes in five countries.

Regime change doesn’t translate into economic recovery: Data

Regime change doesn’t translate into economic recovery or chart a country’s growth path, recent data from South Asia shows. Economic indicators in some South Asian countries have shown signs of gradual improvement following major political upheavals, but they have yet to fully recover, with persistent challenges regarding GDP growth, inflation and trade. Data compiled from

Hong Kong schools weigh pulling out of Paris iGEM event amid unrest in France

Several Hong Kong schools are considering withdrawing from next month’s iGEM competition in Paris amid concerns over unrest in France, as the Education Bureau stressed that student safety should remain the top priority for overseas study activities. More than 30 secondary schools and universities, involving nearly 600 students and teachers, had been scheduled to travel

Old Republic International Earnings: What To Look For From ORI

Old Republic International Earnings: What To Look For From ORI Insurance conglomerate Old Republic International (NYSE:ORI) will be reporting earnings this Thursday before market open. Here’s what investors should know. Old Republic International missed analysts’ revenue expectations last quarter, reporting revenues of $2.33 billion, up 5.2% year on year. It was a softer quarter for

Cathie Wood’s Ark Invest Grew Its Portfolio to $15.4 Billion Last Quarter, With Tesla, AMD, and a New SpaceX Stake Making Up About 18% of ARKK Assets. Is Her Concentrated Bet Paying Off?

Cathie Wood is one of America’s most-watched tech investors, known for her extreme bullishness on Bitcoin and disruptive future technologies like robotics and artificial intelligence (AI). According to her company’s most recent 13F SEC filing, as of the second quarter, Cathie Wood’s Ark Invest portfolio had a total of $15.4 billion of assets under management.

0
Would love your thoughts, please comment.x
()
x