The S&P 500 Fell in Both September and October for Only the 17th Time Since 1950. Here’s What Usually Followed.
The S&P 500 (SNPINDEX:^GSPC) closed September at 7,651.54 and October at 7,580.07. That’s two monthly losses in a row, of around 0.5% and 0.9%, and the first time since 2023 that the index has dipped in both months.
October’s loss came late. Heading into its last session, the index was up around 0.9% for the month, and a fall of about 1.8% on Oct. 30 sent it under September’s close. Yet the S&P 500 has risen around 11% this year and finished October within about 3% of the record it set on Oct. 6.
Missed Nvidia in 2009? This Rare Signal Is Flashing Again. In 2009, a “Double Down” signal flashed for a little-known chipmaker called Nvidia. For the first time in years, that same “Total Conviction” signal is flashing for a company 1/100th the size of Nvidia. Continue »
I wanted to see what has usually come next. With month-end closes (price only, no dividends), I found 16 past years since 1950 when the index dropped in both months. That comes to around one year in five.
Image source: Getty Images.
The 16 cases
Most of these years finished well. The index rose over November and December in 12 of the 16, and the median two-month gain was around 3.7%. The four that didn’t were 1957, 1987, 2000, and 2008.
The next 12 months looked even better. A year after the end of October, the S&P 500 was higher in 14 of the 16, and the typical gain was around 13%. Of course, two of these gains hardly counted, at about 0.1% after 1952 and 0.9% after 1977.
The two losses were in 1989 and 2000.
In 1989, the index had already climbed around 23% for the year through October. The next 12 months ran into a recession that started in August 1990, according to the National Bureau of Economic Research, and the S&P 500 finished that stretch down about 11%. In 2000, the index had peaked back in March, early in the dot-com bust, and it dropped around 26% over the next year.
Two down months didn’t shift the odds much
This record looks a lot like a normal year’s.
From 1950 through 2025, the index gained over November and December in 59 of 76 years, or around 78% of the time, and the typical rise was about 3.6%. After a down September and October, the rate was 75%, with a typical rise of around 3.7%. So two losing months haven’t said much about how the year finishes.
The 12-month results look a bit more favorable — 14 of 16, versus 60 of the 75 years from 1950 through 2024. But with just 16 cases, a gap that small could easily come down to luck.
And the starting year matters. Yahoo Finance’s data for the index goes back to the end of 1927, and the years before 1950 have eight more September-October drops, mostly in the Great Depression.
Those did worse. The index gained over November and December in only three of the eight, and it was higher a year later in just four. I left them out because a market recovering from the 1929 crash arguably has little in common with today’s.
Which years look most like 2026?
By size, this year’s dip was one of the smallest. Combined, September and October knocked around 1.4% off the index, the second-smallest two-month loss of the 17 cases, behind 1984’s 0.4%.
The other years with two-month losses of around 3% or less didn’t agree on much. The index climbed about 7% over the year after October 1951, 14% after 1984, and 21% after 2016. But it was flat after 1952 and lost about 11% after 1989.
Most of the big rebounds followed deeper fall declines. In 1990, 2020, and 2023, the index lost about 6% to 7% over September and October, then rose 29% to 41% over the next 12 months.
Just two of the 16 earlier years had a record close during September or October, like 2026 did: 1989 (on Oct. 9) and 2020 (on Sept. 2). The year after October 2020 saw the group’s largest gain, but 1989 led to one of its two losses.
The index’s valuation is another matter. Its cyclically adjusted price-to-earnings ratio, a measure that sets the price against a decade of inflation-adjusted profits, began October at around 41. Of the 16 earlier years, just 2000 got close, at about 39. In 1984 and 2016, it was around 10 and 27.
Overall, what usually followed was a gain, at about the same rate as in any other year. I think the two-month dip says little by itself, in either direction.
For buy-and-hold investors adding to an index fund like the Vanguard S&P 500 ETF on a regular schedule, I don’t see a reason in this history to stop or speed up. I’d just keep my expectations modest, given where the valuation stands.
Should you buy stock in S&P 500 Index right now?
Before you buy stock in S&P 500 Index, consider this:
The Motley Fool Stock Advisor analyst team just identified what they believe are the 10 best stocks for investors to buy now… and S&P 500 Index wasn’t one of them. The 10 stocks that made the cut could produce monster returns in the coming years.
Consider when Netflix made this list on December 17, 2004… if you invested $1,000 at the time of our recommendation, you’d have $336,195!* Or when Nvidia made this list on April 15, 2005… if you invested $1,000 at the time of our recommendation, you’d have $1,241,567!*
Now, it’s worth noting Stock Advisor’s total average return is 875% — a market-crushing outperformance compared to 208% for the S&P 500. Don’t miss the latest top 10 list, available with Stock Advisor, and join an investing community built by individual investors for individual investors.
Daniel Sparks and his clients do not have positions in any of the stocks mentioned. The Motley Fool has positions in and recommends Vanguard S&P 500 ETF. The Motley Fool has a disclosure policy.
Qualcomm (NASDAQ:QCOM) shares slid 11% on Oct. 30 to close at $164.79. The company didn’t release any news of its own that day. Instead, it was caught in a broad chip sell-off after Intel forecast less revenue in the fourth quarter than in the third and warned the PC slowdown might last until at least
Pinnacle West Capital Corporation Q3 2026 Earnings Call Summary – Moby Strategic Drivers of Record Growth and Operational Performance Our analysts just identified a stock with the potential to be the next Nvidia. Tell us how you invest and we’ll show you why it’s our #1 pick. Tap here. Record-breaking summer demand was met through
Mott Capital Management, an investment research and management firm, released its “Thematic Growth Strategy” Q3 2026 investor letter. A copy of the letter can be downloaded here. The strategy generated a 9.01% YTD return through Q3 2026, trailing the S&P 500 Total Return Index’s 12.75%. Sector rotation and weakness in technology shares shaped the market
The Federal Reserve recently raised interest rates for the first time in years, and more rate hikes are expected. Another hike may even happen before the end of the year. How much higher rates end up going is anyone’s guess at this point, as inflation remains elevated and the war in Iran doesn’t appear to
Stock Market Outlook Key Takeaways The US stock market is trading at a 10% discount to a composite of our valuations AI enthusiasm is evolving into AI accountability Maintain a barbell-shaped portfolio: Overweight value and growth, underweight core Based on a composite of our intrinsic valuations of the stocks we cover included in the Morningstar
Greenlight Capital, an investment management firm, recently released its Q3 2026 investor letter. A copy of the letter can be downloaded here. The funds returned -3.3% in the third quarter of 2026, compared with a 2.3% gain for the S&P 500, bringing their year-to-date return to -1.5% against the index’s 12.7% advance. The disappointing performance
Warren Buffett has left a legacy as one of the greatest investors of his generation. He’s also one of the best-known investors, and there are reams of shareholder meeting transcripts and letters available for review from Buffett with smart, sound investing advice for anyone from the professional to the layman. Berkshire Hathaway (NYSE: BRKA) (NYSE:
Sandisk (NASDAQ: SNDK) stock lost 24% in October, according to data provided by S&P Global Market Intelligence. Although it reported another quarter of fantastic growth, the market is worried about a slowdown in the memory cycle. Memory is dominating right now Sandisk makes many of the products important for all kinds of technology, and it’s
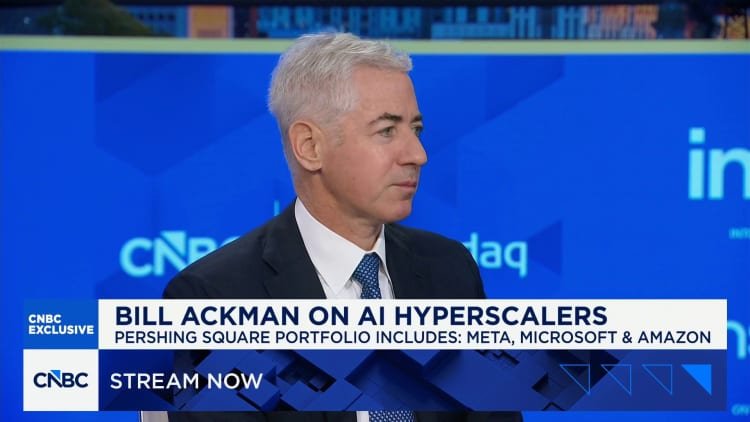
Pershing Square CEO Bill Ackman speaks on CNBC’s “Squawk Box,” Nov. 3, 2026. CNBC Bill Ackman worries that the stock market is broken, saying the rise of speculative trading is leading to wild price swings thanks to the amount of leverage in the system. “Every number of days, I feel like markets are broken,” Ackman
Enter Boeing (NYSE: BA) stock in a beauty contest, and it wouldn’t get many votes. But long-term investing isn’t a beauty pageant; it’s about finding good value stocks with plenty of upside potential. Boeing is a winner in that regard, even though its recent update might have been disappointing for some. Here’s why its worth
Some companies treat their dividend like a bill they have to pay every month, not a bonus they hand out when times are good. That mindset is what separates a stock that merely offers a dividend from one that has actually built its business around protecting it, through recessions, inflation spikes, and years when growth
The US Capitol is reflected in the Capitol Reflecting Pool in Washington, DC, US, October 27, 2026. Umit Bektas | Reuters The stock market is not yet pricing in a Democratic sweep of Congress — despite some polls and most prediction markets pointing that way — so that scenario could weigh on share prices Wednesday,
Investors are always on the lookout for the next big thing in technology, and this time around, it may be quantum computing. It offers us an enormous step up from classical computing, allowing us to solve many of today’s impossible problems. While classical systems use bits to store information in the form of a zero
A roaring market is obviously good news for stock and commodity exchanges, because it prompts more revenue-generating trading activity. To this end, with the market still within sight of record highs, the exchanges are doing pretty well, although they’re not at the levels they reached earlier this year, when over $1 trillion in investments exchanged
Lumentum Holdings (NASDAQ:LITE) did just about everything right this morning, and its stock got punished anyway. Shares of the laser and optics specialist were down 14.9% as of 12:55 p.m. ET. Q1 2027 results beat Wall Street’s expectations and the company agreed to be acquired by Marvell Technology (NASDAQ:MRVL) in an all-stock deal. Marvell’s stock
Shares of AppLovin (APP +0.15%) are down 65% so far in 2026, making it the worst performer in the S&P 500 as of the end of October. It’s been an abysmal performance for the tech stock. And rather than one big sell-off, it’s been a continually slow, painful decline for the company’s shareholders. The adtech
California Resources has rewarded long term holders over the past five years, which naturally puts a spotlight on whether the current share price really lines up with what its sales can support. After a period that includes both a sizeable reported loss and new clean power ambitions, the question is how much revenue strength the
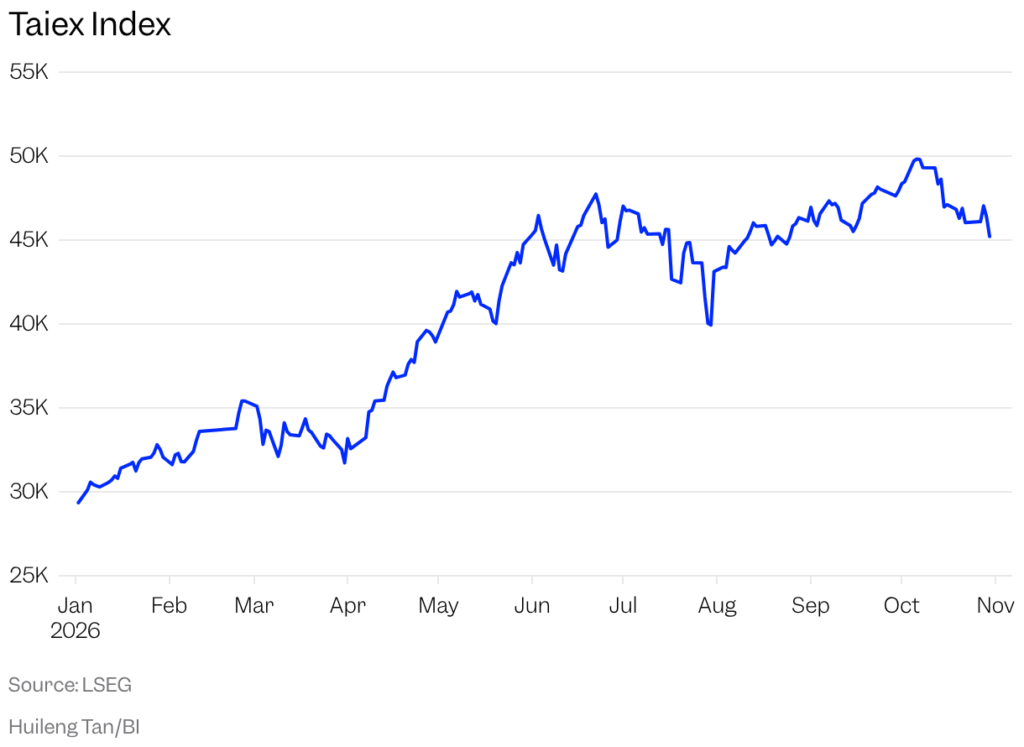
Taiwan’s AI stock boom is creating more ways for investors to profit from its chip supply chain, making early-stage startups a tougher pitch. Taiwan’s benchmark Taiex index is up more than 50% this year, making it the world’s best-performing major index after pulling ahead of South Korea’s Kospi. The gains extend well beyond Taiwan Semiconductor
MGM Q3 deep dive: margin recovery and digital growth offset soft leisure demand Hospitality and casino entertainment company MGM Resorts (NYSE:MGM) met Wall Street’s revenue expectations in Q3 2026, but sales were flat year on year at $4.21 billion. Its non-GAAP loss of $0.11 per share was significantly below analysts’ consensus estimates. Is now the
Shares of Amplitude (NASDAQ:AMPL) were among the winners last month as the data analytics software stock benefited from a broader rotation out of AI infrastructure stocks into undervalued stocks like Amplitude, and it also got a number of positive analyst notes during the month. Though there was no major company-specific news out on Amplitude, those