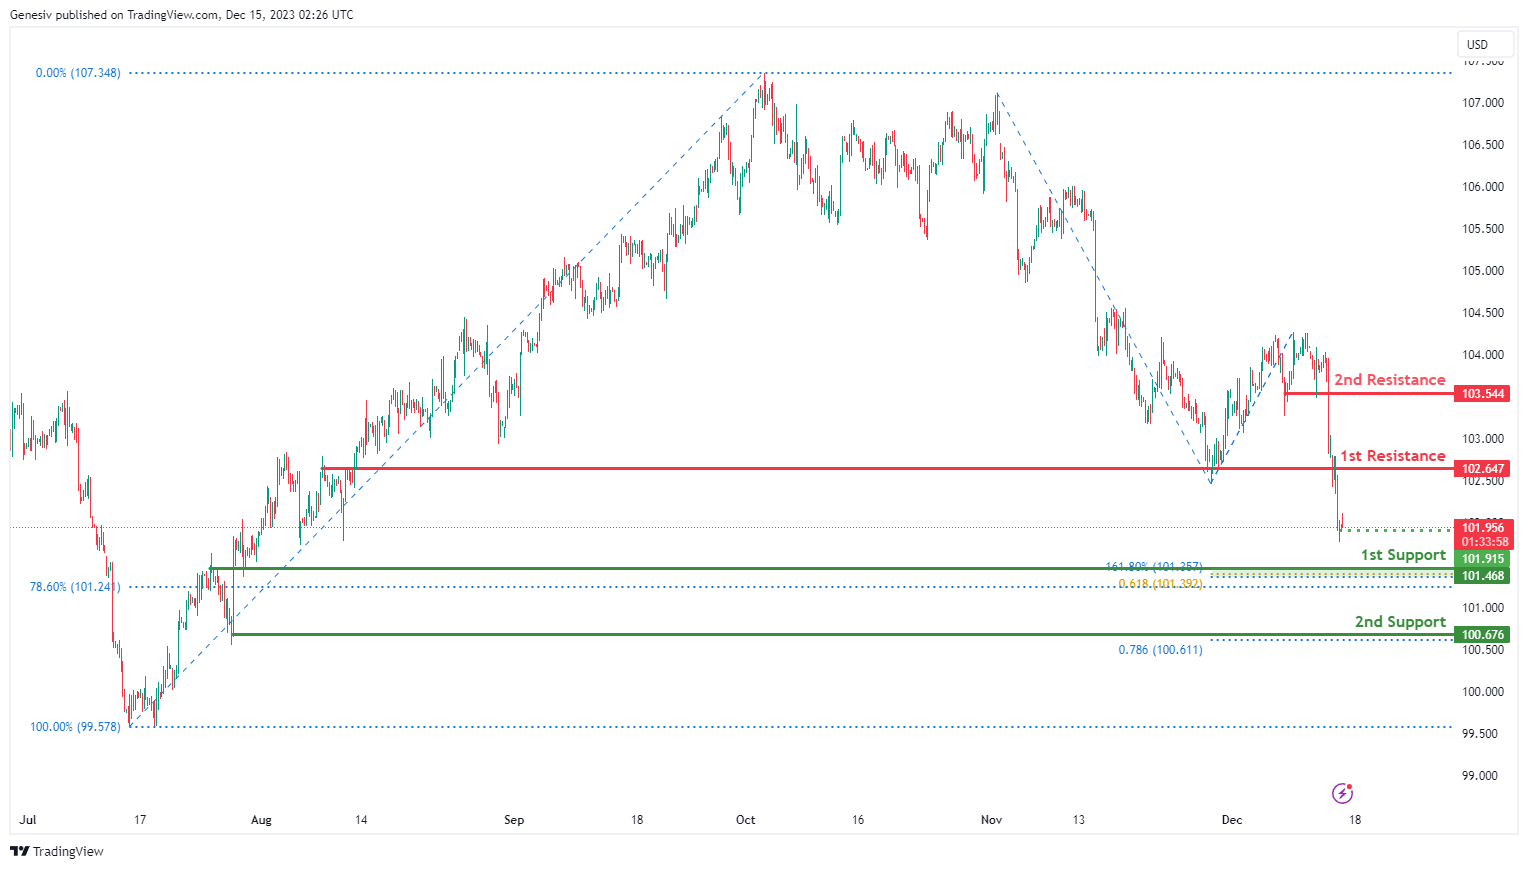
DXY:
The DXY (US Dollar Index) chart currently shows an overall bearish momentum, indicating a potential for price to make a bearish continuation towards the 1st support.
The 1st support level at 101.46 is identified as an overlap support that aligns with a confluence of Fibonacci levels i.e. the 161.80% extension and the 61.80% projection levels. Further below, the 2nd support level at 100.67 is noted as a swing-low support that aligns with the 78.60% Fibonacci projection level, further reinforcing its importance as a potential key support level.
On the resistance side, the 1st resistance level at 102.64 is identified as an overlap resistance. Higher up, the 2nd resistance level at 103.54 is marked as a pullback resistance, suggesting a potential barrier for further upside movement.
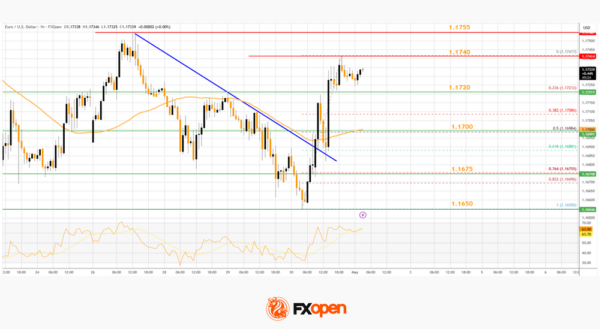
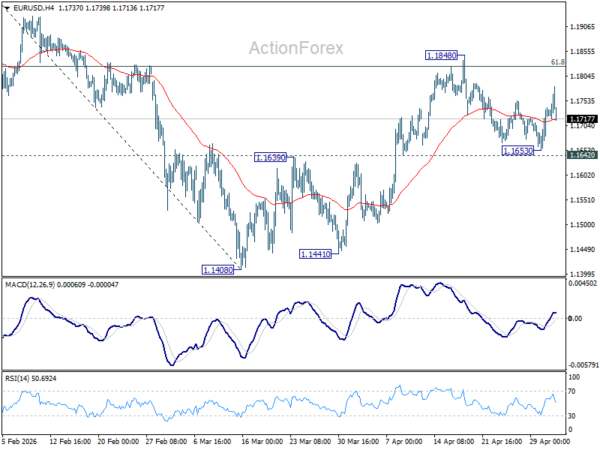
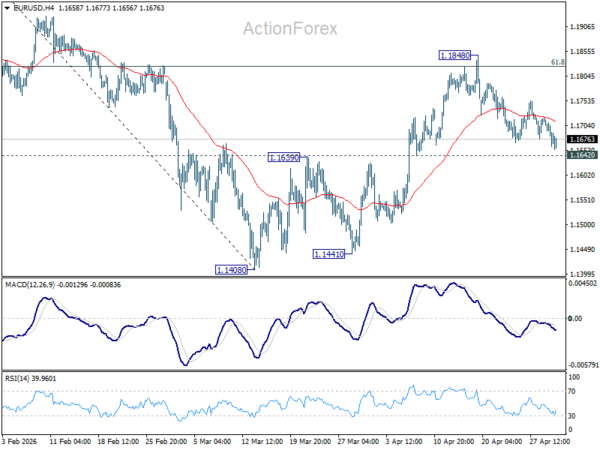
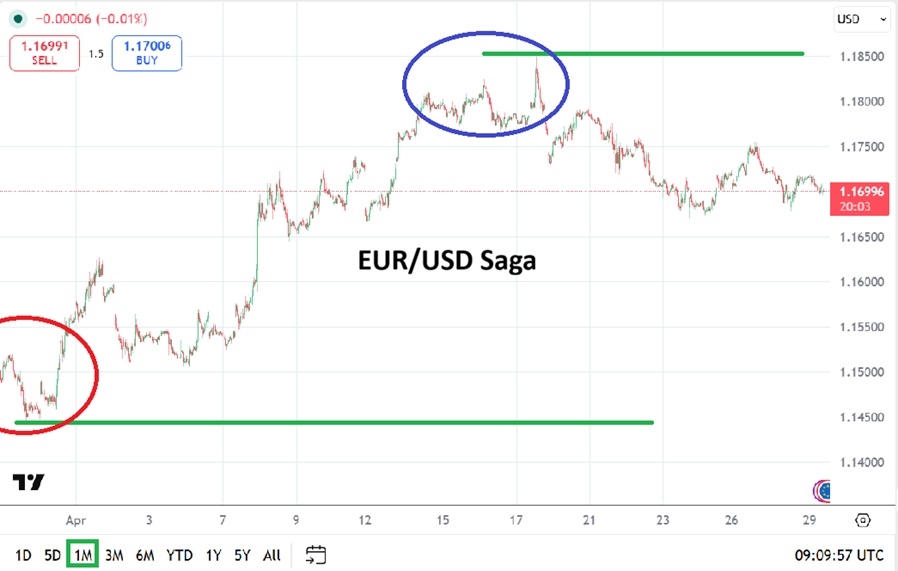
EUR/USD:
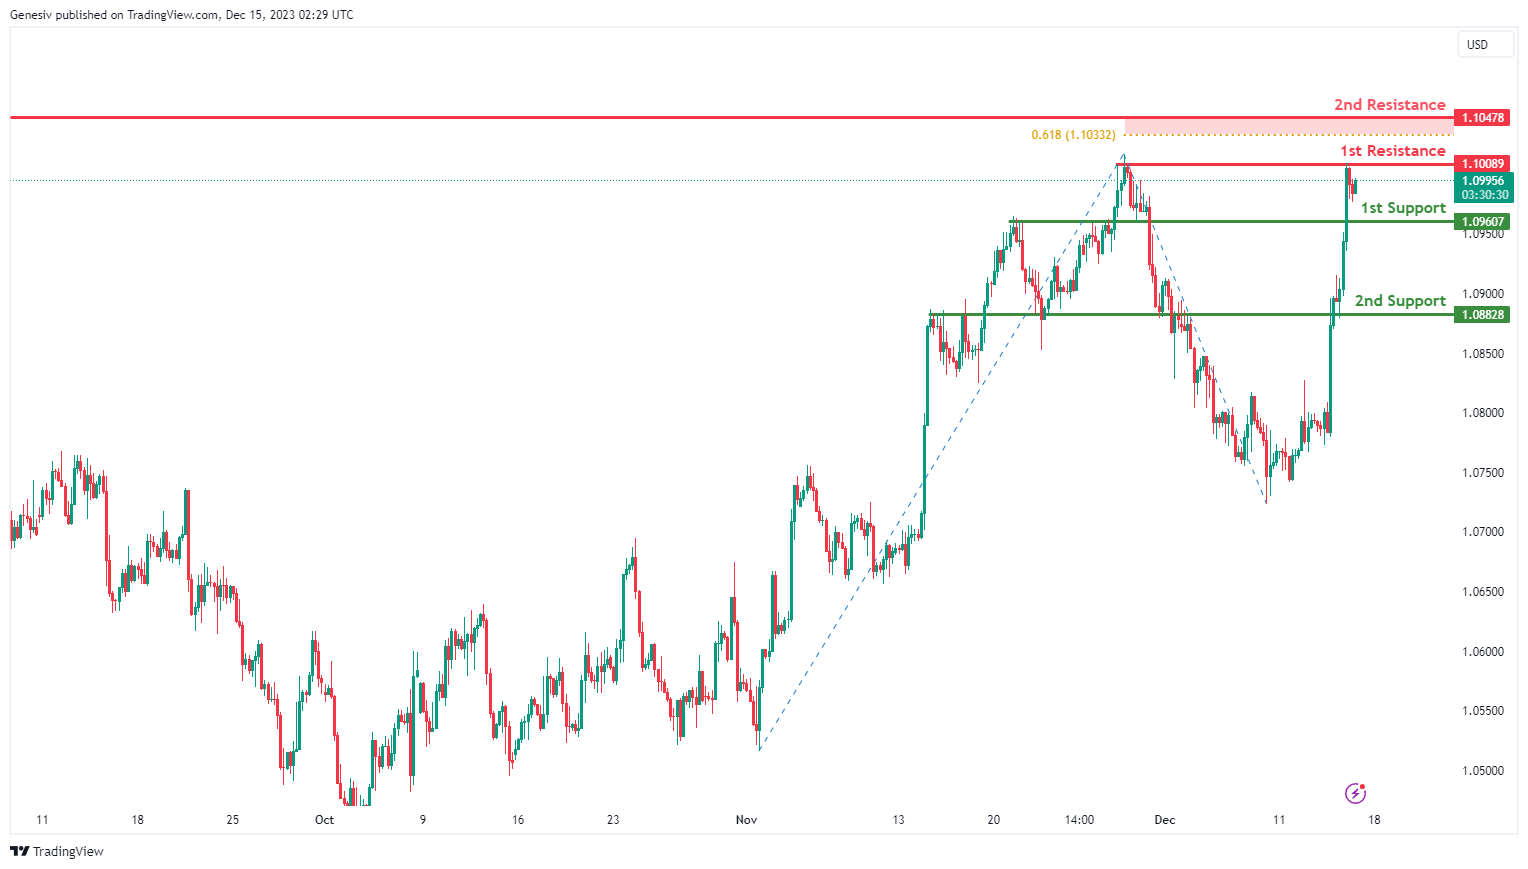
The EUR/USD chart currently exhibits an overall bullish momentum. In this context, there is a potential scenario for price to make a bullish continuation towards the 1st resistance.
The 1st resistance level at 1.1008 is identified as a swing-high resistance while the 2nd resistance level at 1.1047 is marked as a pullback resistance that aligns close to the 61.80% Fibonacci projection level, suggesting a potential barrier for further upside movement.
To the downside, the 1st support level at 1.0960 is identified as an overlap support. Further below, the 2nd support level at 1.0882 is also noted as an overlap support, further reinforcing its importance as a potential key support level.
EUR/JPY:
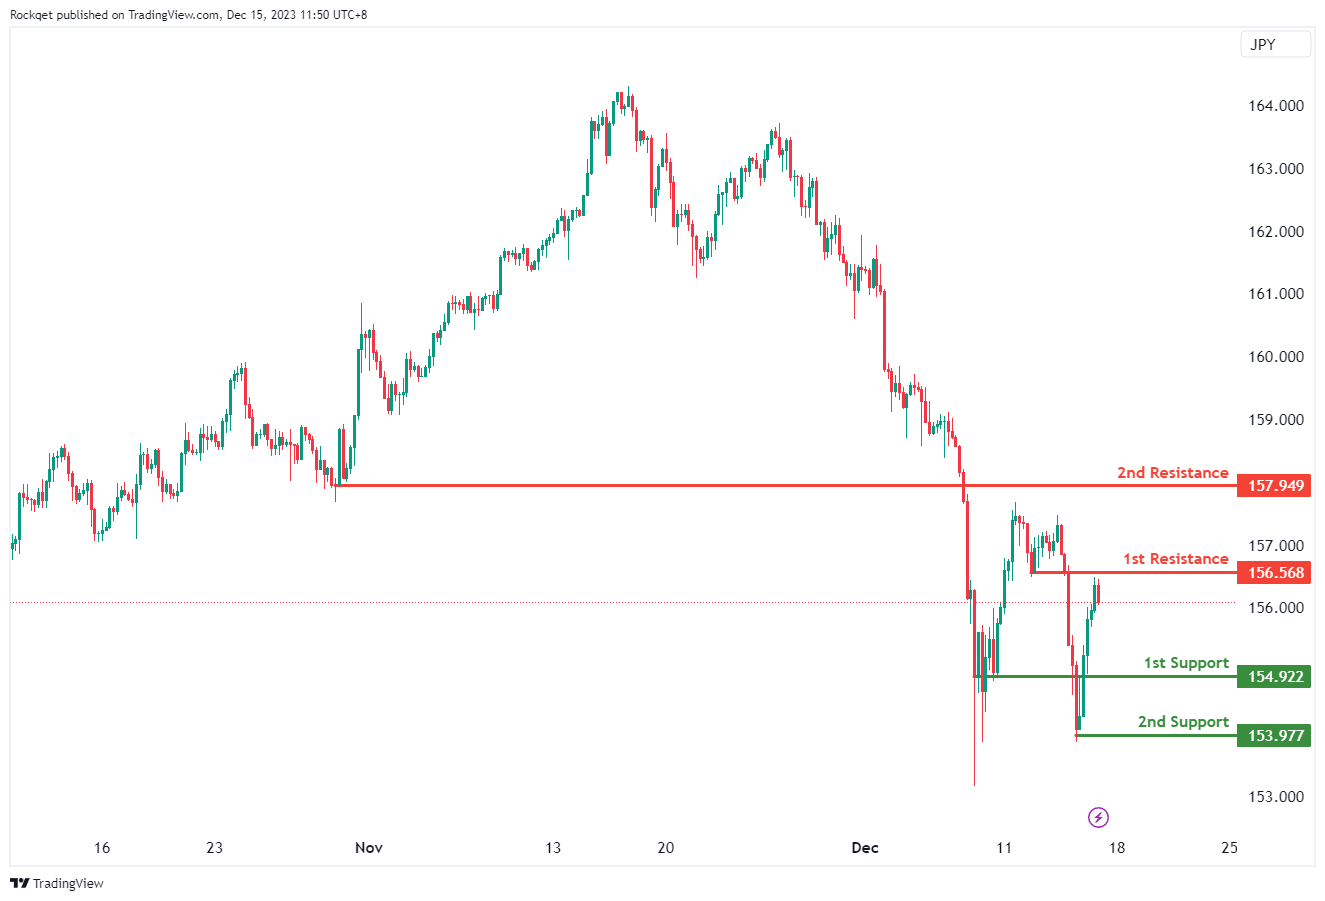
The EUR/JPY chart currently has a bearish overall momentum, and there is a potential scenario where the price could make a short-term rise towards the 1st resistance before reversing off it and dropping towards the 1st support.
The 1st support at 154.92 is considered significant as it represents a pullback support. This level indicates a potential area where buying interest may emerge after a pullback, providing support for the currency pair.
Similarly, the 2nd support at 153.98 is identified as a swing low support. This adds to the support structure, indicating another potential zone where buying interest may be present, further reinforcing the potential for a short-term rise.
On the resistance side, the 1st resistance at 156.57 is associated with a pullback resistance. This level may act as a barrier where selling interest could intensify, potentially causing a temporary pause or reversal in the bearish trend.
Furthermore, the 2nd resistance at 157.95 is characterized as a pullback resistance. This adds another layer of significance to the resistance, suggesting a potential area where selling pressure may increase, especially considering the alignment with another pullback resistance level.
EUR/GBP:
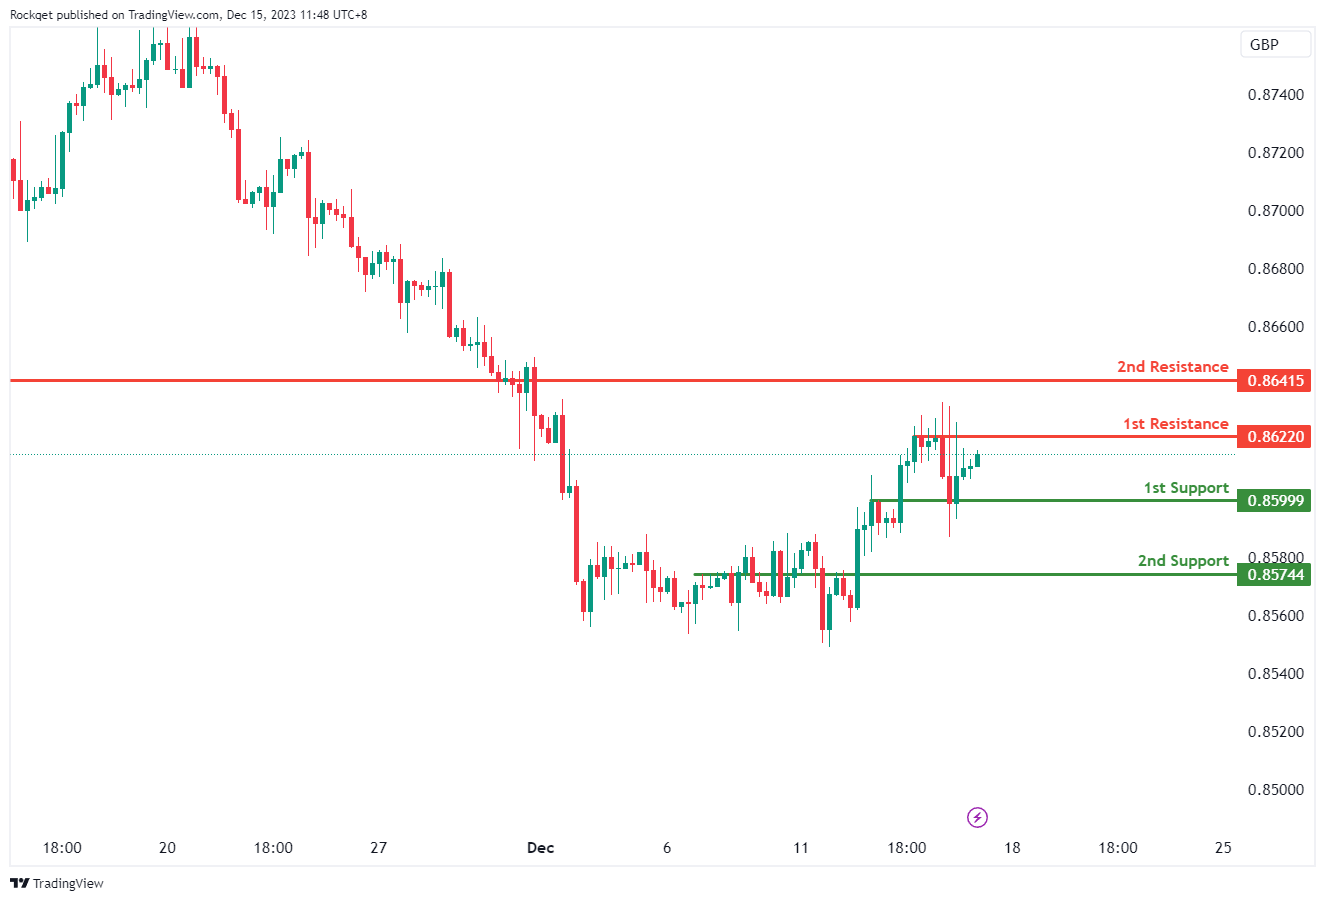
The EUR/GBP chart currently has a bearish overall momentum, and there is a potential scenario where the price could make a short-term rise towards the 1st resistance before reversing off it and dropping towards the 1st support.
The 1st support at 0.8642 is considered significant as it represents an overlap support. This level indicates a convergence of historical price points, reinforcing its potential as a crucial area where buying interest may emerge. Additionally, this support level aligns with the 0.8642 level, providing additional significance.
Similarly, the 2nd support at 0.8574 is identified as an overlap support. This adds another layer of support, indicating another potential zone where buying interest may be present, further reinforcing the potential for a short-term rise.
On the resistance side, the 1st resistance at 0.8622 is associated with multi-swing high resistance. This level may act as a barrier where selling interest could intensify, potentially causing a temporary pause or reversal in the bearish trend.
GBP/USD:
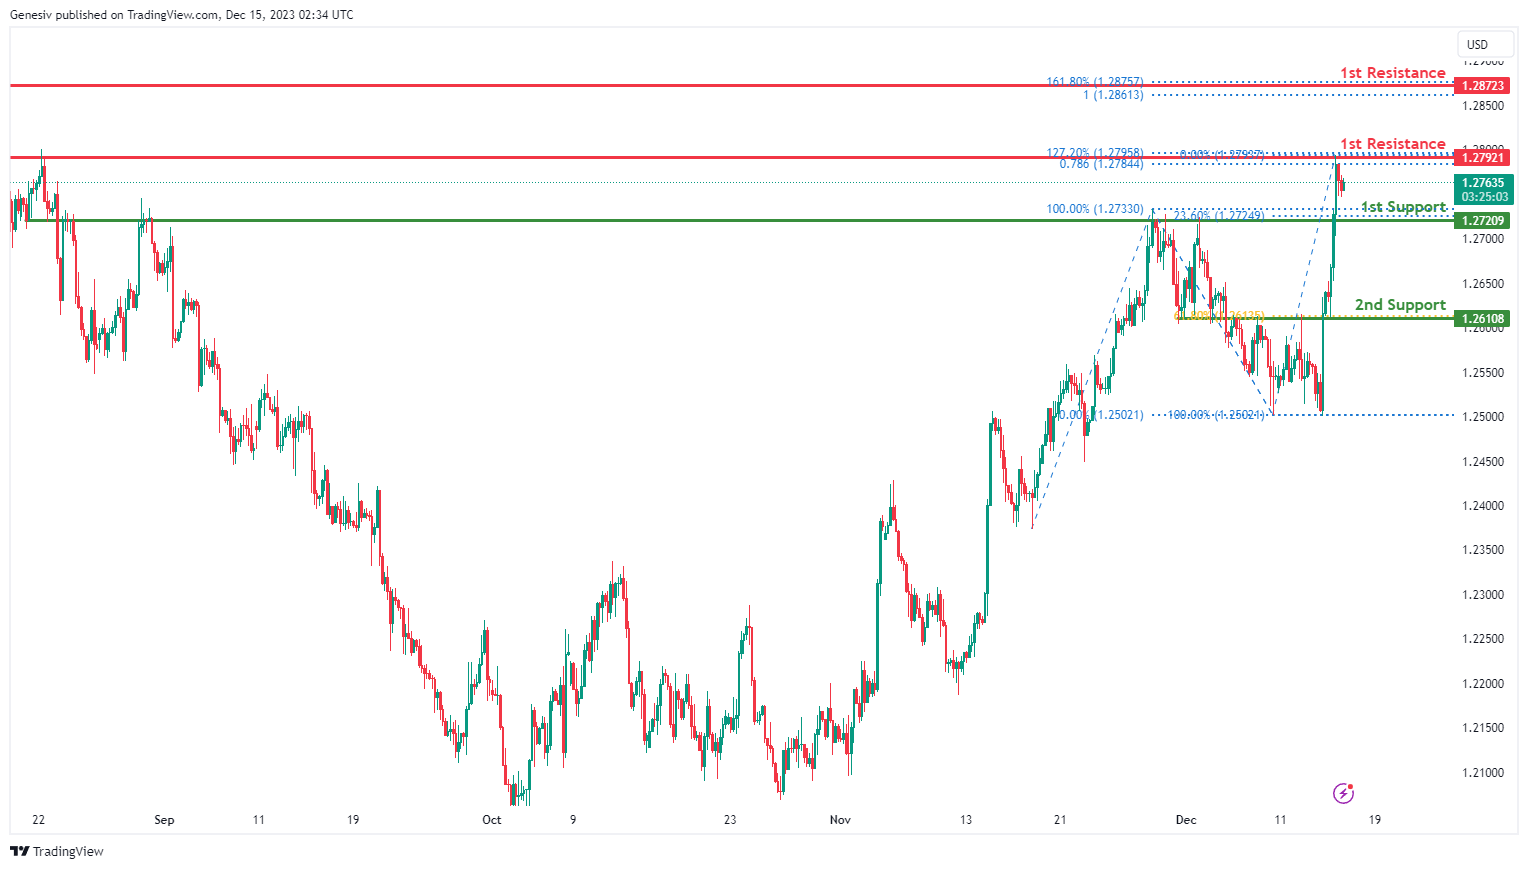
The GBP/USD chart currently exhibits an overall bullish momentum. In this context, there is a potential scenario for price to make a bullish continuation towards the 1st resistance.
The 1st resistance level at 1.2792 is identified as a multi-swing-high resistance that aligns with a confluence of Fibonacci levels i.e. the 127.20% extension and the 78.60% projection levels. Higher up, the 2nd resistance level at 1.2872 is marked as a pullback resistance that aligns with a confluence of Fibonacci levels i.e. the 161.80% extension and the 100.00% projection levels, suggesting a potential barrier for further upside movement.
To the downside, the 1st support level at 1.2720 is identified as an overlap support that aligns with the 23.60% Fibonacci retracement level. Further below, the 2nd support level at 1.2610 is also noted as an overlap support that aligns with the 61.80% Fibonacci retracement level, further reinforcing its importance as a potential key support level.
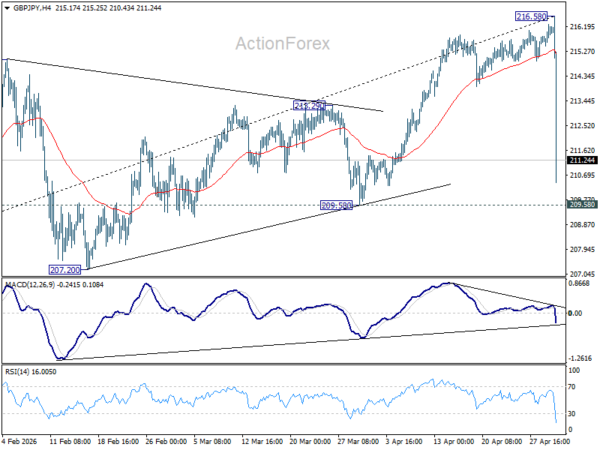
GBP/JPY:
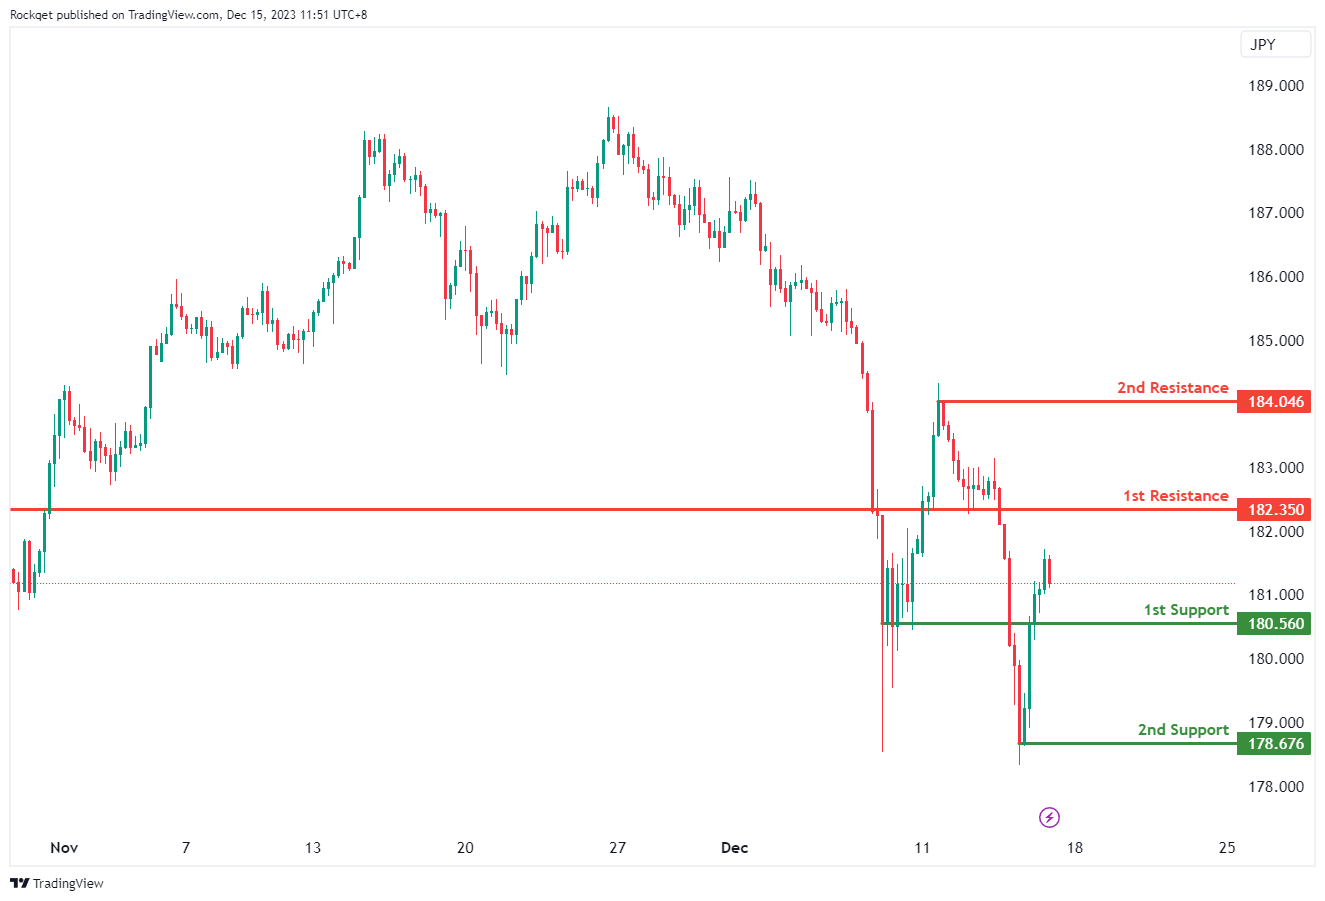
The GBP/JPY chart currently exhibits a weak bullish momentum with low confidence, suggesting a potential for a cautious bullish continuation towards the 1st resistance.
The 1st support at 180.35 is considered significant as it represents a pullback support. This level indicates a potential area where buying interest may emerge after a pullback, providing support for the currency pair. However, given the weak bullish momentum with low confidence, traders should approach the potential continuation cautiously.
Similarly, the 2nd support at 178.68 is identified as another pullback support, adding another layer of potential support for the currency pair.
The intermediate resistance at 182.56 is associated with an overlap resistance. This level may act as a barrier where selling interest could intensify, potentially causing a temporary pause or consolidation in the bullish trend. The weak bullish momentum suggests that the breakout through this level may not be as strong.
Furthermore, the 1st resistance at 184.05 is characterized as a swing high resistance. This adds further significance to the resistance, suggesting a potential area where selling pressure may increase, especially considering its alignment with a previous swing high. Again, the weak bullish momentum should be taken into consideration when evaluating the potential for a breakout.
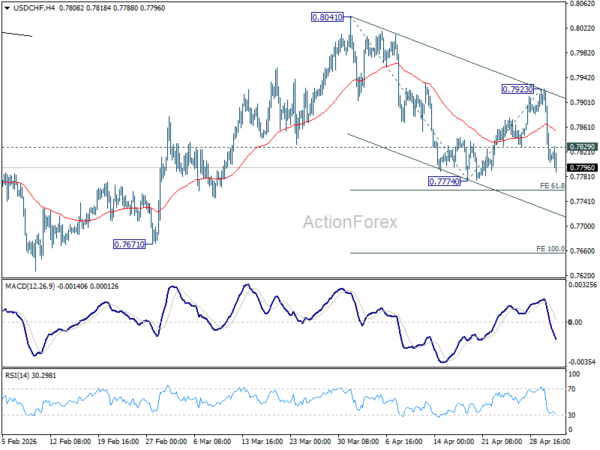
USD/CHF:
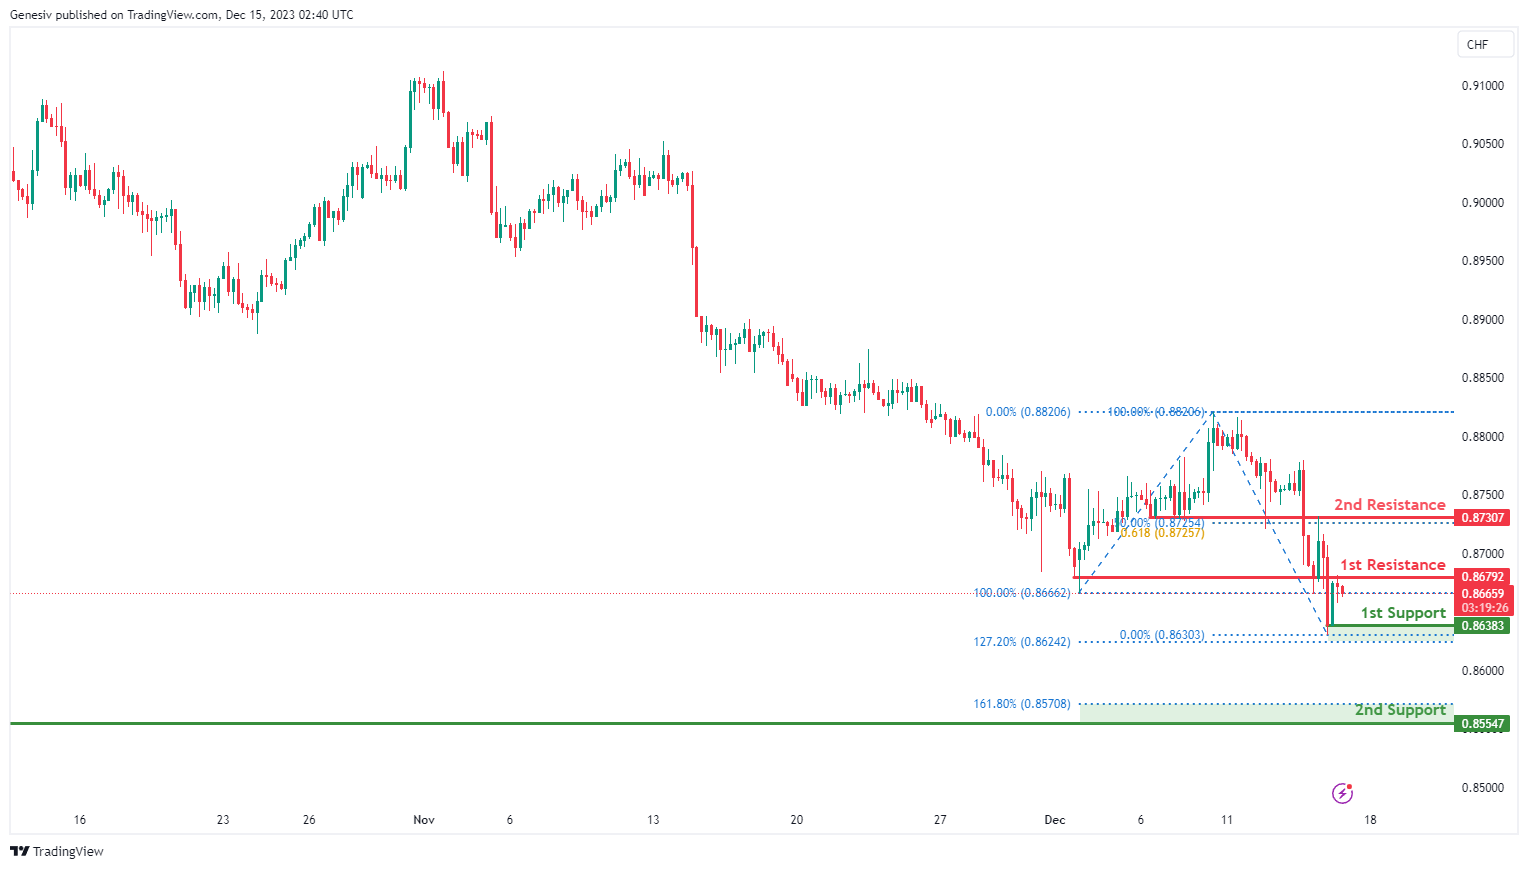
The USD/CHF chart currently exhibits an overall bearish momentum. In this context, there is a potential scenario for price to make a bearish continuation towards the 1st support.
The 1st support level at 0.8638 is identified as a pullback support that aligns with the 127.20% Fibonacci extension level. Further below, the 2nd support level at 0.8554 is noted as a multi-swing-low support that aligns close to the 161.80% Fibonacci extension level, further reinforcing its importance as a key support level.
On the resistance side, the 1st resistance level at 0.8679 is identified as an overlap resistance. Higher up, the 2nd resistance level at 0.8730 is also marked as an overlap resistance that aligns with a confluence of Fibonacci levels i.e. the 50.00% retracement and the 61.80% projection levels, suggesting a potential barrier for further upside movement.
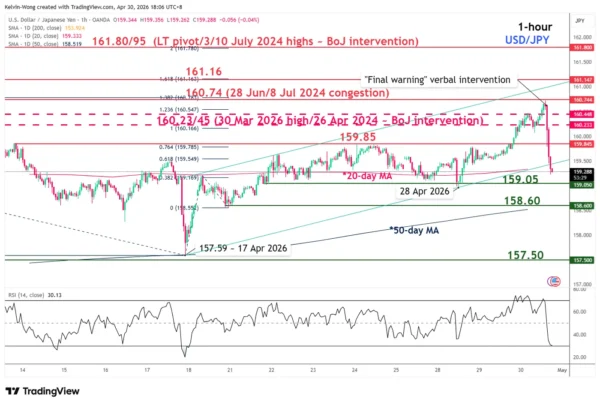
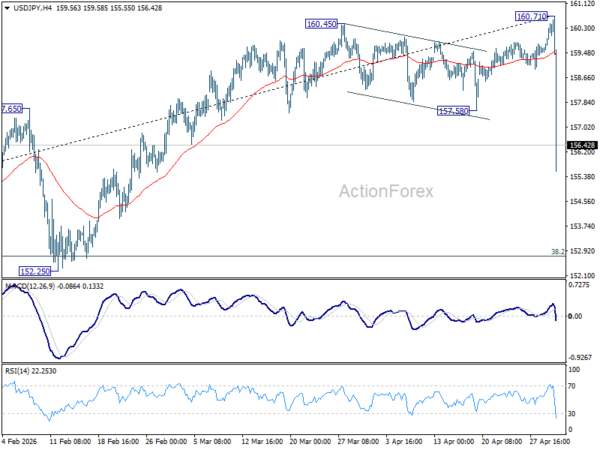
USD/JPY:
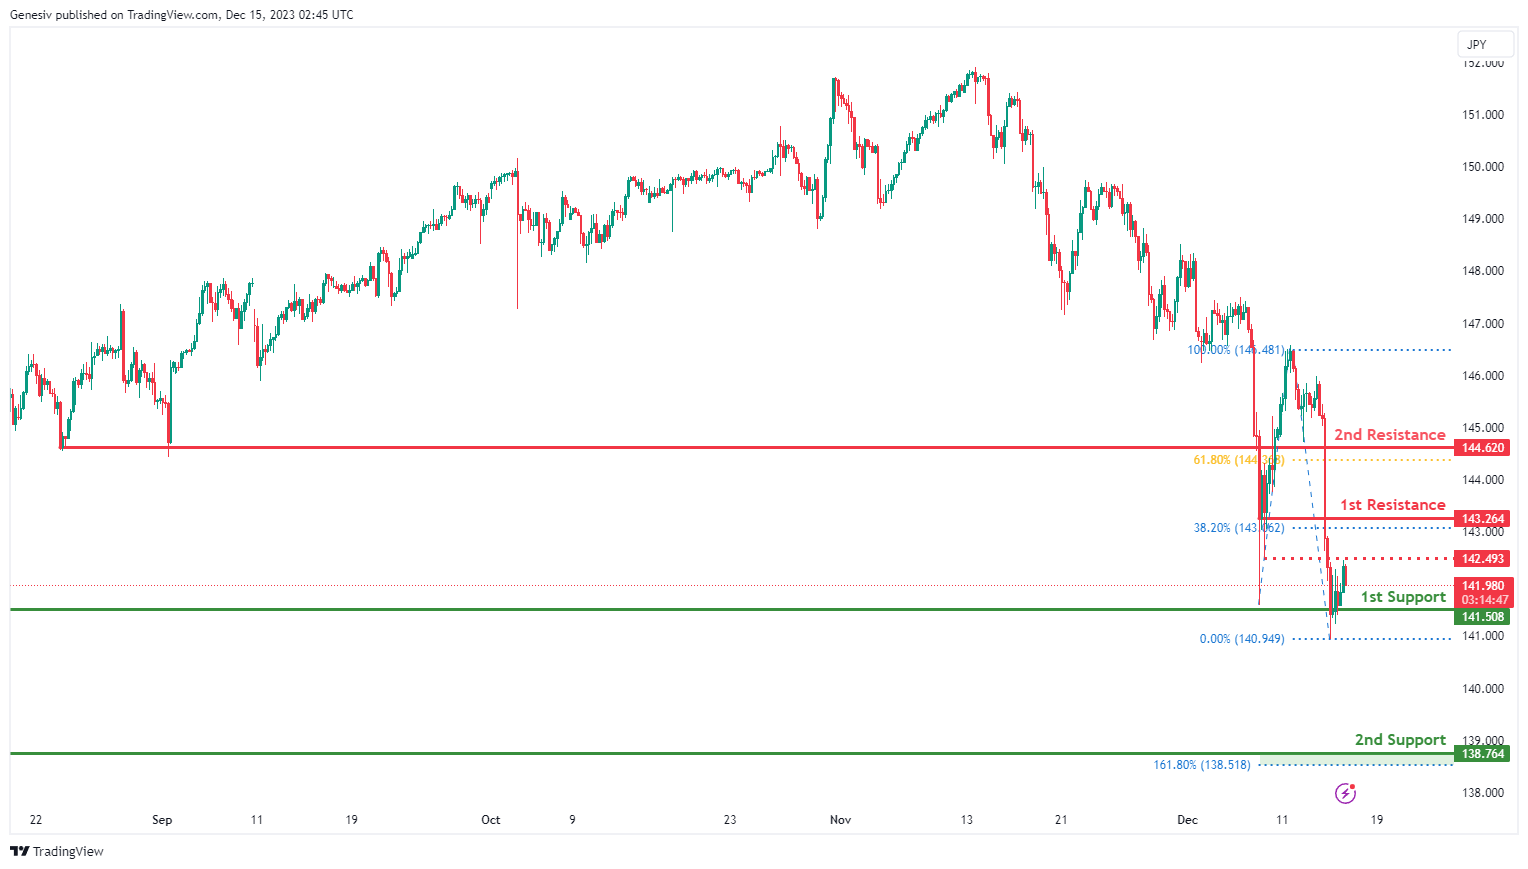
The USD/JPY chart currently exhibits a neutral momentum, indicating a potential for price to fluctuate between the 1st support and the 1st resistance.
The 1st support level at 141.50 is identified as a swing-low support while the 2nd support level at 138.76 is also noted as swing-low support that aligns close to the 161.80% Fibonacci extension level, further reinforcing its importance as a key support level.
On the resistance side, the intermediate resistance level at 142.49 is identified as an overlap resistance while the 1st resistance level at 143.26 is noted as a pullback resistance that aligns close to the 38.20% Fibonacci retracement. Higher up, the 2nd resistance level at 146.62 is identified as a pullback resistance that aligns close to the 61.80% Fibonacci retracement level, suggesting a potential barrier for further upside movement.
USD/CAD:
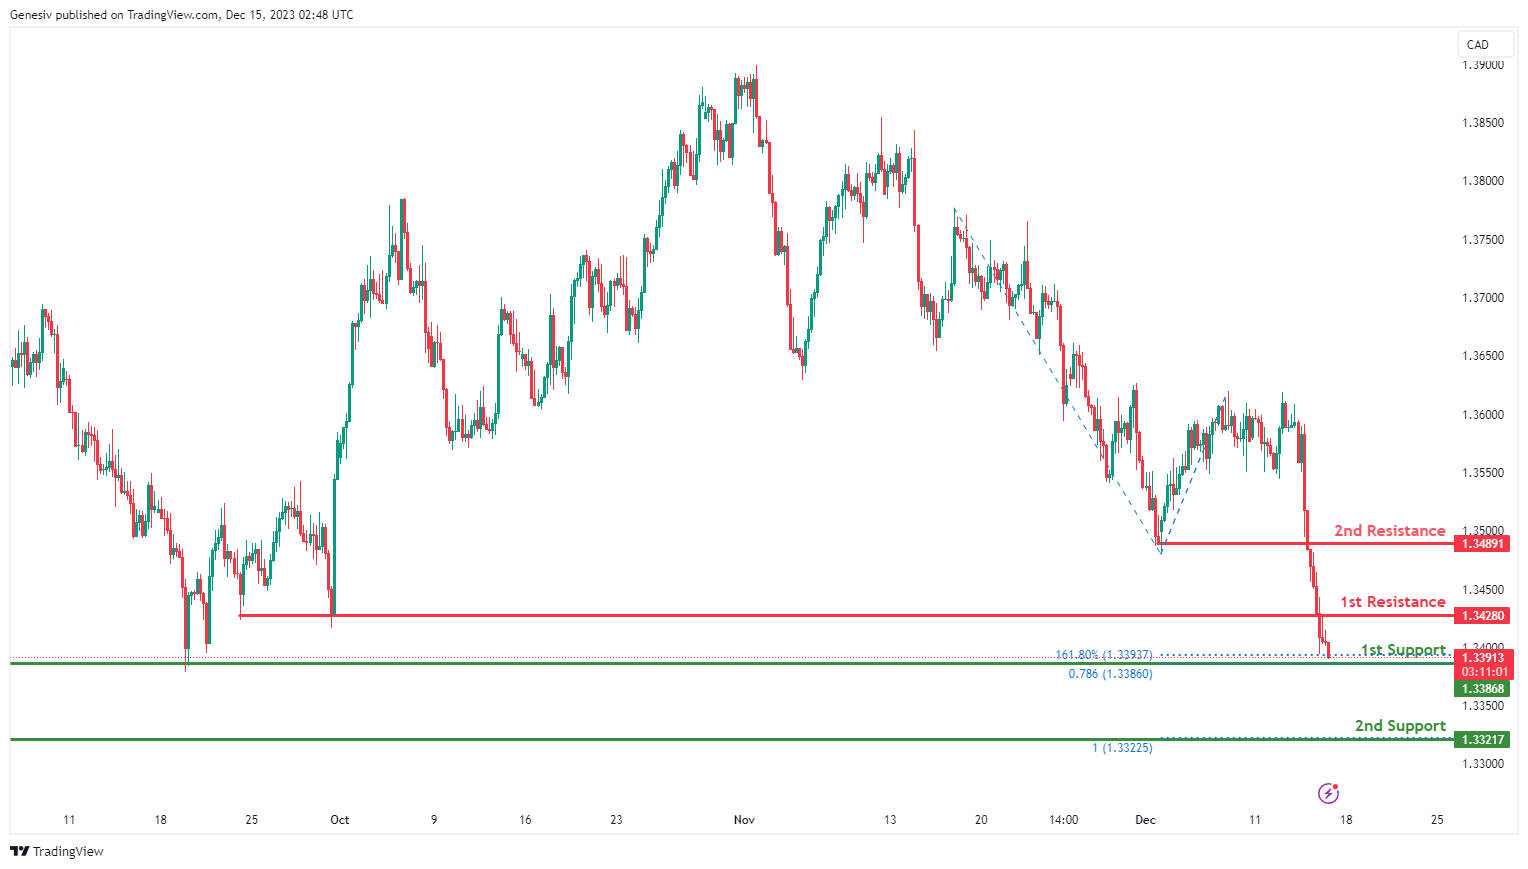
The USD/CAD chart currently exhibits an overall bearish momentum. In this context, there is a potential scenario for price to make a bearish continuation towards the 1st support.
The 1st support level at 1.3386 is identified as a multi-swing-low support that aligns with a confluence of Fibonacci levels i.e. the 161.80% extension and the 78.60% projection levels. Further below, the 2nd support level at 1.3321 is marked as a pullback support that aligns with the 100.00% Fibonacci projection level, further reinforcing its importance as a key support level.
To the upside, the 1st resistance level at 1.3428 is identified as a pullback resistance while the 2nd resistance level at 1.3489 is also noted as a pullback resistance, suggesting a potential barrier for further upside movement.
AUD/USD:
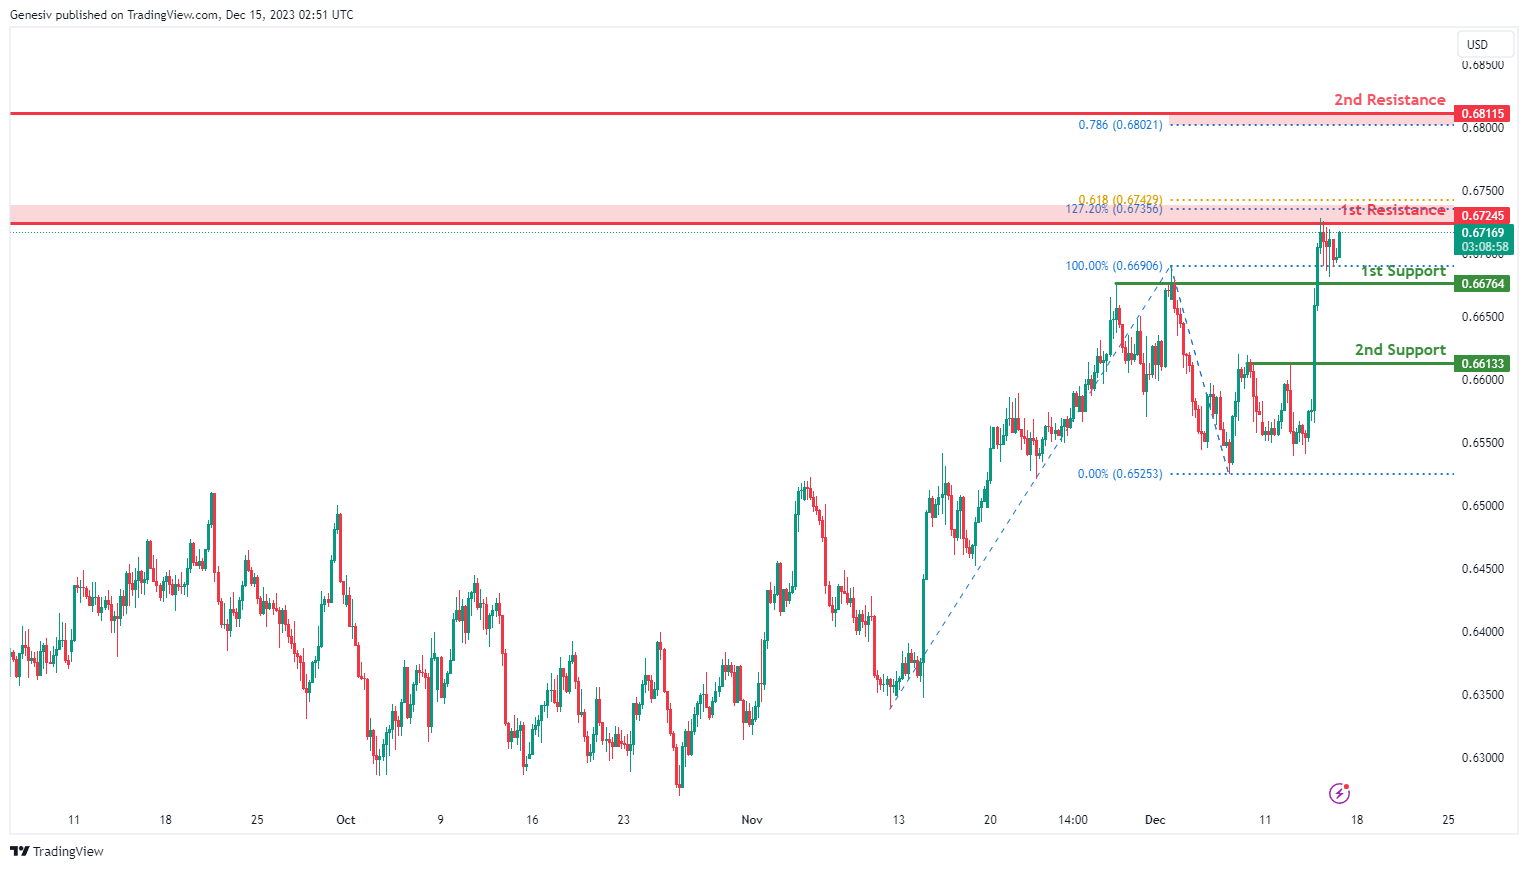
The AUD/USD chart currently exhibits an overall bullish momentum. In this context, there is a potential scenario for price to make a bullish continuation towards the 1st resistance.
The 1st resistance level at 0.6724 is identified as a swing-high resistance that aligns with a confluence of Fibonacci levels i.e. the 127.20% extension and the 61.80% projection levels. Higher up, the 2nd resistance level at 0.6811 is also marked as a swing-high resistance that aligns with the 78.60% Fibonacci projection level, indicating its potential significance as a barrier for further upward movement.
To the downside, the 1st support level at 0.6676 is identified as a pullback support while the 2nd support level at 0.6613 is also noted as a pullback support, further reinforcing its importance as a key support level.
NZD/USD
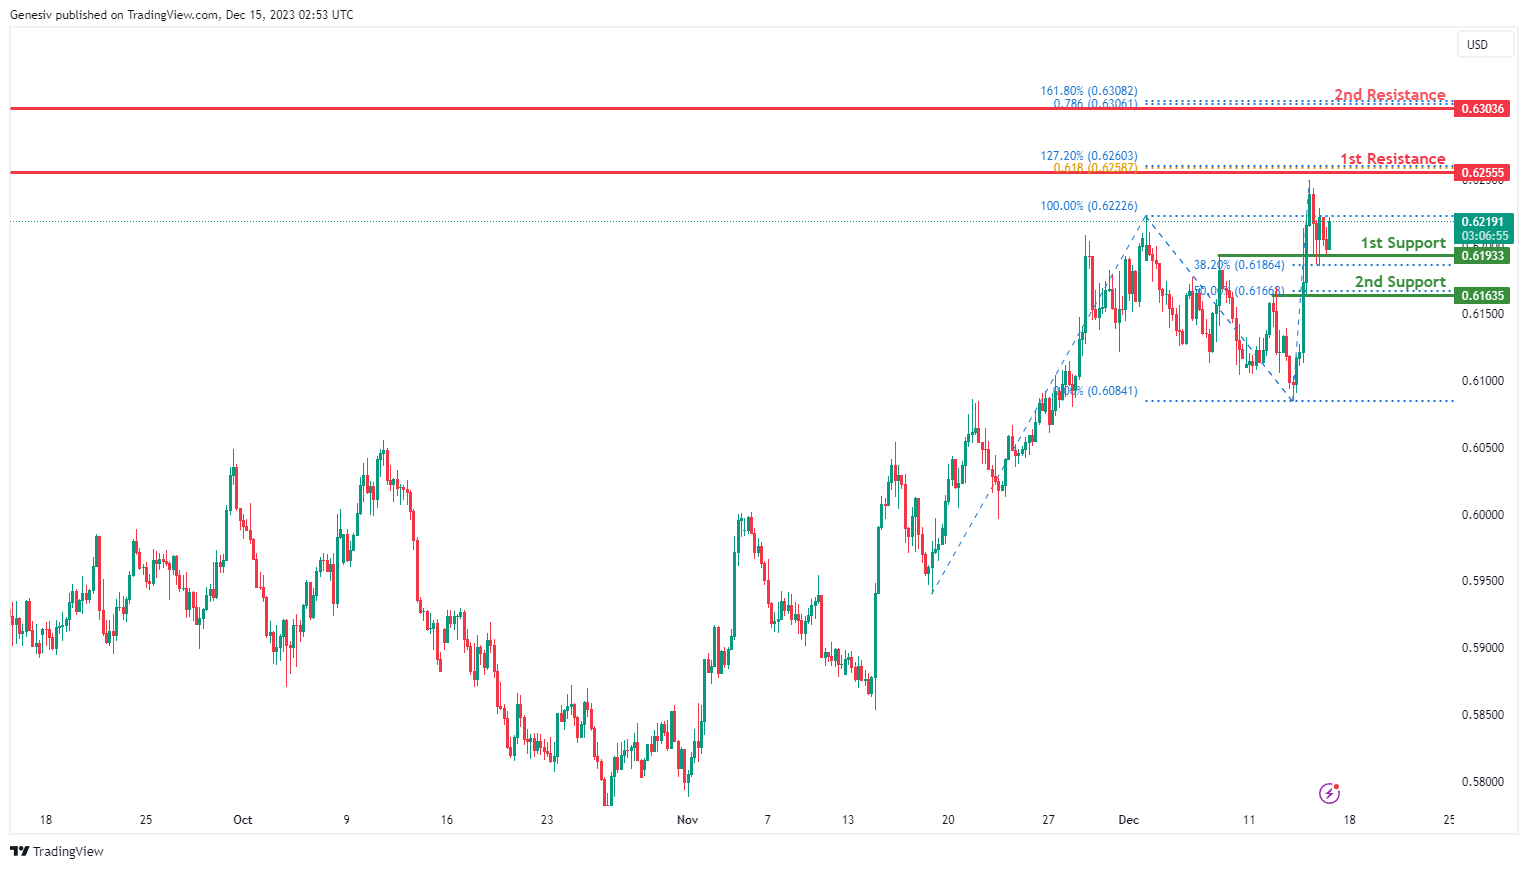
The NZD/USD chart currently exhibits an overall bullish momentum. In this context, there is a potential scenario for price to make a bullish continuation towards the 1st resistance.
The 1st resistance level at 0.6255 is identified as a swing-high resistance that aligns with a confluence of Fibonacci levels i.e. the 127.20% extension and the 61.80% projection levels. Higher up, the 2nd resistance level at 0.6303 is also marked as a swing-high resistance that aligns with a confluence of Fibonacci levels i.e. the 161.80% extension and the 78.60% projection levels, indicating its potential significance as a barrier for further upward movement.
To the downside, the 1st support level at 0.6193 is identified as an overlap support that aligns with the 38.20% Fibonacci retracement level while the 2nd support level at 0.6163 is noted as a pullback support that aligns with the 50.00% Fibonacci retracement level, further reinforcing its importance as a key support level.
DJ30:
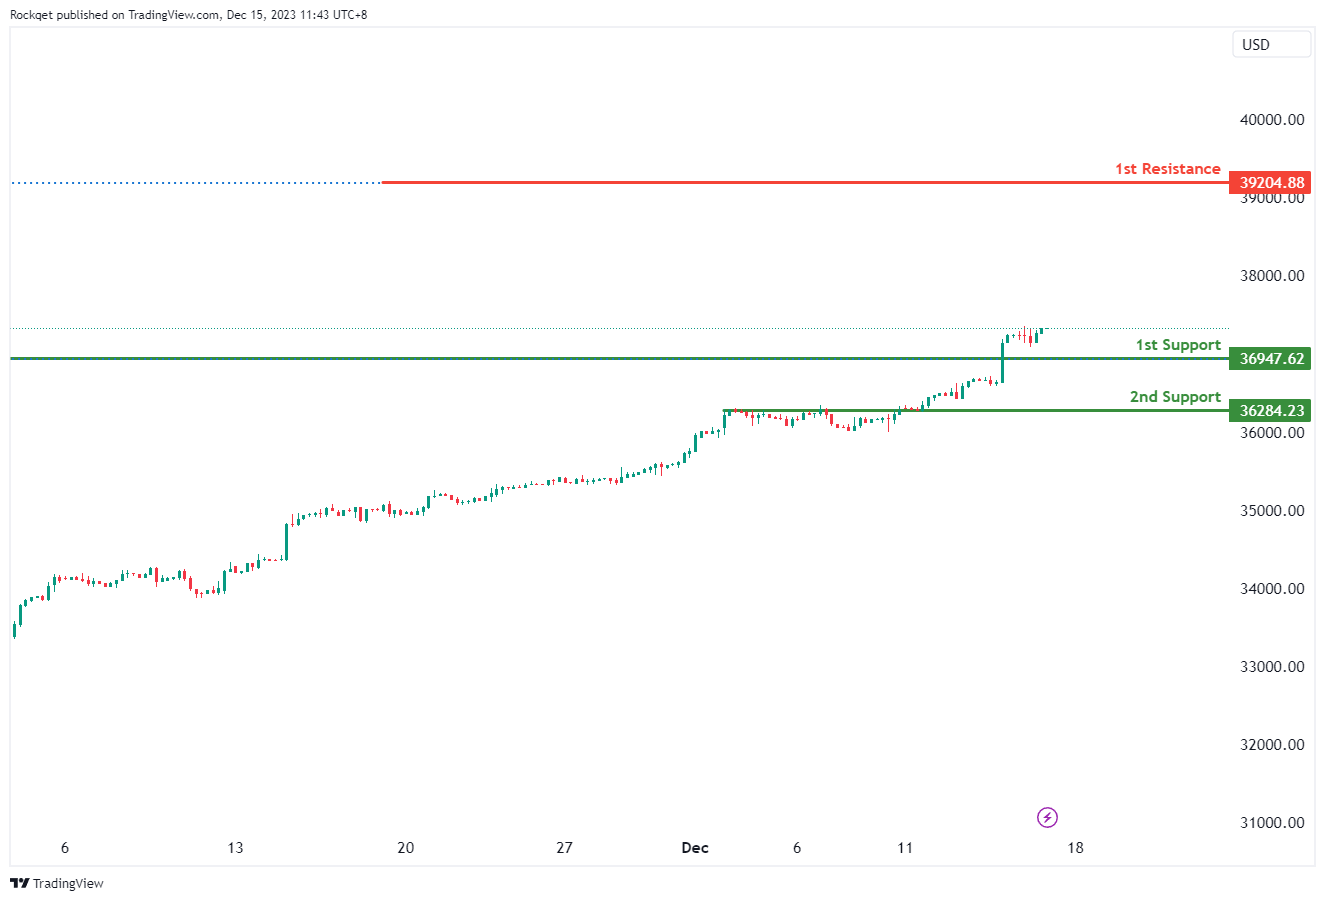
The DJ30 (Dow Jones Industrial Average) chart currently exhibits a bullish overall momentum, indicating a potential for a bullish continuation towards the 1st resistance.
The 1st support at 36947.62 is considered significant as it represents a pullback support. This level suggests a potential area where buying interest may emerge after a pullback, providing support for the index and contributing to the potential for a bullish continuation.
Similarly, the 2nd support at 36284.23 is identified as an overlap support. This adds an additional layer of support, indicating another potential zone where buying interest may be present, further reinforcing the potential for a bullish continuation.
On the resistance side, the 1st resistance at 39204.88 is linked to the 127.20% Fibonacci Extension. This adds significance to the resistance, suggesting a potential area where selling interest may intensify, potentially causing a temporary pause or reversal in the bullish trend.
GER40:
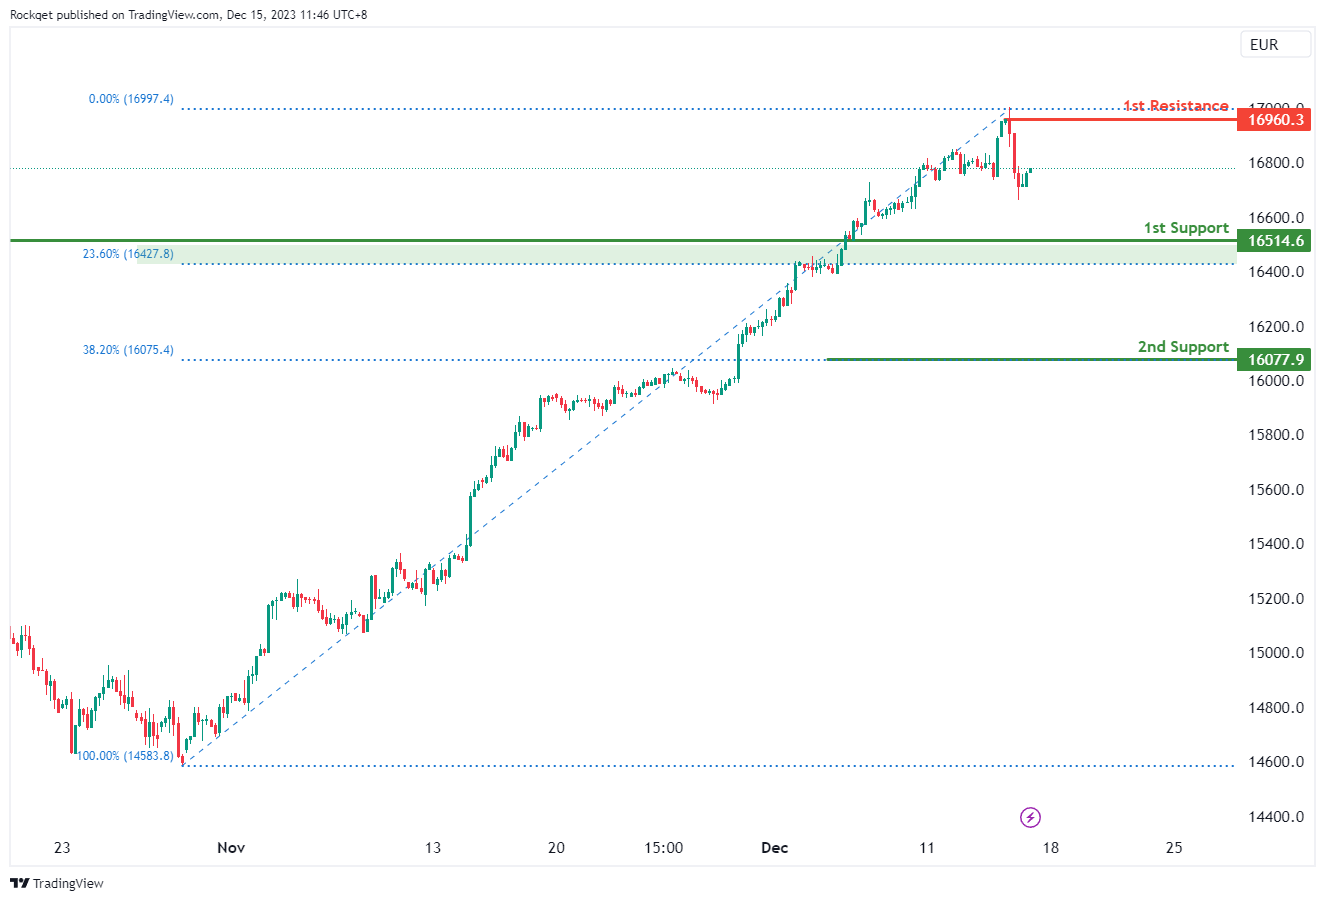
The GER40 (DAX) chart currently indicates a neutral overall momentum, suggesting a potential scenario where the price may fluctuate between the 1st resistance and the 1st support level.
The 1st support at 16514.60 is considered significant for several reasons. Firstly, it is identified as a pullback support, indicating a potential area where buying interest may emerge after a pullback, providing support for the index. Additionally, this support level aligns with the 23.60% Fibonacci Retracement, further reinforcing its importance as a potential reversal or bounce point.
Similarly, the 2nd support at 16077.90 is characterized as a pullback support and is associated with the 38.20% Fibonacci Retracement. This confluence strengthens the support level, indicating a zone where historical price action aligns, and buyers may find significant interest, contributing to the potential for price fluctuation.
On the resistance side, the 1st resistance at 16960.30 is associated with a swing high resistance. This level may act as a barrier where selling interest could intensify, potentially causing a temporary pause or reversal in the neutral trend.
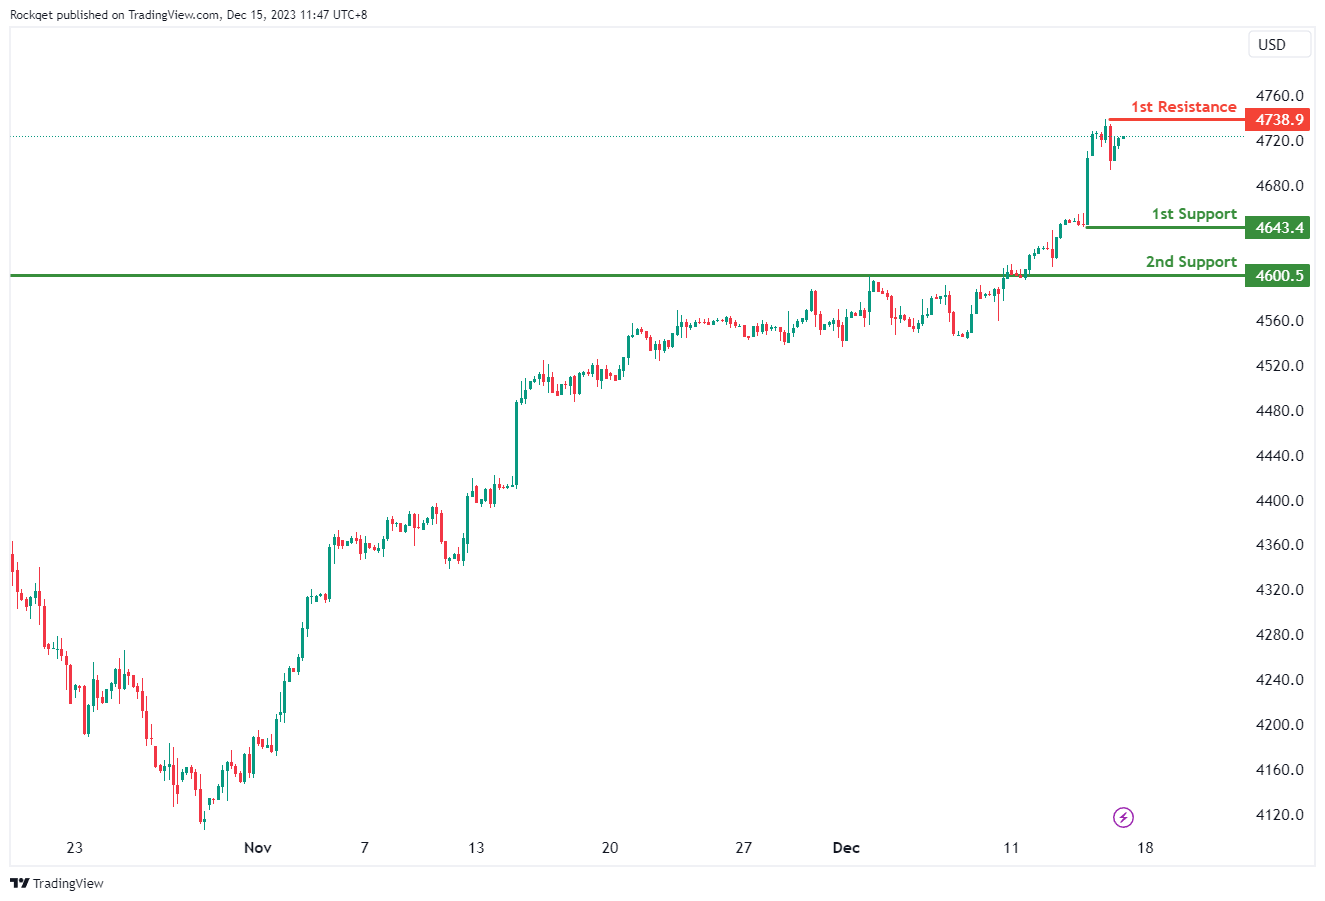
US500:
The chart’s overall momentum is currently bullish, suggesting a potential for a bullish continuation towards the 1st resistance.
The 1st support at 4643.4 is considered significant as it represents a pullback support. This level indicates a potential area where buying interest may emerge after a pullback, providing support for the price.
Similarly, the 2nd support at 4600.5 is identified as an overlap support. This adds an additional layer of significance to the support level, indicating a zone where historical price action aligns, and buyers may find significant interest, contributing to the potential for a bullish continuation.
On the resistance side, the 1st resistance at 4738.9 is associated with a swing high resistance. This level may act as a barrier where selling interest could intensify, potentially causing a temporary pause or reversal in the bullish trend.
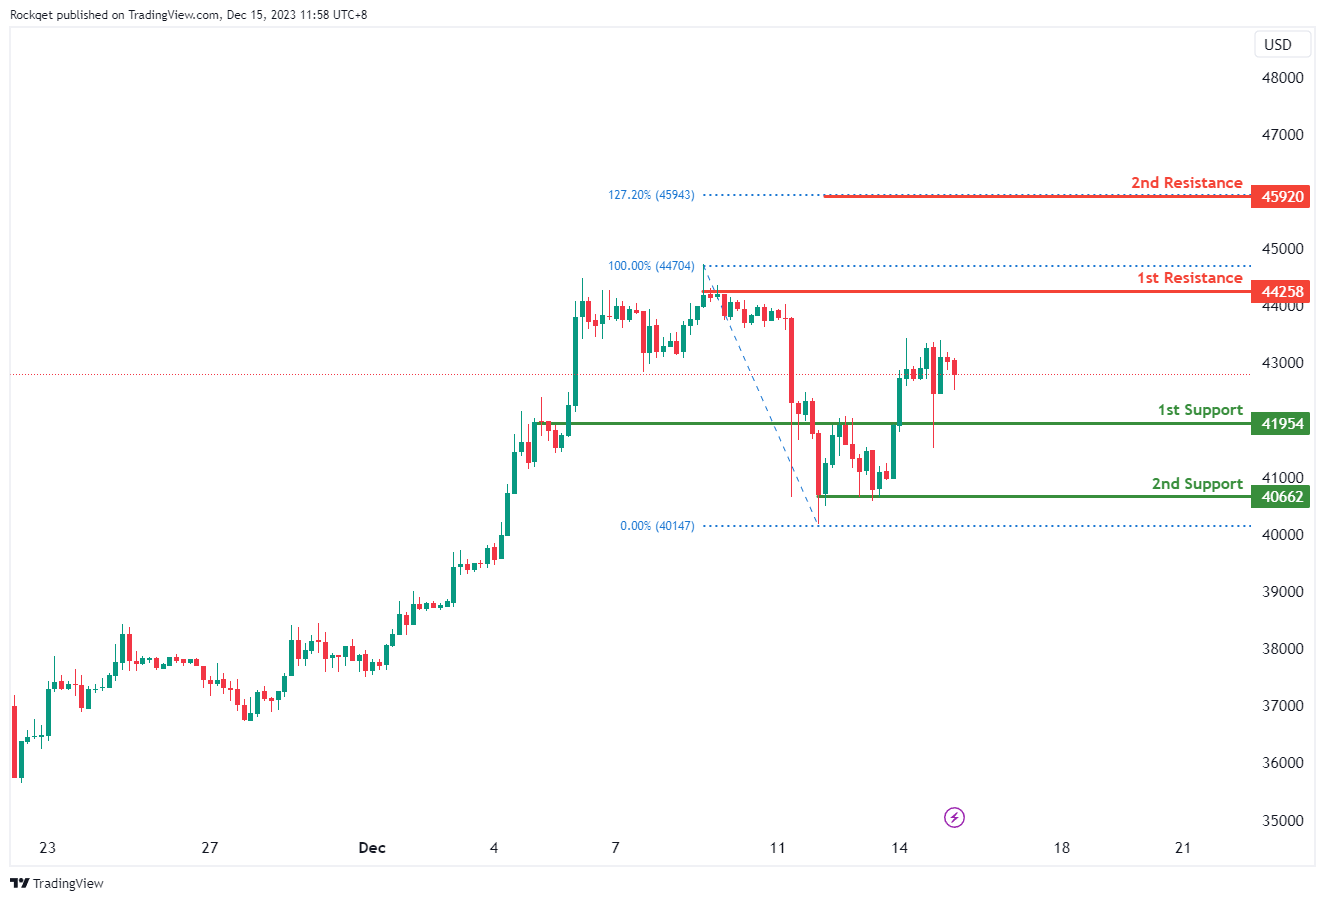
BTC/USD:
The BTC/USD overall momentum of the chart is currently described as weak bearish with low confidence, suggesting a potential for a bearish continuation towards the 1st support.
The 1st support at 41954 is considered significant for several reasons. Firstly, it is identified as an overlap support, suggesting a convergence of historical price points and reinforcing its potential as a crucial area where buying interest may emerge. Additionally, this support level aligns with an overlap, further enhancing its importance as a potential reversal or bounce point.
Similarly, the 2nd support at 40662 is characterized as a multi-swing low support. This adds to the support structure, indicating another potential zone where buying interest may be present, further reinforcing the potential for a bearish continuation.
On the resistance side, the 1st resistance at 44258 is associated with both a pullback resistance and the 100% Fibonacci Retracement. This confluence adds significance to the resistance, suggesting a potential area where selling interest may intensify, potentially causing a temporary pause or reversal in the weak bearish trend.
Furthermore, the 2nd resistance at 44240 is linked to the 127.20% Fibonacci Extension. This adds another layer of significance to the resistance, indicating another potential area where selling pressure may increase, especially considering the alignment with the Fibonacci-based extension level.
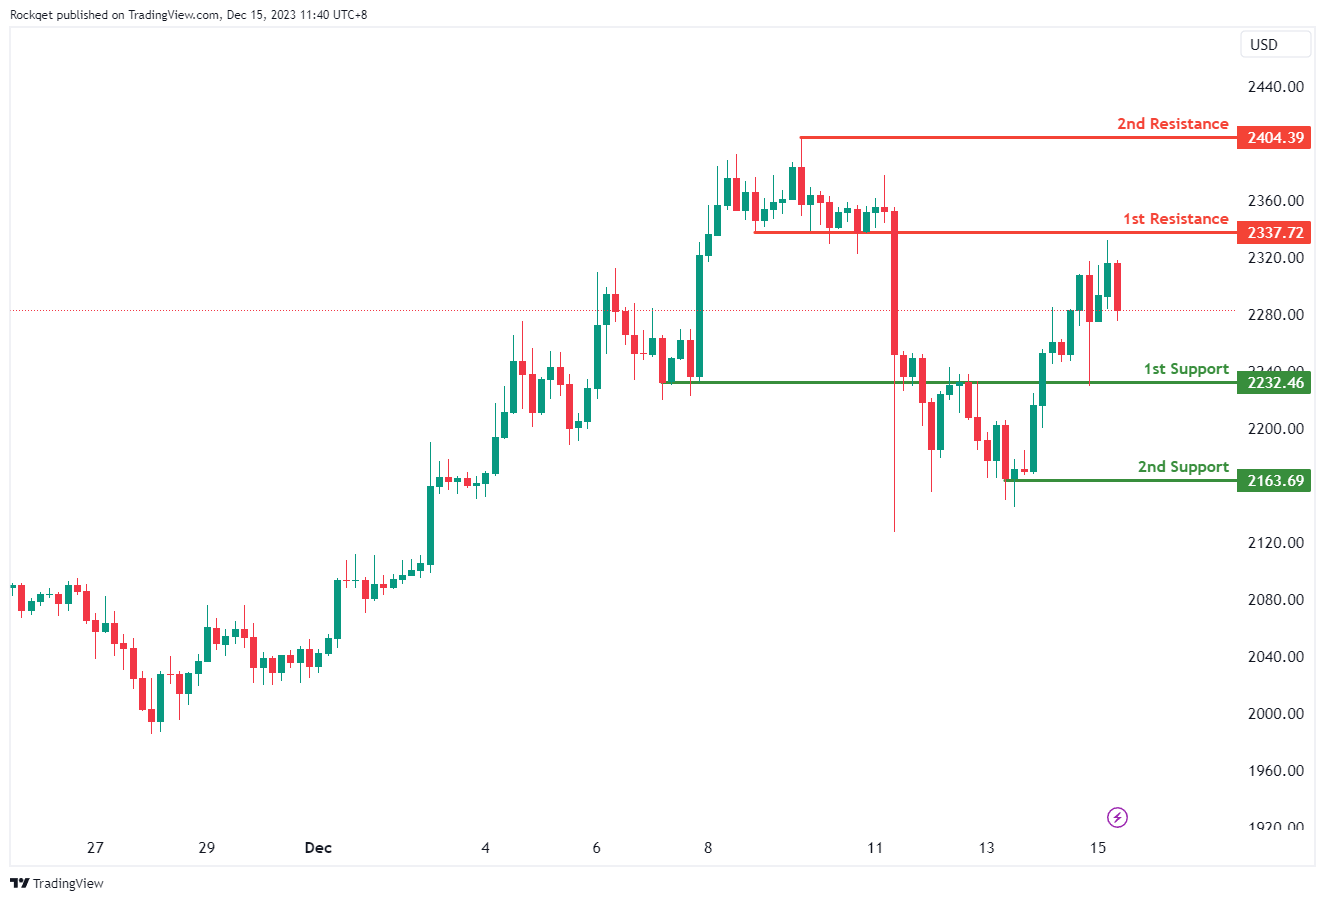
ETH/USD:
The ETH/USD chart currently displays a bullish overall momentum, suggesting a potential for a bullish continuation towards the 1st resistance.
The 1st support at 2232.46 is considered significant as it represents an overlap support. This level indicates a convergence of historical price points, reinforcing its potential as a crucial area where buying interest may emerge. The overlap support provides a strong foundation for a potential bounce or continuation of the bullish trend.
Similarly, the 2nd support at 2163.69 is identified as a pullback support. This level adds to the support structure, indicating another potential zone where buying interest may be present, further supporting the potential for a bullish continuation.
On the resistance side, the 1st resistance at 2337.72 is associated with a pullback resistance. This level may act as a barrier where selling interest could intensify, potentially causing a temporary pause or reversal in the bullish trend.
Furthermore, the 2nd resistance at 2404.39 is characterized as a swing high resistance. This level adds further significance to the resistance, suggesting a potential area where selling pressure may increase, especially considering its alignment with a previous swing high.
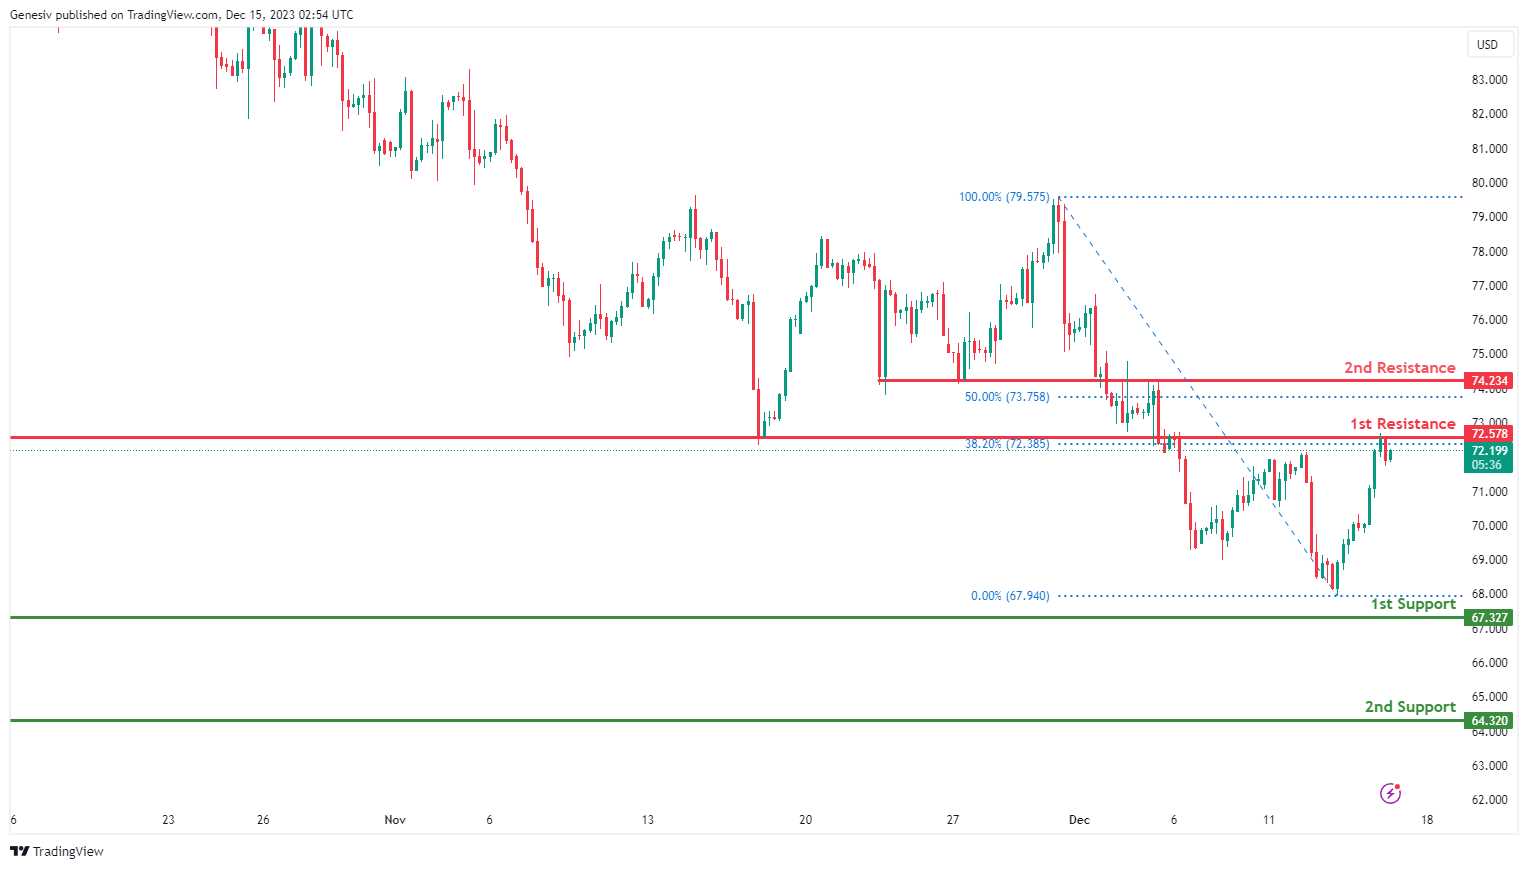
WTI/USD:
The WTI chart currently exhibits an overall bearish momentum, suggesting a prevailing downward trend. However, there is a potential for price to make a bullish movement towards the 1st resistance before resuming the downtrend and falling towards the 1st support.
The 1st resistance level at 72.57 is identified as an overlap resistance that aligns with the 38.20% Fibonacci retracement level. Higher up, the 2nd resistance level at 74.23 is also marked as an overlap resistance that aligns close to the 50.00% Fibonacci retracement level, further indicating its potential significance as a barrier for further upward movement.
To the downside, the 1st support level at 67.32 is identified as a pullback support. Further below, the 2nd support level at 64.32 is noted as multi-swing-low support, reinforcing its importance as a key support level.
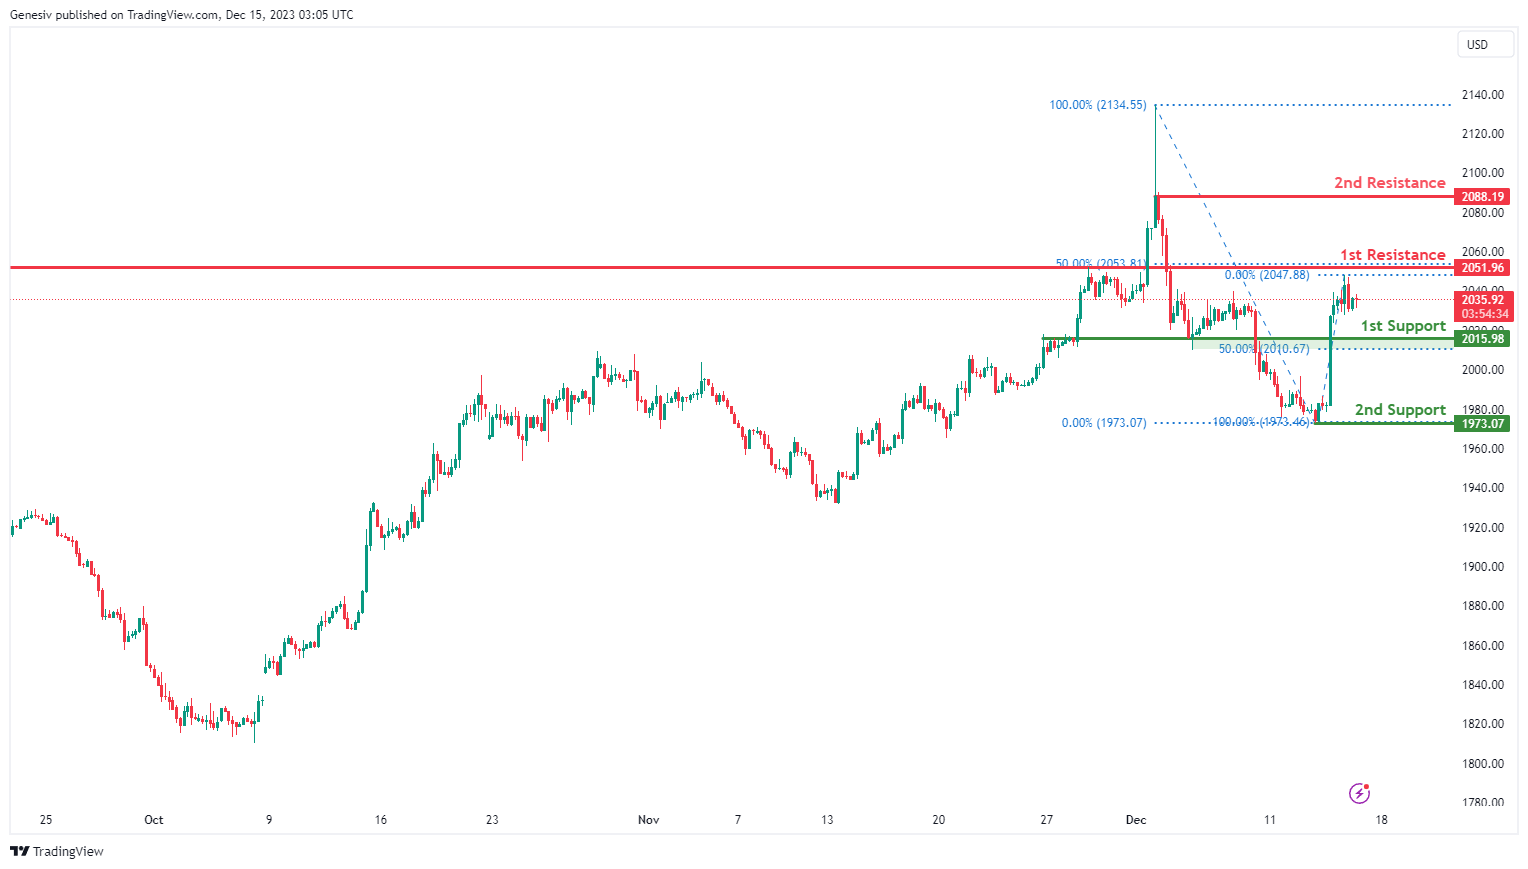
XAU/USD (GOLD):
The XAU/USD chart currently demonstrates a neutral momentum, indicating a potential for price to fluctuate between the 1st support and the 1st resistance.
The 1st support level at 2,015.98 is identified as an overlap support that aligns close to the 50.00% Fibonacci retracement level. Further below, the 2nd support level at 1,973.07 is noted as a swing-low support, reinforcing its importance as a key support level.
On the resistance side, the 1st resistance level at 2,051.96 is identified as a pullback resistance that aligns with the 50.00% Fibonacci retracement level. Higher up, the 2nd resistance level at 2,088.19 is marked as a swing-high resistance, further indicating its potential significance as a barrier for further upward movement.