Gold Builds Momentum While WTI Crude Oil Faces Renewed Selling Pressure

Gold price is consolidating above the $2,565 support zone. Crude oil is showing bearish signs and might decline below $96.50.

Important Takeaways for Gold and WTI Crude Oil Prices Analysis Today

  • Gold price started a recovery wave from $4,500 against the US Dollar.
  • It cleared a key bearish trend line with resistance at $4,620 on the hourly chart of gold at FXOpen.
  • Crude oil prices failed to clear the $108 region and started a fresh decline.
  •  There is a connecting bearish trend line forming with resistance at $100.45 on the hourly chart of XTI/USD at FXOpen.

Gold Price Technical Analysis

On the hourly chart of Gold at FXOpen, the price found bids near the $4,500 zone. The price remained in a bullish zone and started a recovery wave above $4,550.

There was a decent move above the 50-hour simple moving average and $4,600. The bulls pushed the price above the 50% Fib retracement level of the downward move from the $4,740 swing high to the $4,510 low.

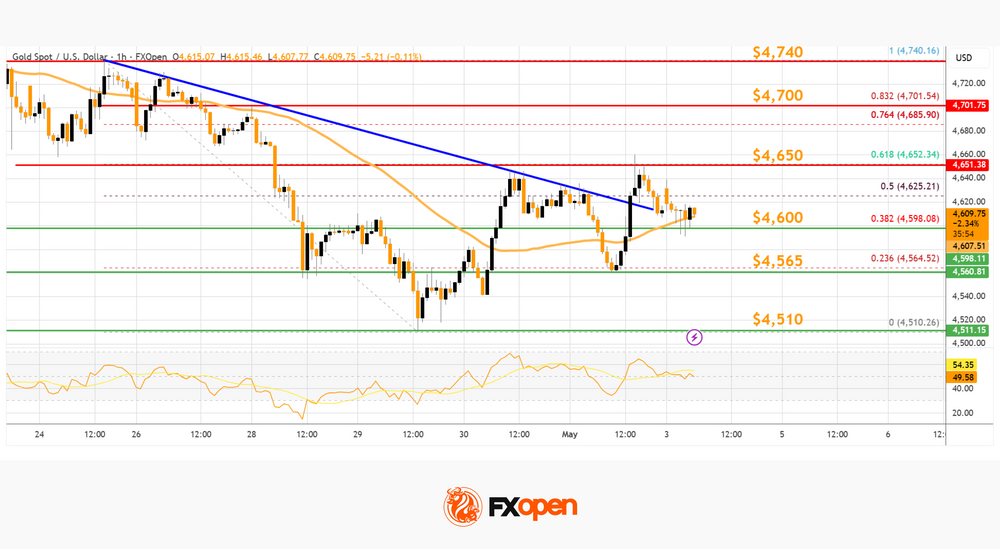
Besides, the price cleared a key bearish trend line with resistance at $4,620. Immediate hurdle is near the 61.8% Fib retracement at $4,650.

The next key breakout level sits at $4,700. An upside break above $4,700 could send Gold price toward $4,740. Any more gains may perhaps set the pace for an increase toward $4,850.

Initial bid zone on the downside could be $4,600. The first major buy zone sits at $4,565. If there is a downside break below $4,565, the price might decline further. In the stated case, the price might drop toward $4,510. Any more losses might push the price toward the $4,420 level.

WTI Crude Oil Price Technical Analysis

On the hourly chart of WTI Crude Oil at FXOpen, the price struggled to clear the $108 barrier against the US Dollar. The price started a fresh decline below $105.

The price even dipped below $100 and the 50-hour simple moving average. The bulls are now active near $96.00. A low was formed at $96.04, and the price is now consolidating losses. If there is a fresh increase, it could face sellers near the 23.6% Fib retracement level of the downward move from the $107.62 swing high to the $96.04 low.

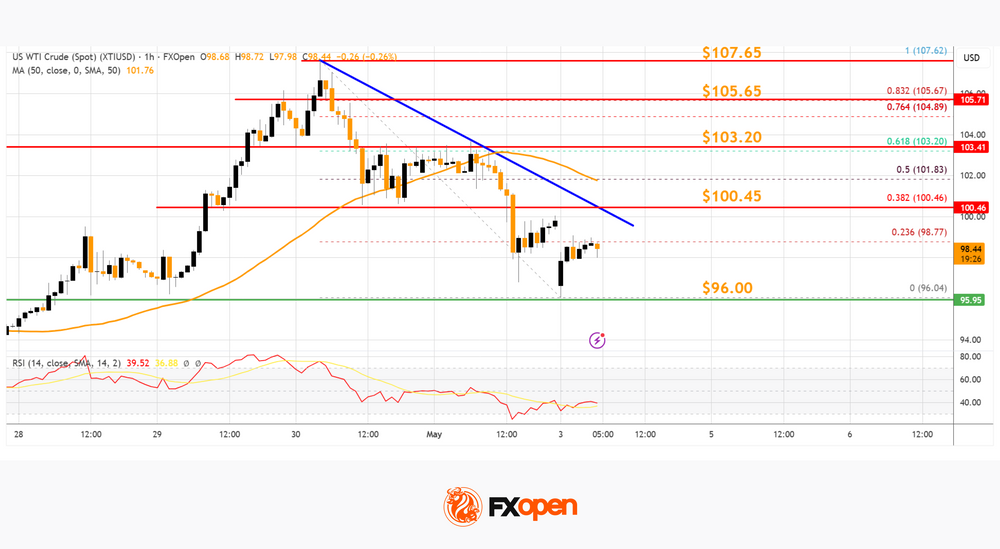
The first major hurdle for the bulls could be near a connecting bearish trend line at $100.45, above which the price could rise and test the 61.8% Fib retracement level at $103.20.

Any more gains might send the price toward $105.65. The main breakout zone sits at $108. Conversely, the price might continue to move down and revisit $96.00. The next major pivot zone on the WTI crude oil chart is $92.00.

If there is a downside break, the price might decline toward $90.00. Any more losses may perhaps open the doors for a move toward the $86.50 support zone.

FXOpen offers the world’s most popular cryptocurrency CFDs*, including Bitcoin and Ethereum. Floating spreads, 1:2 leverage — at your service (additional fees may apply). Open your trading account now or learn more about crypto CFD trading with FXOpen.

*Important: At FXOpen UK, Cryptocurrency trading via CFDs is only available to our Professional clients. They are not available for trading by Retail clients. To find out more information about how this may affect you, please get in touch with our team.

Start trading commodity CFDs with tight spreads (additional fees may apply). Open your trading account now or learn more about trading commodity CFDs with FXOpen.

This article represents the opinion of the Companies operating under the FXOpen brand only. It is not to be construed as an offer, solicitation, or recommendation with respect to products and services provided by the Companies operating under the FXOpen brand, nor is it to be considered financial advice.

Source link

Visited 1 times, 1 visit(s) today

Related Article

Gold Supported by Cautious Optimism

Gold Supported by Cautious Optimism

Gold is holding at around 4,611 USD per ounce on Monday as markets assess Donald Trump’s proposal to escort commercial vessels through the Strait of Hormuz, alongside tentative signs of progress in US–Iran negotiations. The plan involves assisting civilian ships from neutral countries in safely leaving the conflict zone and restoring access to the shipping

EUR/GBP Daily Outlook - ActionForex

EUR/GBP Daily Outlook – ActionForex

Daily Pivots: (S1) 0.8623; (P) 0.8632; (R1) 0.8645; More… Intraday bias in EUR/GBP is turned neutral first with current recovery. On the downside, decisive break of 0.8610 key support carry larger bearish implications and pave the way to 0.8466 fibonacci level next. However, firm break of 0.8652 will turn bias back to the upside for

USD/CHF Daily Outlook - ActionForex

USD/CHF Daily Outlook – ActionForex

Daily Pivots: (S1) 0.7787; (P) 0.7810; (R1) 0.7841; More…. Intraday bias in USD/CHF stays mildly on the downside for 0.7774 and then 61.8% projection of 0.8041 to 0.7774 from 0.7923 at 0.7758. Firm break there will extend the fall from 0.8041 to 100% projection at 0.7656. On the upside, above 0.7829 minor resistance will turn

Table of prices NASDAQ 100 03/05/2026

Weekly Pairs in Focus 3rd to 8th May 2026 (Charts)

NASDAQ 100 The week has been very good to the NASDAQ 100 yet again and as we look forward the question now is whether or not we can continue to break out to the upside. After all, this is a market that I think continues to see a lot of volatility and a lot of

Byo man fined US$200 for illegal forex trading

Dalyn Chigwizura Court Reporter A 20-YEAR-OLD Bulawayo man has been fined US$200 or six months in prison after he was caught illegally dealing in foreign currency during a police operation targeting illicit financial activities. Mitchel Noah of Pumula South suburb was convicted on his own plea of guilty to contravening provisions of the Exchange Control

USD/JPY: The Intervention Aftermath, Has BoJ Bought Time or Reversed Trend?

USD/JPY: The Intervention Aftermath, Has BoJ Bought Time or Reversed Trend?

The Ministry of Finance (MoF) intervened on April 30 and May 1, 2026, after the USD/JPY pair breached the critical 160.00 level. The aggressive yen-buying action, estimated to be over $30 billion, triggered a sharp 2.2% rally in the yen, driving the pair down toward the 156.00 range. Historical precedent from the 2024 intervention suggests

EUR/USD Eyes Gains As USD/CHF Weakness Deepens Again

EUR/USD Eyes Gains As USD/CHF Weakness Deepens Again

EUR/USD started a fresh increase above 1.1700 and 1.1720. USD/CHF declined further and is now struggling below 0.7835. Important Takeaways for EUR/USD and USD/CHF Analysis Today The Euro started a decent increase from 1.1650 against the US Dollar. There was a break above a bearish trend line with resistance at 1.1685 on the hourly chart

Dow Jones Nears 50,000! Will Stock Market Bulls Ever be Defeated?

Dow Jones Nears 50,000! Will Stock Market Bulls Ever be Defeated?

US Stock Markets are continuing their breakouts to ever-fresher highs, but short-term profit-taking seems to be ruining the party The Dow Jones could retake 50,000 in today’s session barring no weekend-safety trading Exploring Technical Levels for the Dow Jones, Nasdaq and S&P 500 US Stock Markets have been on a rampage after this week’s earnings,

EUR/USD Weekly Outlook - ActionForex

EUR/USD Weekly Outlook – ActionForex

EUR/USD rebounded after initial dip to 1.1653 last week, but stayed in range below 1.1848. Initial bias remains neutral this week first. Rise from 1.1408 is extended to continue as long as 1.1642 support holds. Firm break of 1.1848 will target 1.2081 high next. However, firm break of 1.1662 support will indicate the the rebound

USD/CHF Mid-Day Outlook - ActionForex

USD/CHF Mid-Day Outlook – ActionForex

Daily Pivots: (S1) 0.7773; (P) 0.7848; (R1) 0.7891; More…. Intraday bias in USD/CHF remains on the downside for 0.7774 and then 61.8% projection of 0.8041 to 0.7774 from 0.7923 at 0.7758. Firm break there will target 100% projection at 0.7656. On the upside, above 0.7829 minor resistance will turn intraday bias neutral first. But risk

GBP/JPY Mid-Day Outlook - ActionForex

GBP/JPY Mid-Day Outlook – ActionForex

Daily Pivots: (S1) 215.64; (P) 215.97; (R1) 216.52; More… GBP/JPY’s steep decline and strong break of 55 D EMA today suggests that a medium term top was already formed at 216.58, on bearish divergence condition in D MACD. While deeper fall cannot be ruled out, strong support should emerge from 209.58 to bring rebound, at

Japanese FX intervention wipes out yen’s Iran war losses

Bird’s-eye view of central Tokyo including Tokyo Tower at sunrise hours. Vladimir Zakharov | Moment | Getty Images The Japanese yen surged against the dollar on Friday, extending gains that came the previous day after officials in Tokyo said they stood ready to intervene in the foreign exchange market. Friday saw the Japanese currency rise

GBP/USD Defends Support, Focus Shifts To US GDP And BOE

GBP/USD Defends Support, Focus Shifts To US GDP And BOE

Key Highlights GBP/USD corrected gains and tested the 1.3450 support. A declining channel is forming with resistance at 1.3560 on the 4-hour chart. Gold prices are moving lower below the $4,650 support. The US GDP could grow by 2.3% in Q1 2026 (Preliminary). GBP/USD Technical Analysis The British Pound started a downside correction from 1.3600

USD/JPY Daily Outlook - ActionForex

USD/JPY Daily Outlook – ActionForex

Daily Pivots: (S1) 159.79; (P) 160.14; (R1) 160.79; More… USD/JPY’s break of 160.45 resistance confirms resumption of rally from 152.25. Intraday bias is on the upside for retesting 161.94 high. Decisive break there will target 61.8% projection of 139.87 to 159.44 from 152.25 at 164.34 next. On the downside, below 159.83 minor support will turn

EUR/USD Daily Outlook - ActionForex

EUR/USD Daily Outlook – ActionForex

Daily Pivots: (S1) 1.1650; (P) 1.1687; (R1) 1.1713; More…. Intraday bias in EUR/USD stays neutral for the moment. On the upside, sustained trading above 61.8% retracement of 1.2081 to 1.1408 at 1.1824 will pave the way to retest 1.2081 high. However, firm break of 1.1642 support will indicate the the rebound from 1.1408 has completed,

iFOREX revenues fall 2% to $49M in 2025, posts $3M loss as IPO costs hit

iFOREX revenues fall 2% to $49M in 2025, posts $3M loss as IPO costs hit

Confirming our report at the time of its IPO back in February, Retail FX and CFDs broker iFOREX Financial Trading Holdings Ltd (LON:IFRX) has released its 2025 results, showing fairly flat growth in the year, while non-recurring IPO costs led to a net loss for the company. iFOREX 2025 results In its IPO prospectus iFOREX

EUR/USD Monthly Forex Forecast May 2026

EUR/USD Monthly Forex Forecast May 2026

Created on April 30, 2026 The 1.17000 realm in the EUR/USD is a battlefield as of this writing. The EUR/USD which began the month of April near the 1.15620 vicinity went higher as financial institutions digested some of the concerns they had about the Iranian war, yet clarity near-term remains nervous. A high of around

0
Would love your thoughts, please comment.x
()
x