Petrodollar Trade is Over, Dollar Tumbles – EUR/USD, AUD/USD & Dollar Index (DXY) Overview

The US Dollar has seen its best days throughout the last two months, with the infamous Petrodollar trade grabbing all the attention from Market participants and flows.

Crude Oil prices, denominated and traded in US Dollars, rose by close to 100% from mid-February to just yesterday, amid a historic and brutal conflict in the Middle East.

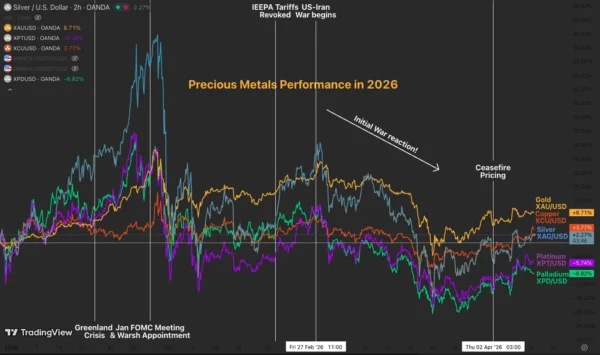
A 6-week-long operation led by the US and Israeli armies against the Islamic regime of Iran completely changed the geopolitical picture, which in turn affected Markets in a striking manner.

The de facto closure of the Strait of Hormuz, which facilitates the movement of close to 20% of global Energy commodity flows, has completely rocked inflation expectations and, for the regular Economy and all its participants, prices at the pump.

With much higher petrol prices, entire regions, particularly those dependent on Middle Eastern oil, had to race to hedge against the risk of shortages, and, by doing so, convert their currencies to the US Dollar, which created its own self-fulfilling prophecy.

Add to it pre-existing short-positioning, and a Fed that was starting to get priced for rate hikes as Inflation expectations exploded, and the cocktail for the Greenback was a profitable one.

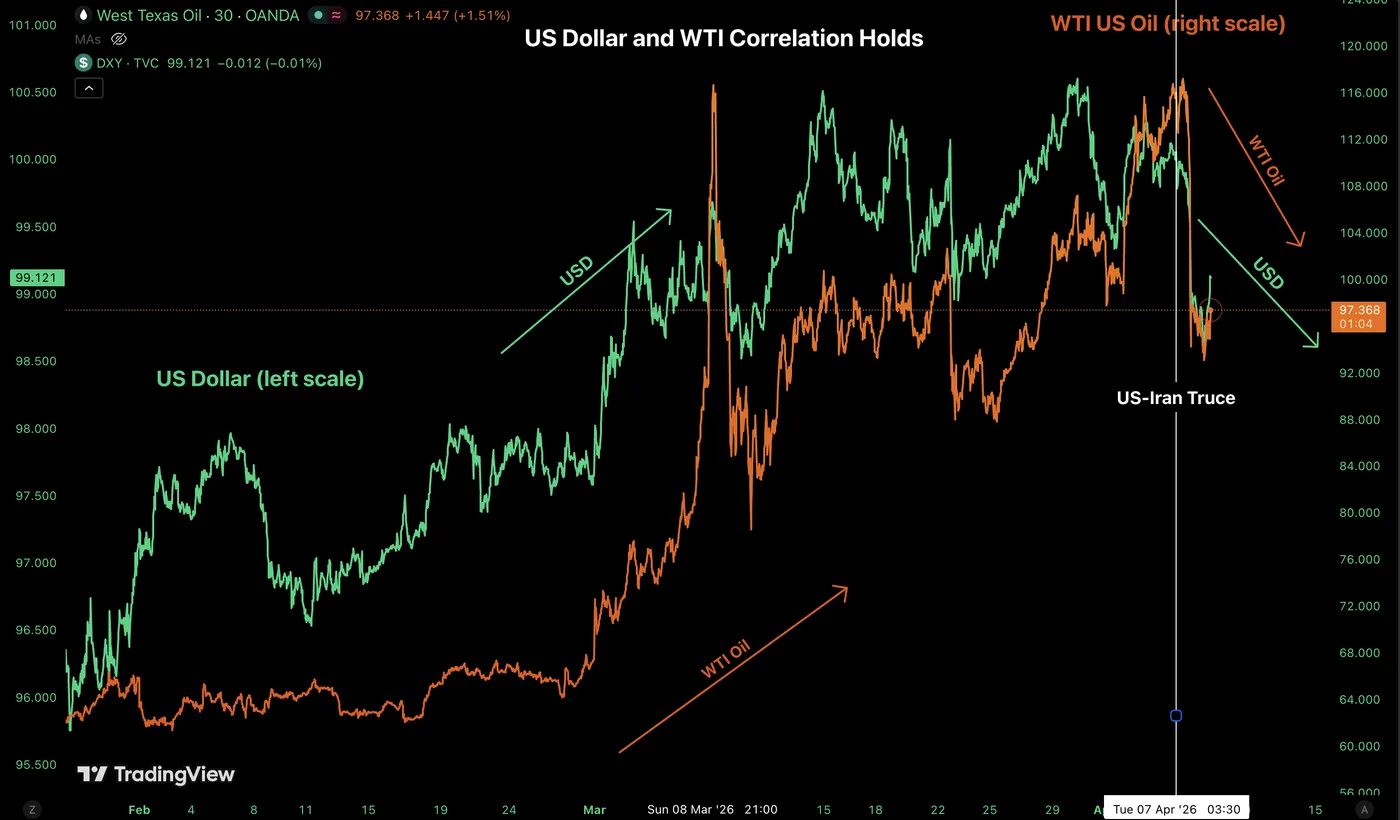
The Petrodollar trade – Oil and US Dollar Correlation. Source: TradingView. April 8, 2026

However, since yesterday evening, the situation has taken quite an unexpected turn. Markets were slowly pricing the potential for a truce, with US pressure to reach a ceasefire extending, but less than 36 hours before the headline, Iran had just rejected a US proposition.

Yet, the pressure from the Trump Administration actually worked, and the two sides reached a deal, albeit still quite a foggy one for now.

The prior ease in tone had formed a double top in the Dollar Index, but the lack of progress in the situation had kept angst high in the currency Markets.

However, yesterday’s Ceasefire headline brought the hammer to the US Dollar.

After the news, the Dollar lost close to a percentage point against most of its FX peers, and has boarded a similar move in today’s action.

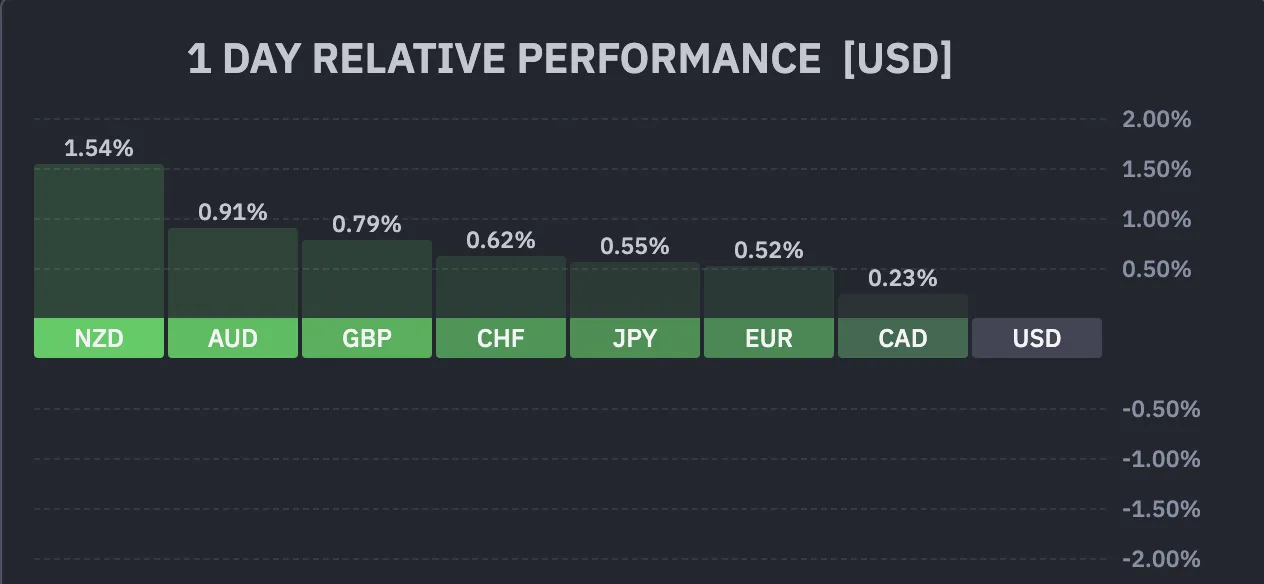
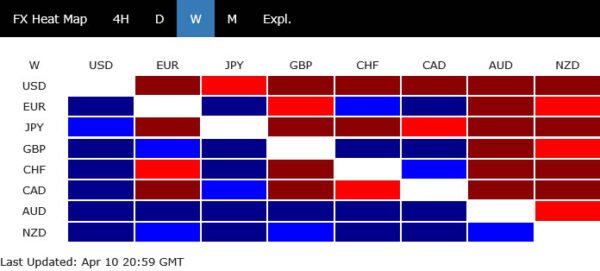
Current Session’s FX Performance – Courtesy of Finviz. April 8, 2026

A short-term pullback has emerged in the past few hours, but the uptrend from the past months has taken a decisive turn.

We will look at the Dollar Index, EUR/USD, and AUD/USD to assess the current state of the Market and whether the Dollar will actually suffer from the latest geopolitical truce.

Dollar Index 4H Chart

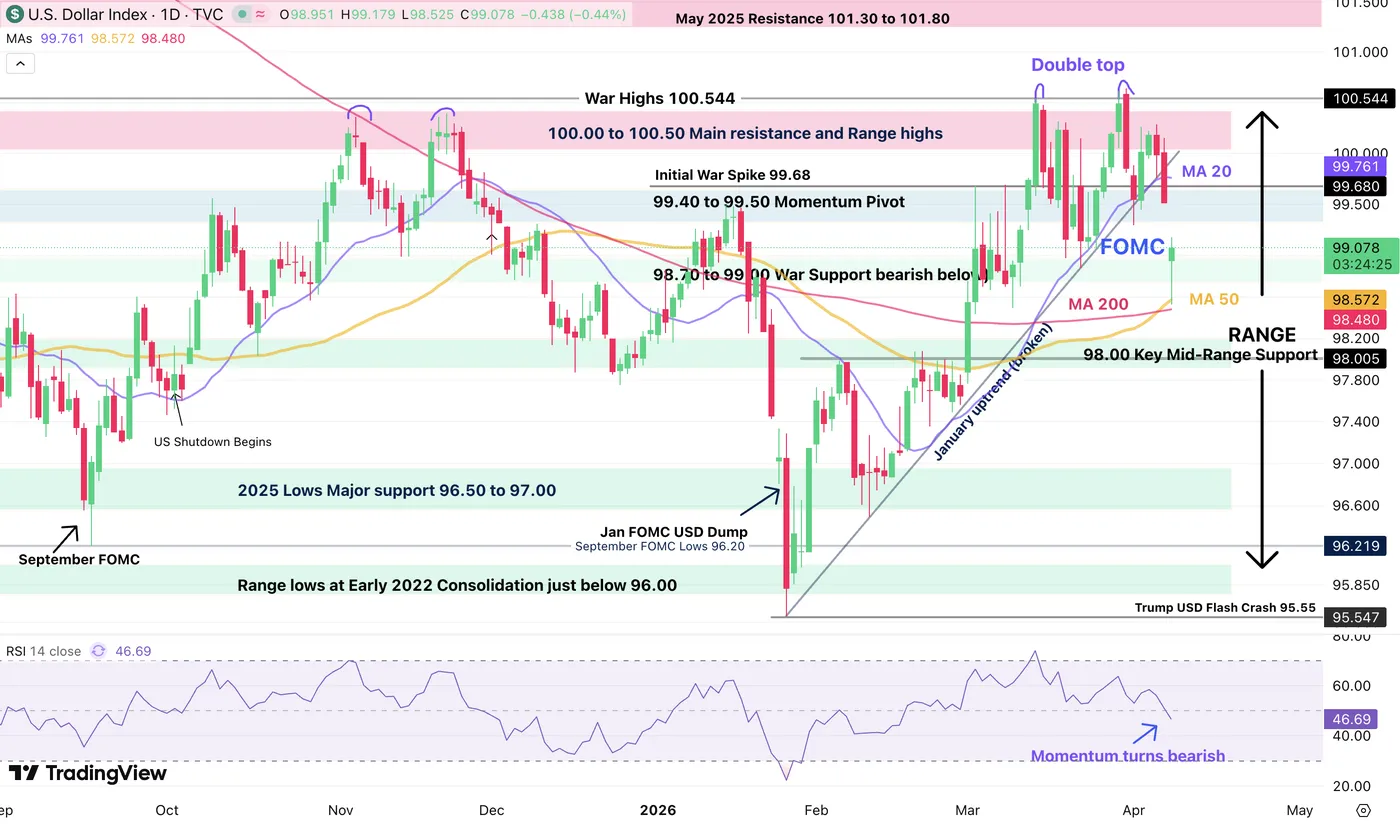
Dollar Index Daily Chart, April 8, 2026 – Source: TradingView

The US Dollar has officially broken its January uptrend after today’s gap lower in the Dollar Index.

After forming a double top in recent action, sellers have now officially taken control by breaking the 20-Day Moving average (99.75), but stalled at the quintessential 98.70 – 99.00 War Support.

With WTI correcting higher, the USD is following suit, but this for now only hints at a pullback from oversold conditions (in shorter timeframes) – The counter move has now stalled; any continuation higher should stall around 99.50 (Gap fill) and this would offer optimal entries on Dollar shorts.

Levels of interest for the Dollar Index:

Resistance Levels

  • 99.40 to 99.50 Momentum Pivot (and Gap Fill level)
  • Initial War Spike 99.68
  • Weekly range highs 100.00
  • 100.00 to 100.50 Main Resistance Zone
  • War Highs 100.544

Support Levels

  • 98.70 to 99.00 Support (War support)
  • 98.57 50 and 200 4H MA (recent lows)
  • 98.00 2025 Support
  • Support 97.40 to 97.60
  • 2025 Lows 96.40 to 96.80 Support

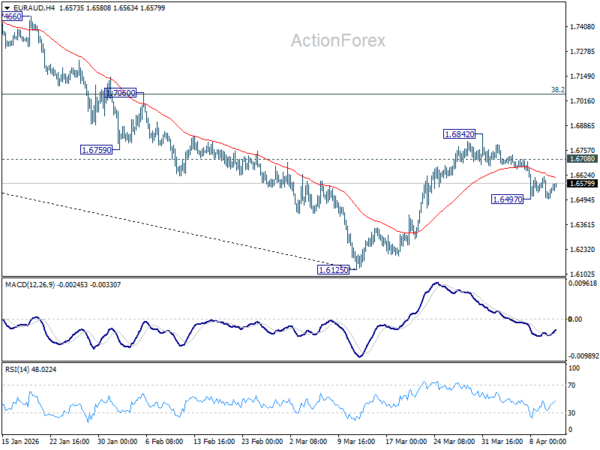
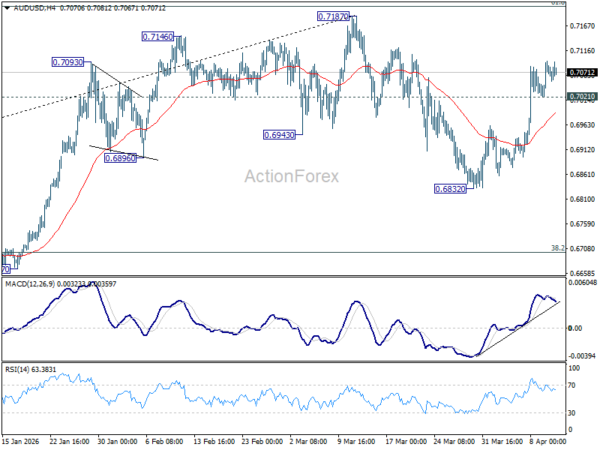
AUD/USD 4H Chart and Technical Levels

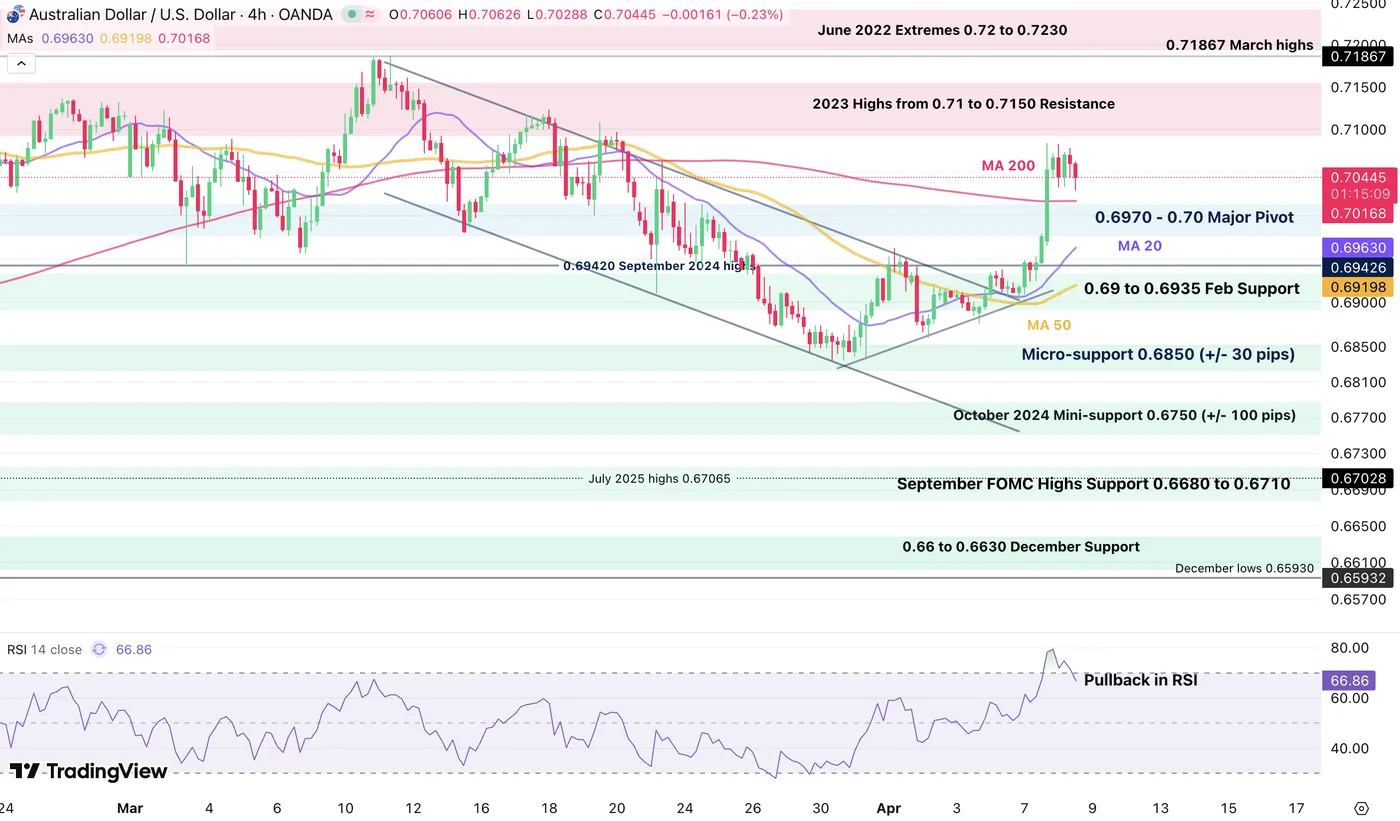
AUD/USD 4H Chart, April 8, 2026 – Source: TradingView

AUD/USD largely reversed its mid-March tumble lower, stalling around its 0.618% Fibonacci level (0.7080).

With a short-term pullback in the US Dollar, AUD/USD bulls could take the advantage again when the RSI eases enough as long as the narrative does not turn again.

The 4H 200-period MA could provide an interesting entry point (0.70170).

Levels of interest for AUD/USD:

Resistance Levels

  • 0.7080 rebound highs
  • 2023 Highs from 0.71 to 0.7150 Resistance
  • 0.71867 March highs
  • June 2022 Extremes 0.72 to 0.7230

Support Levels

  • 4H 200-period MA – 0.70170
  • 0.6970 – 0.70 Major Pivot
  • 0.69 to 0.6935 Early Feb Support
  • 0.68340 War lows
  • Micro-support 0.6850 (+/- 30 pips)
  • October 2024 Mini-support 0.6750 (+/- 100 pips)

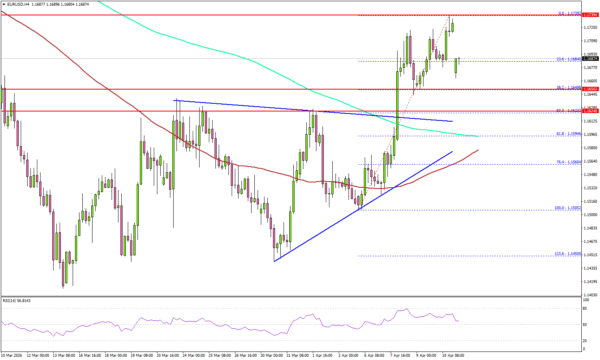
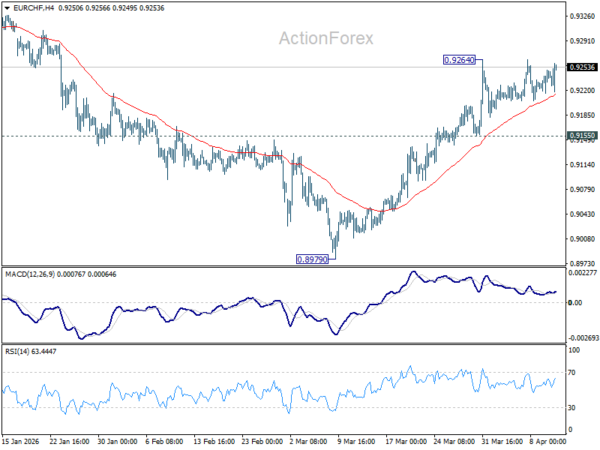
EUR/USD 4H Chart and Technical Levels

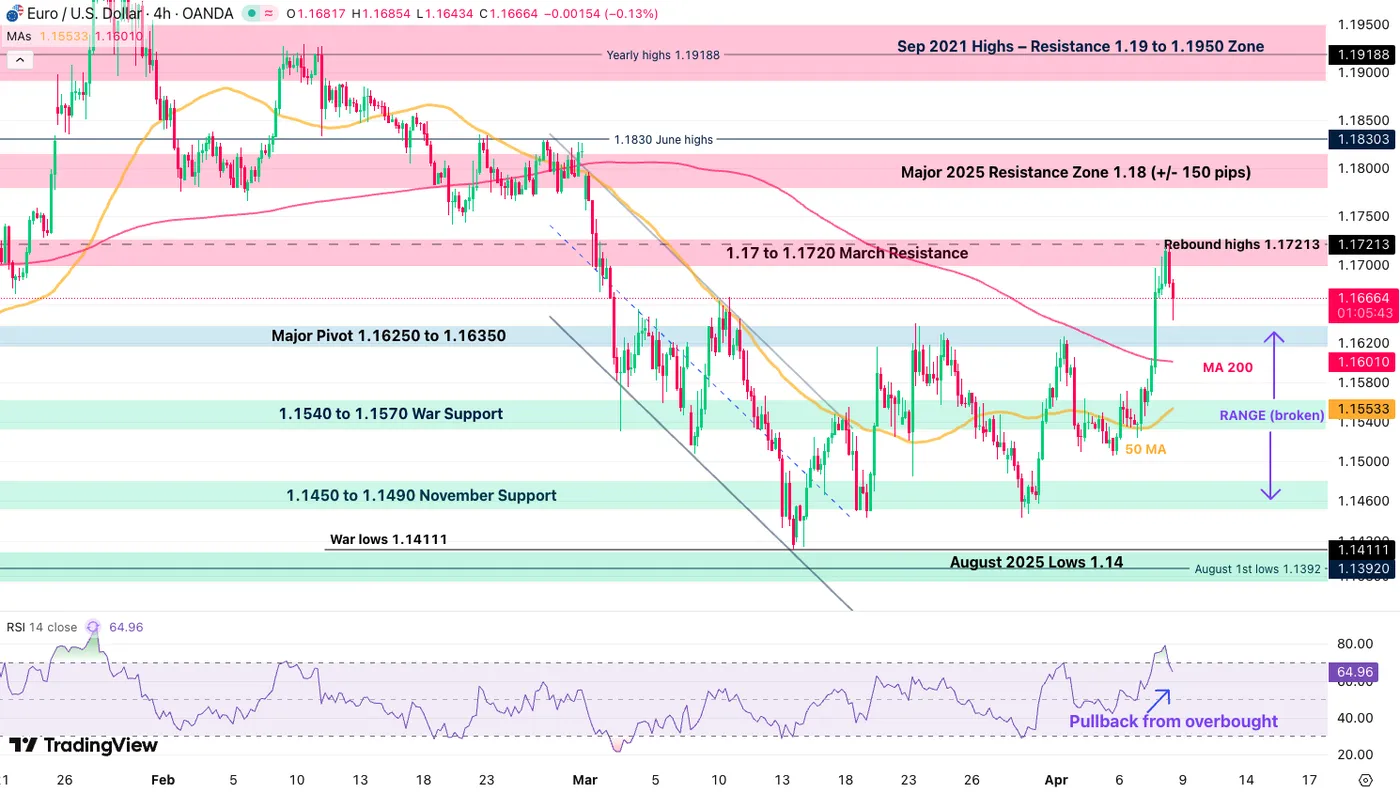
EUR/USD 4H Chart, April 8, 2026 – Source: TradingView

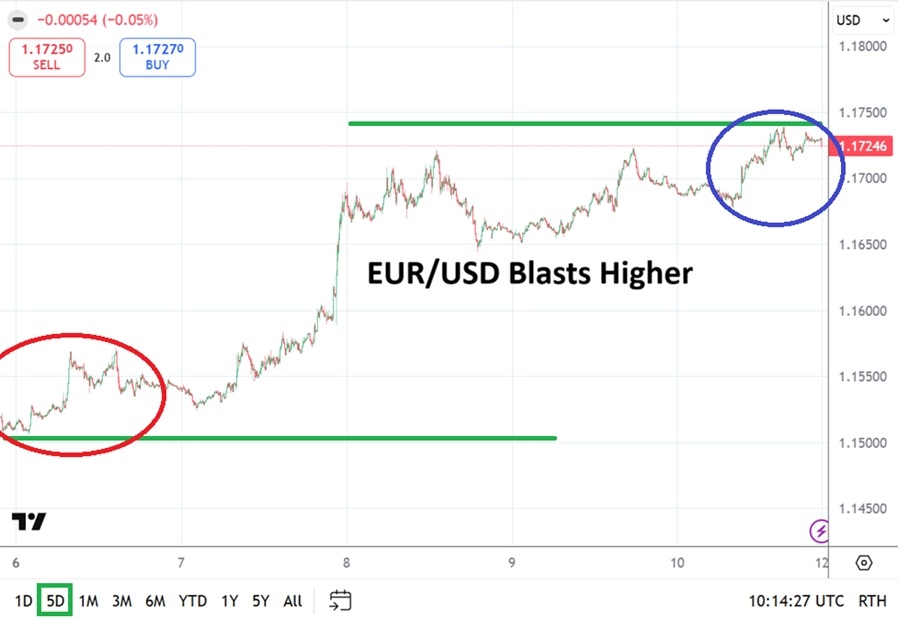
EUR/USD has officially broken its 1.14 to 1.16 War consolidation zone, and will look to confirm the breakout.

Retesting and rejecting the Major Pivot zone would guarantee a stronger phase ahead for the most popular FX pair.

Levels to place on your EUR/USD charts:

Resistance Levels

  • 1.17 to 1.1720 March Resistance
  • Rebound highs 1.17213
  • Resistance Zone around 1.18 (+/- 150 pips)
  • 1.1830 June 2025 highs
  • Sep 2021 Highs – Resistance 1.19 to 1.1950 Zone

Support Levels

  • Major Pivot 1.16250 to 1.16350
  • 1.1540 to 1.1570 War Support
  • 1.1475 to 1.15 November Support
  • War lows 1.1410

Safe Trades and keep a close eye on Ceasefire news!

Source link

Visited 1 times, 1 visit(s) today

Related Article

EUR/JPY Daily Outlook - ActionForex

EUR/JPY Daily Outlook – ActionForex

Daily Pivots: (S1) 186.16; (P) 186.53; (R1) 187.13; More… Intraday bias in EUR/JPY remains on the upside for the moment. Long term up trend is resuming and should target 161.8% projection of 180.78 to 184.75 from 182.56 at 188.98 next. On the downside, below 185.88 minor support will turn intraday bias neutral first. But near

USD/CAD Daily Outlook - ActionForex

USD/CAD Daily Outlook – ActionForex

Daily Pivots: (S1) 1.3813; (P) 1.3830; (R1) 1.3860; More… USD/CAD recovered notably today but stays well below 1.3965 resistance. Intraday bias remains neutral first. Consolidations could extend and another dip might be seen. But outlook will stay bullish as long as 38.2% retracement of 1.3840 to 1.3965 at 1.3780 holds. On the upside, firm break

EUR/USD Strengthens Further, Bulls Eye Continued Upside

EUR/USD Strengthens Further, Bulls Eye Continued Upside

Key Highlights EUR/USD started a fresh increase above 1.1650. It cleared a key contracting triangle with resistance at 1.1610 on the 4-hour chart. GBP/USD could extend gains if it settles above 1.3500. WTI Crude Oil prices are again moving higher toward $112. EUR/USD Technical Analysis The Euro remained supported above 1.1500 against the US Dollar.

EUR/USD Forex Forecast 12/04

EUR/USD Forex Forecast 12/04

Created on April 12, 2026 Speculators who were on the correct side of the rocket blast higher in the EUR/USD on Tuesday of this past week were hopefully able to cash in profits. For those who held onto the EUR/USD going into this weekend with the currency pair now traversing around the 1.17250 ratio, things

EUR/CHF Weekly Outlook - ActionForex

EUR/CHF Weekly Outlook – ActionForex

EUR/CHF stayed in sideway trading below 0.9264 last week and outlook is unchanged. Initial bias remains neutral first, and further rise is expected with 0.9155 support intact. Firm break of 0.9264 will resume the rebound from 0.8979 to 0.9394 resistance next. However, break of 0.9155 will turn bias back to the downside for deeper pullback.

EUR/AUD Weekly Outlook - ActionForex

EUR/AUD Weekly Outlook – ActionForex

EUR/AUD’s extended pullback last week suggests that rebound from 1.6125 has completed at 1.6842, after rejection by 55 D EMA (now at 1.6720). But as a temporary low as formed at 1.6497, initial bias is turned neutral this week first. On the downside, break of 1.6497 will target a retest on 1.6125 low. Nevertheless, firm

NYSE:DBD 1-Year Stock Price Chart

Diebold Nixdorf Index Additions And Nordic FOREX Deal Shift Valuation Context

Never miss an important update on your stock portfolio and cut through the noise. Over 7 million investors trust Simply Wall St to stay informed where it matters for FREE. Diebold Nixdorf (NYSE:DBD) has been added to the S&P SmallCap 600, S&P Composite 1500, S&P 1000, and S&P 600 Information Technology indices. The index changes

EUR/GBP Weekly Outlook - ActionForex

EUR/GBP Weekly Outlook – ActionForex

EUR/GBP stayed in range trading below 0.8740 last week and outlook is unchanged. Initial bias stays neutral this week first. Further rise is mildly in favor as long as 0.8675 support holds. Break of 0.8740 will resume the rebound from 0.8610 to 0.8788 resistance. However, firm break of 0.8675 will turn bias back to the

EUR/JPY Weekly Outlook - ActionForex

EUR/JPY Weekly Outlook – ActionForex

EUR/JPY’s strong rally last week and breach of 186.86 high suggests that long term up trend is resuming. Initial bias remains on the upside this week. Next near term target is 161.8% projection of 180.78 to 184.75 from 182.56 at 188.98. On the downside, below 185.88 minor support will turn intraday bias neutral first. But

USD/CAD Weekly Outlook - ActionForex

USD/CAD Weekly Outlook – ActionForex

USD/CAD’s pullback from 1.3965 extended lower last week but downside is contained above 38.2% retracement of 1.3840 to 1.3965 at 1.3780. Initial bias stays neutral and further rise remains in favor. On the upside, firm break of 1.3965 will resume the rise from 1.3480. However, sustained break of 1.3780 will argue that the rebound from

USD/CHF Weekly Outlook - ActionForex

USD/CHF Weekly Outlook – ActionForex

USD/CHF extended the pullback from 0.8041 short term top, but failed to sustain below 0.7877 cluster support (38.2% retracement of 0.7603 to 0.8041 at 0.7874). With 4H MACD crossed above signal line, initial bias is turned neutral first. On the downside, sustained trading below 0.7874/7 will argue that the rise from 0.7603 has completed, and

USD/JPY Weekly Outlook - ActionForex

USD/JPY Weekly Outlook – ActionForex

USD/JPY stayed in consolidations below 160.45 short term top last week and outlook is unchanged. Initial bias remains neutral first and further rise is expected with 157.49 cluster support (38.2% retracement of 152.25 to 160.45 at 157.31) intact. On the upside break of 160.45 will target a retest on 161.94 high. However, firm break of

EUR/USD Weekly Outlook - ActionForex

EUR/USD Weekly Outlook – ActionForex

EUR/USD’s extended rebound last week suggests that correction from 1.2081 has already completed at 1.1408. Initial bias stays on the upside this week for 61.8% retracement of 1.2081 to 1.1408 at 1.1824. Decisive break there will pave the way to retest 1.2081 high. On the downside, below 1.1642 minor support will turn intraday bias neutral

AUD/USD Weekly Report - ActionForex

AUD/USD Weekly Report – ActionForex

AUD/USD’s strong rebound last week suggests that pullback from 0.7187 has completed at 0.6832 already. Initial bias stays mildly on upside this week for retesting 0.7187. Strong resistance could be seen there to bring another fall to extend the near term corrective pattern. On the downside, below 0.7021 minor support will turn intraday bias neutral

Canada’s Auto Sector to Show Rebound Amid Mixed Home Resales

Canada’s Auto Sector to Show Rebound Amid Mixed Home Resales

It’s a relatively quiet week for Canadian data releases with attention focused on February’s manufacturing and wholesale trade reports on Wednesday. Advance estimates from Statistics Canada pointed to rebounds in both wholesale sales (excluding petroleum and agricultural products) up 2.3%, while manufacturing sales jumped 3.8% in February, supported by higher sales in the transportation subsector

Youtube preview

More to come? Crude pricing on Iran ceasefire talks [Video]

In today’s Market Outlook, let’s take a look at Forex Trading on NZDUSD, GBPUSD, Gold, XAUUSD, Silver, XAGUSD, Brent Crude Oil, WTI, the Nikkei225, the FTSE100, the DAX40, the NASDAQ, and the S&P500. From a technical point of view, we see all the US indices with inverted hammer and bullish engulfing candles, and we had

0
Would love your thoughts, please comment.x
()
x