Gold Analysis 13/01: Record-Breaking Rallies (Chart)

Today’s Gold Analysis Overview:

  • The overall Gold Trend: Strongly bullish.
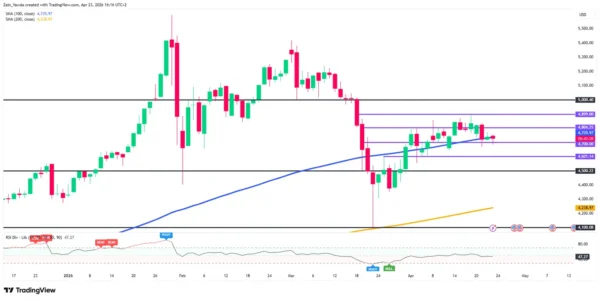
  • Today’s Gold Support Points: $4560 – $4490 – $4330 per ounce.
  • Today’s Gold Resistance Points: $4660 – $4710 – $4780 per ounce.

Gold Analysis 13/01: Record-Breaking Rallies (Chart)

Today’s Gold Trading Signals:

  • Sell gold from the resistance level of $4670 with a target of $4350 and a stop-loss at $4700.
  • Buy gold from the support level of $4440 with a target of $4700 and a stop-loss at $4400.

Technical Analysis of Gold Price (XAU/USD) Today:

The record-breaking upward trajectory for spot gold prices shows no signs of stopping. At the start of this critical trading week, gold surged to the $4,630 resistance level, marking the highest point in the history of the gold market. According to performance across major trading platforms, “Yellow Metal” remains poised for further record breakouts. As previously noted, global tensions continue to drive demand for gold as a safe haven, bolstered by market pessimism regarding U.S. Federal Reserve policies and the situation involving Fed officials led by Jerome Powell.

Jerome Powell’s Future as a Catalyst for Gold market

According to reliable trading platforms. Gold/US Dollar (XAU/USD) prices surged to a record high, surpassing $4,600 per ounce, as the criminal investigation into Federal Reserve Chairman Jerome Powell revived concerns about the independence of the US central bank. Meanwhile, protests in Iran boosted demand for safe-haven assets, particularly gold.

Among the latest US developments supporting the gold market was the launch of a criminal investigation into Powell regarding his testimony this summer about the Federal Reserve’s renovated headquarters. This led to a decline in the US dollar. The dollar index (DXY), which measures the value of the US currency against a basket of other major currencies, fell 0.5% to 98.67.

According to currency traders, the US dollar index recorded its worst decline in three weeks due to concerns that the White House is undermining the Federal Reserve’s independence by filling the Federal Open Market Committee (FOMC) with highly dovish members. This risk stands in stark contrast to current expectations of only two US interest rate cuts by the end of 2026.

According to market observers, gold is increasingly seen as an alternative to fiat currencies—government currencies like the dollar and the euro—as rising public debt and anticipated pressure on the US Federal Reserve fuel interest in what is known as currency devaluation trading. Gold’s appeal has also been bolstered by escalating geopolitical uncertainty. The US arrest of Venezuelan leader Nicolás Maduro and ongoing protests in Iran have reinforced the precious metal’s status as a safe haven. According to US officials, President Trump is scheduled to be briefed on Tuesday regarding options for responding to Tehran, including sanctions, cyber weapons, and military strikes.

Overall, these recent gains reinforce the strong performance of the gold index seen last year, fueled by US interest rate cuts, central bank purchases, and significant inflows into exchange-traded funds (ETFs). Investors are now awaiting upcoming US economic data and political signals for indications of whether this rally can be sustained.

According to commodity market experts, the magnitude and speed of the rise in gold and silver prices are remarkable, leading many seasoned metals market players to question the sustainability of this upward trend. In general, the price of gold is steadily climbing towards the psychological resistance level of $5,000 per ounce and may even be doing so faster than anticipated before the start of 2026.

Trading Advice:

Traders advise buying gold on every technical bearish correction rather than risking a purchase at all-time highs. Monitor market-moving factors closely, as any cooling of tensions could trigger profit-taking selloffs at any time.

Ready to trade our Gold daily analysis and predictions? We’ve made a list of the best Gold trading platforms worth trading with.

Source link

Visited 1 times, 1 visit(s) today

Related Article

RMB hiking play in forex options mkt

RMB hiking play in forex options mkt

A billboard in Shanghai displays renminbi”s foreign exchange rates. China Daily The renminbi’s rising prominence in global foreign exchange options is not an isolated development, but part of a broader, accelerating expansion of the Chinese currency’s international role across investment, financing and commodity pricing, analysts said. According to the London-based clearing house LCH, the yuan

EUR/CHF Weekly Outlook - ActionForex

EUR/CHF Weekly Outlook – ActionForex

EUR/CHF edged lower to 0.9159 last week but recovered just ahead of 0.9155 support. Outlook is unchanged and initial bias remains neutral this week for more consolidations below 0.9264. Further rally is expected with 0.9155 support intact. On the upside, firm break of 0.9264 will resume the rise from 0.8979 to 0.9394 resistance next. However,

EUR/GBP Weekly Outlook - ActionForex

EUR/GBP Weekly Outlook – ActionForex

EUR/GBP’s extended decline last week suggests that rebound from 0.8610 has completed at 0.8740 already. But as a temporary low was formed at 0.8652, initial bias stays neutral this week first. On the downside, below 0.8652 will resume the fall from 0.8740 to retest 0.8610 support next. Nevertheless, firm break of 0.8685 support turned resistance

EUR/JPY Weekly Outlook - ActionForex

EUR/JPY Weekly Outlook – ActionForex

EUR/JPY stayed in sideway trading last week and the development suggests that it’s merely in a near term consolidations. Initial bias remains neutral this week first. In case of another fall, downside should be contained by 38.2% retracement of 182.56 to 187.93 at 185.87 to bring rebound. On the upside, firm break of 187.93 will

USD/CAD Weekly Outlook - ActionForex

USD/CAD Weekly Outlook – ActionForex

USD/CAD fell to as low as 1.3629 last week but recovered since then. Initial bias remains neutral this week first. On the downside, sustained trading below 61.8% retracement of 1.3480 to 1.3965 at 1.3665 will pave the way to retest 1.3480 low. Nevertheless, break of 1.3729 minor resistance will turn bias back to the upside

USD/JPY Weekly Outlook - ActionForex

USD/JPY Weekly Outlook – ActionForex

USD/JPY extended consolidations below 160.45 last week and outlook is unchanged. Initial bias remains neutral this week. Further rise is expected with 157.49 cluster support (38.2% retracement of 152.25 to 160.45 at 157.31) intact. On the upside break of 160.45 will target a retest on 161.94 high. However, firm break of 157.31/49 will bring deeper

USD/CHF Weekly Outlook - ActionForex

USD/CHF Weekly Outlook – ActionForex

USD/CHF turned into consolidations last week and recovered, but overall outlook is unchanged. Initial bias remains neutral this week first. On the downside sustained break of 61.8% retracement of 0.7603 to 0.8041 at 0.7770 will pave the way to retest 0.7603 low. However, break of 0.7933 resistance will bring stronger rise back to retest 0.8041

EUR/USD Weekly Outlook - ActionForex

EUR/USD Weekly Outlook – ActionForex

EUR/USD’s gyrated lower last week but recovered ahead of 1.1662 support. Initial bias remains neutral this week first, and further rise is in favor. On the upside, sustained trading above 61.8% retracement of 1.2081 to 1.1408 at 1.1824 will pave the way to retest 1.2081 high. However, firm break of 1.1662 support will indicate the

EUR/AUD Weekly Outlook - ActionForex

EUR/AUD Weekly Outlook – ActionForex

EUR/AUD’s fall from 1.6842 extended lower to 1.6340 last week. But a temporary low should be in place on loss of momentum. Initial bias is turned neutral this week first. Further decline is expected as long as 1.6497 support turned resistance holds. Below 1.6340 will target a retest on 1.6125 low. Nevertheless, firm break of

USD/CHF Mid-Day Outlook - ActionForex

USD/CHF Mid-Day Outlook – ActionForex

Daily Pivots: (S1) 0.7808; (P) 0.7830; (R1) 0.7867; More…. USD/CHF recovers further today but stays well below 0.7933 resistance. Intraday bias remains neutral and further decline is expected. Sustained break of 61.8% retracement of 0.7603 to 0.8041 at 0.7770 will resume the decline from 0.8041 to retest 0.7603 low. In the bigger picture, rebound from

USD/CHF Price Analysis: Bulls Eye Key Resistance After Base Formation

USD/CHF Price Analysis: Bulls Eye Key Resistance After Base Formation

On the daily chart, USD/CHF is in a recovery phase, currently sandwiched between the 50-day MA (0.7845) and 100-day MA (0.7865). The H4 chart shows a more defined bullish structure, featuring a “Golden Cross” (100-period MA above 200-period MA). Failure to hold above the 0.7846 short-term support would negate the bullish setup and likely lead

EUR/USD and EUR/CAD Continue Correction Ahead of Key Data

EUR/USD and EUR/CAD Continue Correction Ahead of Key Data

The euro remains under pressure, extending its corrective decline following the previous impulsive rally. Market participants are taking profits and trimming positions ahead of key macroeconomic releases, reducing demand for the single currency and keeping both pairs near important levels, with the potential for increased volatility. Ongoing geopolitical uncertainty in the Middle East continues to

Silver (XAG/USD) Under Pressure from Ceasefire Clouds – In-depth Analysis

Silver (XAG/USD) Under Pressure from Ceasefire Clouds – In-depth Analysis

Precious metals have been the victim of a severe reality check since late January. Subjects of severe melt-ups since August 2025, following a slow but consistent grind higher from de-dollarization trends, the commodities got swept on all sides with extreme leverage and volatility. And in Financial Markets, it rarely translates into anything good – Silver

USD/JPY Edges Up, Can It Sustain Gradual Upside Trend?

USD/JPY Edges Up, Can It Sustain Gradual Upside Trend?

Key Highlights USD/JPY regained traction and climbed above the 158.80 zone. It cleared a key bearish trend line with resistance at 159.35 on the 4-hour chart. EUR/USD started a downside correction and traded below 1.1750. GBP/USD started a consolidation phase below the 1.3550 pivot level. USD/JPY Technical Analysis The US Dollar remained supported above 158.40

Collinson FX: April 23: USD and Equities rebound

Collinson FX: April 24: Safety flows again moved towards the US Dollar

Collinson FX: April 24: Safety flows again moved towards the US Dollar – amid rising tensions. by Collinson FX 24 Apr 10:58 AEST 24 April 2026 2026 Auckland Wooden Boat Show – Jellicoe Harbour – March 13-15, 2026 © Richard Gladwell / Sail-World.com/nz April 24: Economic crisis ahead for Brits? Tensions are on

0
Would love your thoughts, please comment.x
()
x