FX Confusion as the US Dollar Forms a Double Bottom – Can the Ceasefire Stand? DXY Outlook

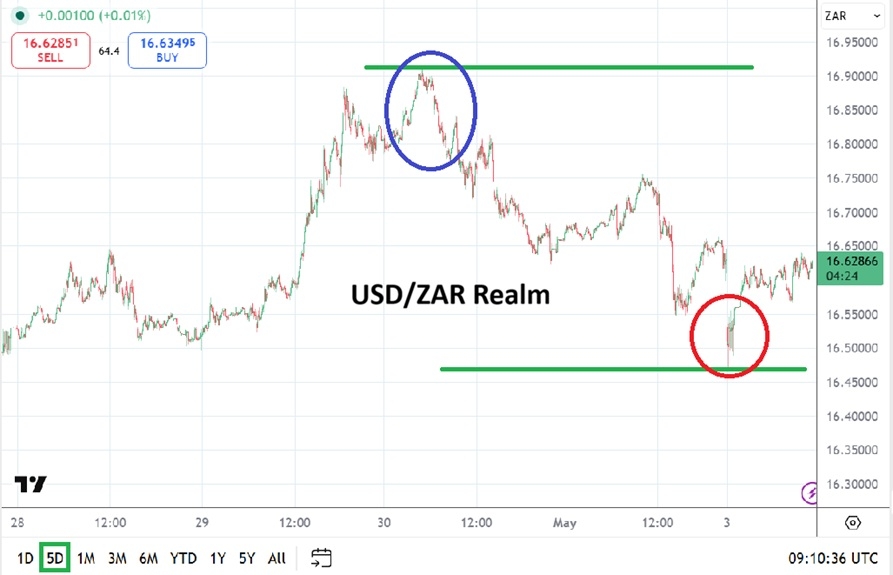
  • The US Dollar recovered a good part of its losses in the early week, forming a key double-bottom – More upside to come?
  • With Oil bouncing back above $105, its correlation with the FX Market picks up again
  • US Dollar Index (DXY) in-depth Technical Analysis

The US Dollar regained much of its early-week losses and formed a double-bottom pattern on the charts, making traders question if more gains are ahead. As WTI Crude jumped back above $105, the link between energy prices and the wider FX market is growing stronger again.

After all, if the past session’s speech by Fed’s Williams (the most influential voter at the Federal Reserve) showed elevated concerns about energy prices, there are many reasons to put emphasis on their price rises as traders.

Still, the NY Fed’s president eased the influence of hiking dissents, so for now, this is won’t add to the nascent flame in the Dollar.

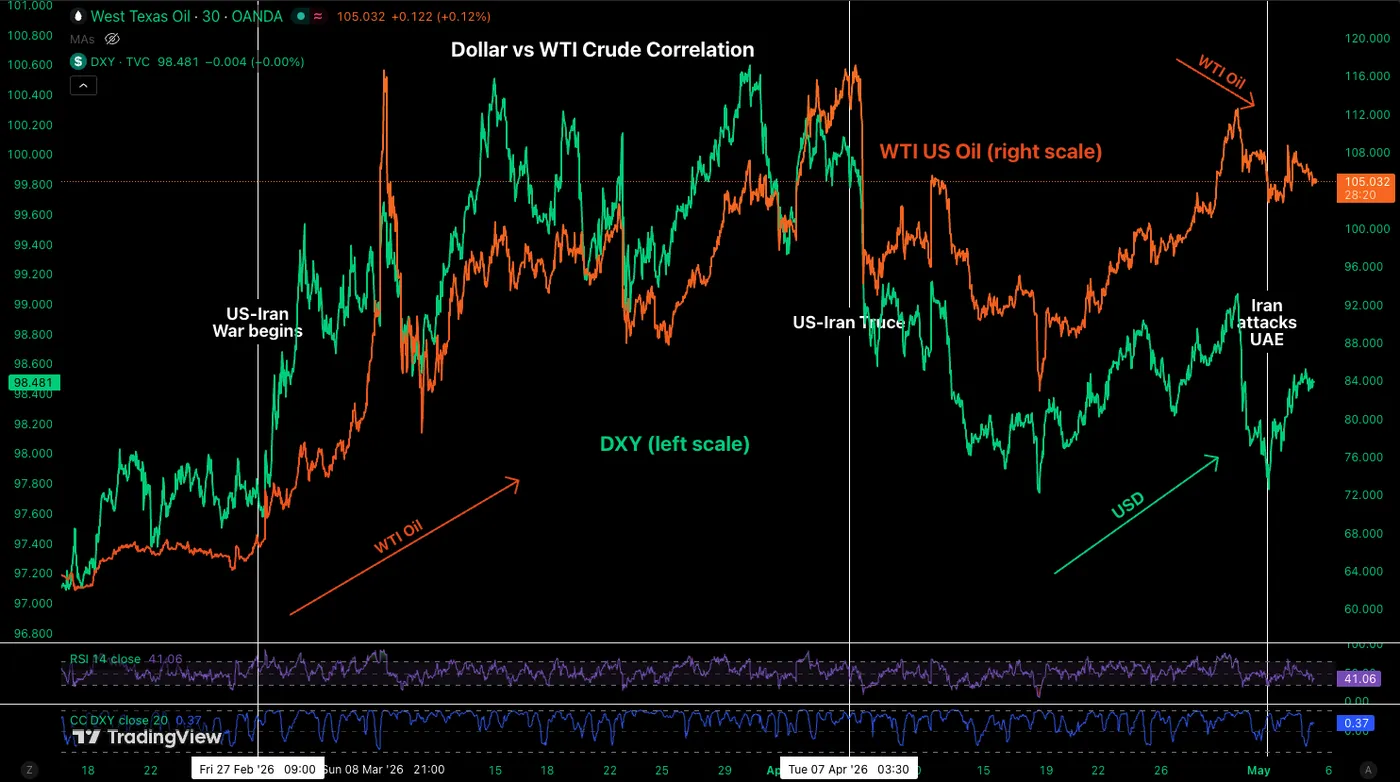
WTI Crude and Dollar Index (DXY) Correlation since Late February – Source: TradingView

Many in the market hoped to move past this long conflict.

But after yesterday’s serious geopolitical events, dollar bulls quickly returned to price in the risk of renewed war.

The semi-official Fars Agency reported that Iran launched missiles at US Navy ships in Iranian waters and carried out drone strikes on the UAE.

The US military and Israel are reportedly working together on possible limited responses. With the ceasefire just failing to lead to real diplomatic progress, hopes for peace could soon fall apart.

As a result, the wider FX markets are now at pivotal turning points, with the US Dollar leading the way, so we will look at the currency to spot how it could influence the action.

The Greenback is close to breaking its recent downtrend that followed the ceasefire.

If Crude oil rallies further, especially if it moves above $110, the petrodollar trade could quickly accelerate. Traders should keep a close eye on the war situation to see if any major breakouts are supported by real changes.

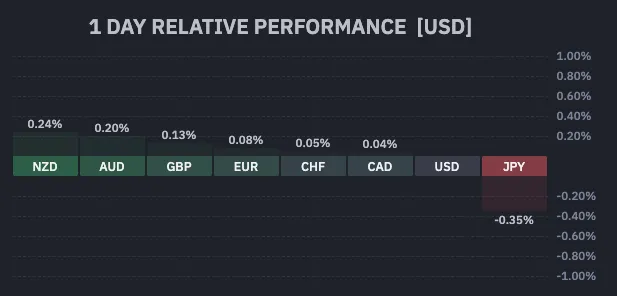
FX Performance (09:06 ET) – Source: TradingView. May 5, 2026

We’ll explore a few scenarios for upcoming action in an in-depth technical analysis of DXY.

Dollar Index (DXY) Multi-Timeframe Analysis

Daily Chart

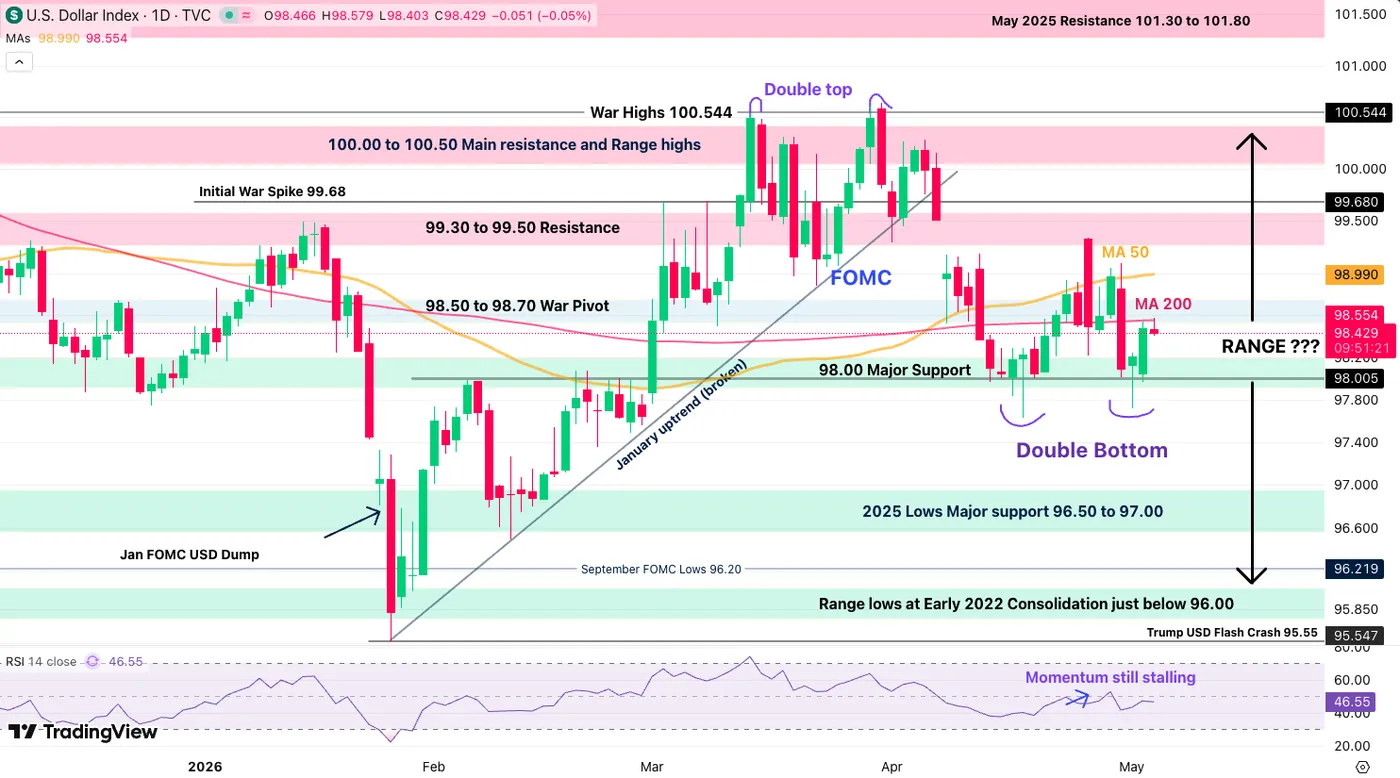
Dollar Index (DXY) Daily Chart. May 5, 2026 – Source: TradingView

The US Dollar is stalling right at the middle of its 96.00 to 100.00 July 2025 range, forming a double bottom after repeatedly failed diplomatic attempts.

The Daily moving averages are now flattening, showing the general confusion across the FX and overall Markets – With the 200-Day MA getting tested in the morning, right at the 98.50 level, traders will want to see if it holds or breaks to power the next moves in currencies.

Let’s take a closer look.

4H Chart and Technical Levels

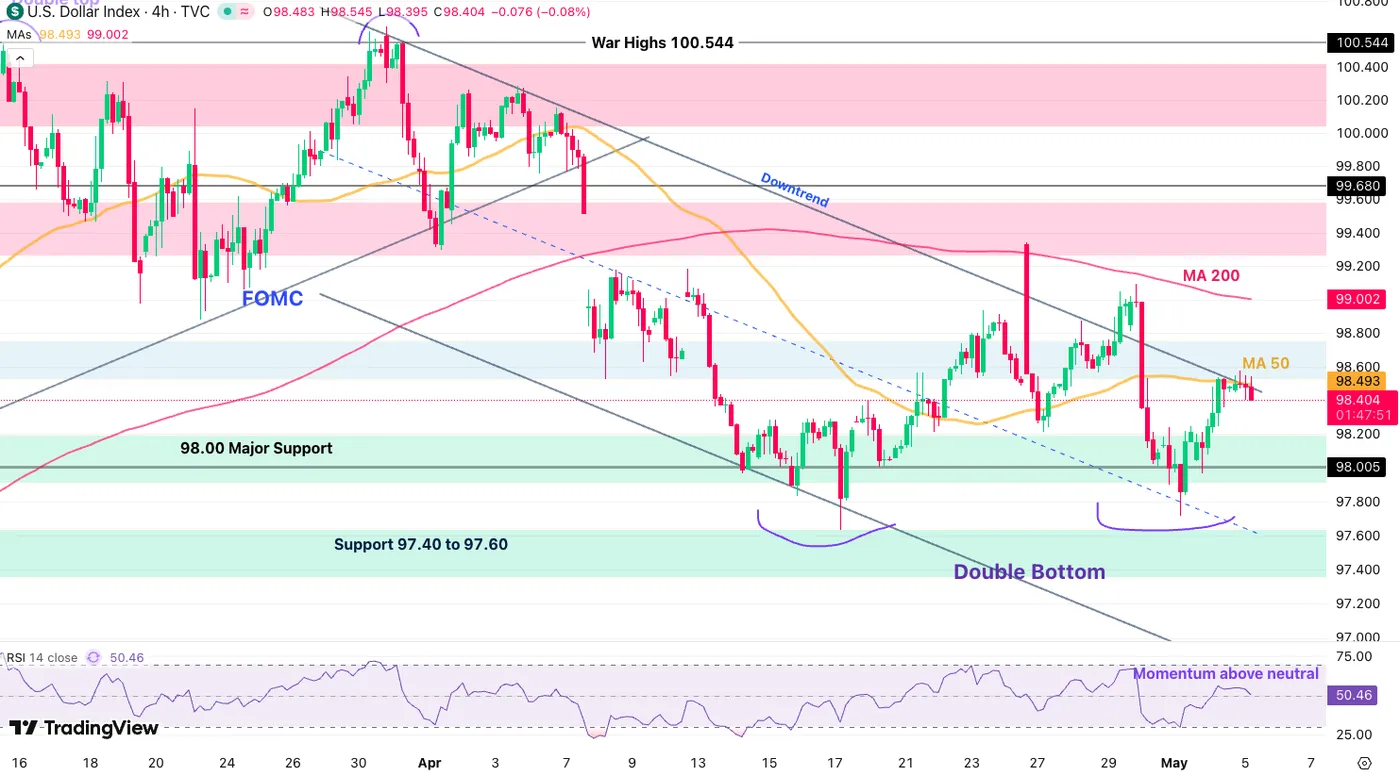
Dollar Index (DXY) 4H Chart. May 5, 2026 – Source: TradingView

The immediate action is tricky:

Sellers are attempting an entry at the downward channel top and 4H 50-period MA, but their momentum is shy.

Two scenarios should help to discern upcoming action.

  • Above 98.60, the rally in the dollar confirms, with the next key level entering at 99.00 (and possibility for 99.50)
  • Below 98.20, the bear channel holds and this could point to a test of 97.60 in coming days (this would require a lower WTI Crude).

Depending on the bull/bear scenarios, look for trades in FX pairs which provide interesting risk-reward scenarios, including EUR/USD, GBP/USD and GBP/USD – Don’t forget to do your own due diligence!

Levels to place on your DXY charts:

Resistance Levels

  • 98.50 4H 50-period MA & 200-day MA
  • 99.00 4H 200-period MA
  • 99.30 to 99.50 Resistance
  • 100.00 to 100.50 Main resistance and Range highs
  • War Highs 100.544 (Double Top)

Support Levels

  • 98.00 Major Support
  • Support 97.40 to 97.70 (double bottom level)
  • 2025 Lows Major support 96.50 to 97.00 (bear channel lows)
  • Range lows at Early 2022 Consolidation just below 96.00

Safe Trades and keep track of the latest headlines!

Source link

Visited 1 times, 1 visit(s) today

Related Article

Trading Technologies Expands TT® FX Functionality and Liquidity

Enhanced offering unifies OTC and listed markets into a single high-performance workflow CHICAGO, May 5, 2026 /PRNewswire/ — Trading Technologies International, Inc. (TT), a global capital markets technology platform services provider, today announced the expansion of TT FX, with a range of new features for institutional foreign exchange (FX) and precious metals traders to deliver

AriseAlpha Launches Free AI Forex Trading Bot to Capitalize on Rising Automated Currency Trading Trends in 2026

AriseAlpha Launches Free AI Forex Trading Bot to Capitalize on Rising Automated Currency Trading Trends in 2026

New York, NY, May 05, 2026 (GLOBE NEWSWIRE) — As global currency markets continue to expand, automation and artificial intelligence are playing an increasingly important role in how investors engage with forex trading. AriseAlpha announced the release of its free AI forex trading bot , designed to help investors participate in currency markets through data-driven strategies

Yen Jumps Briefly After Intervention in Forex. Forecast as of 05.05.2026 | LiteFinance

Yen Jumps Briefly After Intervention in Forex. Forecast as of 05.05.2026

2026.05.05 2026.05.05 Yen Jumps Briefly After Intervention in Forex. Forecast as of 05.05.2026 Dmitri Demidenkohttps://www.litefinance.org/blog/authors/dmitri-demidenko/ As long as oil prices continue to rise and the Bank of Japan refrains from raising interest rates, carry traders are likely to continue selling the yen. Against this backdrop, Japan’s currency interventions are unlikely to be effective or to

Youtube preview

Is the AUD bull run coming to an end? Forex range trading NZD/USD [Video]

Welcome to today’s Market Blast. Today, we will take a look at Forex Trading on Gold, XAUUSD, USD Index, USDCAD, NZDUSD, and AUDUSD. We don’t often look at weekly charts, but I just wanted to illustrate this bull run on AUDUSD and, in fact, all AUD pairs, all this year. The RBA just increased their

Gold Takes A Blow, Sellers Push Prices Lower Fast

Gold Takes A Blow, Sellers Push Prices Lower Fast

Key Highlights Gold started a fresh decline below the $4,650 support. A connecting bearish trend line is forming with resistance at $4,610 on the 4-hour chart. WTI Crude Oil regained traction and climbed above $105. EUR/USD failed to stay above 1.1775 and corrected gains. Gold Price Technical Analysis Gold failed to surpass $4,900 and trimmed

The Last Look... - The Full FX

The Last Look… – The Full FX

Categorised: The Position, Top Story | Tags: BIS, emerging markets, FX settlement risk, StablecoinsPosted by Eva Szalay. Last updated: May 5, 2026 With all the goings on in the world, opportunities are aplenty in foreign exchange markets nowadays. This is clearly showing up in banks’ first quarter results which are all heavy with references to

USD/JPY Daily Outlook - ActionForex

USD/JPY Daily Outlook – ActionForex

Daily Pivots: (S1) 155.94; (P) 156.64; (R1) 157.75; More… Intraday bias in USD/JPY stays neutral for the moment. Risk will stay on the downside as long as 55 4H EMA (now at 158.55) holds. Below 155.48 will extend the fall from 160.71 and target 152.25 cluster support (38.2% retracement of 139.87 to 160.71 at 152.74).

USD/ZAR Analysis 04/05

USD/ZAR Analysis 04/05

The broad Forex market remains cautious about short and near-term outlooks regarding currencies versus the USD. Early morning trading today saw major currencies like the South African Rand gain against the USD, but caution has swept again into the global marketplace. The USD/ZAR which displayed values on trading platforms early today below the 16.50000 realm,

EUR/CHF Daily Outlook - ActionForex

EUR/CHF Daily Outlook – ActionForex

Daily Pivots: (S1) 0.9152; (P) 0.9168; (R1) 0.9181; More…. Intraday bias in EUR/CHF stays neutral for the moment. Rise from 0.8979 is expected to continue as long as 0.9155 cluster support (38.2% retracement of 0.8979 to 0.9264 at 0.9155) holds. On the upside, firm break of 0.9264 will target 0.9394 resistance next. However, break of

XAU/USD: Gold Bears Dominate While the Price Holds Below Falling Thick Daily Cloud

XAU/USD: Gold Bears Dominate While the Price Holds Below Falling Thick Daily Cloud

Gold price fell at the start of the week, losing around 1.8% by mid-European trading on Monday, reflecting growing concerns about rising inflation that prompted major central banks to take more hawkish stance, despite that all of them kept rates unchanged in the policy meetings last week. On the other hand, high geopolitical uncertainty surrounding

7 best all-in-one AI trading bot platforms in 2026 for crypto, forex, and stock trading

7 best all-in-one AI trading bot platforms in 2026 for crypto, forex, and stock trading

AI trading bots are no longer used only by professional quant teams. In 2026, traders are using automated tools to monitor markets, test strategies, execute orders, manage risk, and reduce emotional decision-making across crypto, forex, and stock trading. The best all-in-one AI trading bot platform is not simply the one with the most features. It

AriseAlpha

AriseAlpha Launches Free AI Forex Trading Bot Amid Growing

NEW YORK, May 04, 2026 (GLOBE NEWSWIRE) — AriseAlpha announced the launch of its free AI Forex Trading Bot, precisely responding to the significant growth in global demand for automated currency trading solutions in 2026, providing traders with intelligent decision support and efficient execution tools. In 2026, the forex market is undergoing a profound technology-driven

USD/JPY Mid-Day Outlook - ActionForex

USD/JPY Mid-Day Outlook – ActionForex

Daily Pivots: (S1) 155.94; (P) 156.64; (R1) 157.75; More… Intraday bias in USD/JPY remains neutral and more consolidations could be seen above 155.48 temporary low. Risk will stay on the downside as long as 55 4H EMA (now at 158.45) holds. Below 155.48 will extend the fall from 160.71 and target 152.25 cluster support (38.2%

AriseAlpha

AriseAlpha Unveils Free AI Trading Bot to Help Investors

NEW YORK, May 04, 2026 (GLOBE NEWSWIRE) — As global forex markets become increasingly data-driven and fast-moving, investors are facing new challenges in keeping up with real-time price movements and execution demands. In this evolving landscape, AriseAlpha announced the launch of its free AI trading bot, designed to provide a more efficient and structured approach to

Gold Supported by Cautious Optimism

Gold Supported by Cautious Optimism

Gold is holding at around 4,611 USD per ounce on Monday as markets assess Donald Trump’s proposal to escort commercial vessels through the Strait of Hormuz, alongside tentative signs of progress in US–Iran negotiations. The plan involves assisting civilian ships from neutral countries in safely leaving the conflict zone and restoring access to the shipping

EUR/GBP Daily Outlook - ActionForex

EUR/GBP Daily Outlook – ActionForex

Daily Pivots: (S1) 0.8623; (P) 0.8632; (R1) 0.8645; More… Intraday bias in EUR/GBP is turned neutral first with current recovery. On the downside, decisive break of 0.8610 key support carry larger bearish implications and pave the way to 0.8466 fibonacci level next. However, firm break of 0.8652 will turn bias back to the upside for

Gold Builds Momentum While WTI Crude Oil Faces Renewed Selling Pressure

Gold Builds Momentum While WTI Crude Oil Faces Renewed Selling Pressure

Gold price is consolidating above the $2,565 support zone. Crude oil is showing bearish signs and might decline below $96.50. Important Takeaways for Gold and WTI Crude Oil Prices Analysis Today Gold price started a recovery wave from $4,500 against the US Dollar. It cleared a key bearish trend line with resistance at $4,620 on

USD/CHF Daily Outlook - ActionForex

USD/CHF Daily Outlook – ActionForex

Daily Pivots: (S1) 0.7787; (P) 0.7810; (R1) 0.7841; More…. Intraday bias in USD/CHF stays mildly on the downside for 0.7774 and then 61.8% projection of 0.8041 to 0.7774 from 0.7923 at 0.7758. Firm break there will extend the fall from 0.8041 to 100% projection at 0.7656. On the upside, above 0.7829 minor resistance will turn

Table of prices NASDAQ 100 03/05/2026

Weekly Pairs in Focus 3rd to 8th May 2026 (Charts)

NASDAQ 100 The week has been very good to the NASDAQ 100 yet again and as we look forward the question now is whether or not we can continue to break out to the upside. After all, this is a market that I think continues to see a lot of volatility and a lot of

Byo man fined US$200 for illegal forex trading

Dalyn Chigwizura Court Reporter A 20-YEAR-OLD Bulawayo man has been fined US$200 or six months in prison after he was caught illegally dealing in foreign currency during a police operation targeting illicit financial activities. Mitchel Noah of Pumula South suburb was convicted on his own plea of guilty to contravening provisions of the Exchange Control

0
Would love your thoughts, please comment.x
()
x