Daily Market Price Updates and Commentary 20th November 2026


ICE Futures U.S. Sugar No.11 Contract

Settlement (cUS$/lb) Open High Low Last Volume O/I Life High Life Low
Mar27 17.03 -0.13 â–¼ 17.25 17.31 16.82 17.07 108,167 523,251 21.29 14.42
May27 16.37 -0.18 â–¼ 16.65 16.70 16.20 16.42 52,783 211,837 20.40 14.29
Jul27 16.04 -0.20 â–¼ 16.30 16.38 15.91 16.09 34,617 145,084 19.81 14.27
Oct27 16.12 -0.20 â–¼ 16.40 16.45 16.01 16.17 21,900 96,093 19.63 14.45
Mar28 16.61 -0.18 â–¼ 16.87 16.92 16.51 16.66 8,593 61,907 19.83 14.97
May28 15.88 -0.13 â–¼ 16.08 16.13 15.82 15.91 3,228 27,378 18.77 14.82
Jul28 15.53 -0.10 â–¼ 15.69 15.74 15.50 15.56 2,893 21,087 18.10 14.74
Oct28 15.55 -0.08 â–¼ 15.69 15.74 15.53 15.58 1,814 17,354 17.91 15.01
Mar29 16.02 -0.07 â–¼ 16.17 16.19 16.01 16.02 797 7,403 18.19 16.01
May29 15.70 -0.05 â–¼ 15.83 15.85 15.70 15.72 619 3,019 17.74 15.70
Jul29 15.55 -0.04 â–¼ 15.67 15.68 15.56 15.56 253 4,635 17.50 15.56
Oct29 15.67 -0.04 â–¼ 15.70 15.76 15.70 15.76 30 273 16.30 15.70
Total               235,694 1,119,321    

*Volume includes exchange for physicals.


ICE U.S. Sugar No.11 – Spreads

Date Spread Date Spread
Mar27 / May27 0.66 Oct27 / Mar28 -0.49
Mar27 / Jul27 0.99 Oct27 / May28 0.24
Mar27 / Oct27 0.91 Mar28 / May28 0.73
Mar27 / Mar28 0.42 Mar28 / Jul28 1.08
May27 / Jul27 0.33 May28 / Jul28 0.35
May27 / Oct27 0.25 May28 / Oct28 0.33
Jul27 / Oct27 -0.08 Jul28 / Oct28 -0.02
Jul27 / Mar28 -0.57 Jul28 / Mar29 -0.49


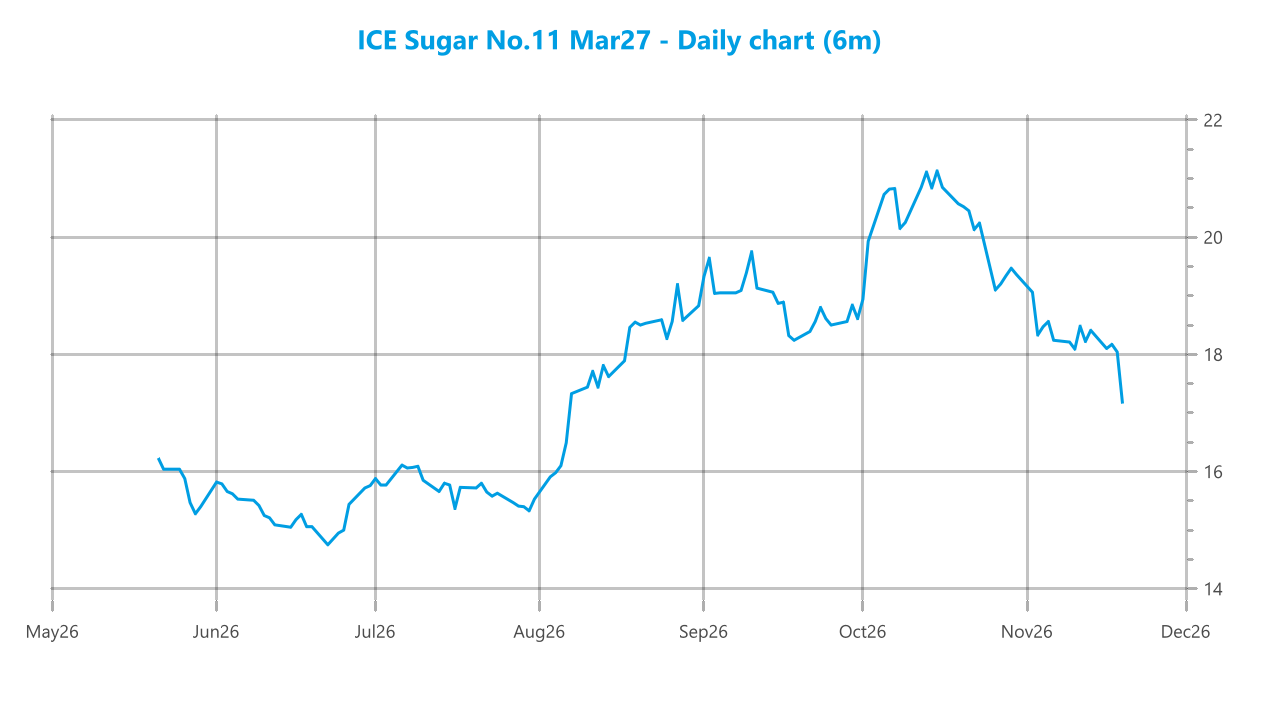
Another large opening range saw March’27 between 17.06 and 17.31, and while the price remained at small credit soon afterwards against opportunistic pricing and hedge lifting there was no real hint of a bounce. Instead, the market edged along with a slight downward bias, and by noon we were touching fresh session lows with short traders eyeing a move through 17.00. Soon afterwards they achieved this goal, and the continuing lack of chart support allowed the price to further erode to 16.82 across the next couple of hours, though with stronger buying on show below 17.00 the continuing liquidation did not lead to another substantial loss. Eventually some short covering followed and pulled the price back up to 17.00, and through the later afternoon the market was able to hold off the lows. Spreads were a little firmer with March/May’27 up to 0.66 points, against a steady volume. The last hour played out just above 17.00 and we ended valued at 17.03, still in danger from a technical perspective as we reach the weekend.    


ICE Europe White Sugar Futures Contract

Settlement (US$/mt) Open High Low Last Volume O/I Life High Life Low
Mar27 487.90 -0.30 â–¼ 488.20 491.10 483.20 488.40 14,113 69,515 577.40 398.00
May27 488.00 -1.60 â–¼ 490.20 492.30 484.00 488.50 7,070 32,572 581.80 401.40
Aug27 483.50 -2.60 â–¼ 486.70 488.50 480.70 484.20 3,877 18,141 574.30 404.30
Oct27 480.10 -3.20 â–¼ 484.00 485.40 478.10 480.70 2,242 9,619 565.30 408.20
Dec27 479.00 -3.90 â–¼ 482.90 484.80 477.70 479.20 1,091 4,786 558.20 414.30
Mar28 482.30 -4.20 â–¼ 484.90 488.40 481.30 482.30 641 1,508 552.60 421.00
May28 480.20 -3.50 â–¼ 482.10 486.10 480.10 480.90 437 990 542.80 426.30
Aug28 476.20 -3.50 â–¼ 478.30 478.30 477.00 477.00 243 638 529.90 431.10
Oct28 474.60 -1.50 â–¼ 476.00 476.00 476.00 476.00 1 196 520.00 441.70
Dec28 475.20 -3.40 â–¼ 489.30 490.10 488.00 488.00 22 35 518.10 468.60
Mar29 477.60 -36.20 â–¼ 517.10 517.10 517.10 517.10 1 7 517.10 483.20
May29 476.50 0.10 â–² 475.50 475.50 475.50 475.50 1 17 517.50 473.60
Aug29 474.70 —   — — — — — — — —
Oct29 473.10 —   — — — — — — — —
Total               29,739 138,024    

*Volume includes exchange for physicals.


ICE Europe White Sugar – Spreads

Date Spread Date Spread
Mar27 / May27 -0.10 May27 / Aug27 4.50
Mar27 / Aug27 4.40 Aug27 / Oct27 3.40
Mar27 / Oct27 7.80 Oct27 / Dec27 1.10
Mar27 / Dec27 8.90 Dec27 / Mar28 -3.30


White Sugar Premium

Date Premium Date Premium
Mar27 / Mar27 112.45 Jul28 / Aug28 133.82
May27 / May27 127.10 Oct28 / Oct28 131.78
Jul27 / Aug27 129.88 Mar29 / Mar29 124.42
Oct27 / Oct27 124.72 May29 / May29 130.37
Mar28 / Mar28 116.11 Jul29 / Aug29 131.88
May28 / May28 130.11 Oct29 / Oct29 127.64

*Values calculated basis 6:19 PM.

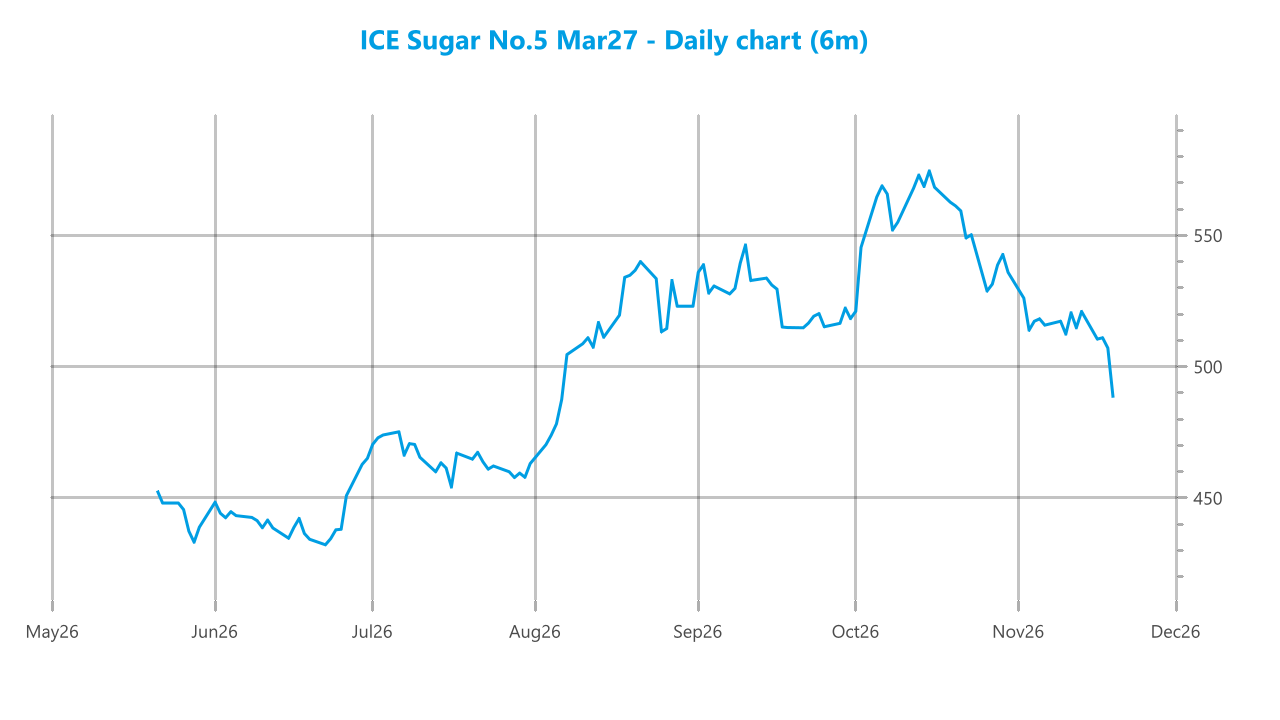
From an unchanged opening the market pulled back up a small way against hedge lifting to reach $491.10 in March’27, however there was no other buying following behind and the price soon set back to sit little changed. With the technical picture so vulnerable there was an understandable reluctance from traders to buy aside from the resting pricing orders, and so when smaller specs did make their move it was again driven from the short side. Into the early afternoon March’27 was pushed back to $483.20, its lowest levels since early August though with support at least starting to emerge ahead of the old $477.20 highs and so discouraging more aggressive pressure. Mi-afternoon drew some profit taking from the smaller traders and across the rest of the session this allowed March’27 to erase its losses, helped by spread buying with March/May’27 moving up to parity. In the end a token loss was recorded with settlement reached at $487.90, as we reach the weekend still showing vulnerability but with the spread at least bringing some small encouragement to the remaining longs.


Market chart asset


Market chart asset


A man with short brown hair and glasses, wearing a light striped shirt, is smiling and looking slightly to the left in an indoor setting. Other people are blurred in the background.

Jon Whybrow

Jon joined CZ in 1991, working in the Treasury department before moving to join the derivatives team in 1994. Over 30 years Jon has built up significant experience across derivatives markets and products, particularly sugar, and is now Head of Flow derivatives providing market execution services for CZ’s global client base. He is responsible for the market commentaries which are published each day on CZ app.


More from this author

Source link

Visited 1 times, 1 visit(s) today

Related Article

‘Black Friday’ brings consumer spending into focus for AI-rocked market

Traders work on the floor at the New York Stock Exchange (NYSE) in New York City, US, November 18, 2026. REUTERS/Brendan McDermid Brendan McDermid Reuters NEW YORK, Nov 20 (Reuters) – Investors next week will focus on consumer spending, looking for evidence that a broadly solid economy can help calm a US stock market unsettled

Here’s Why Nvidia Stock Crashed on Friday

Reports of a new investigation drove many investors to sell. By Joe Tenebruso – Nov 20, 2026 at 8:25PM EST Shares of Nvidia (NVDA -14.01%) plunged 14% on Friday following reports that the U.S. Securities and Exchange Commission (SEC) is investigating the tech titan’s accounting practices. Image source: Getty Images. Regulatory probes It’s a challenging

Gold falls toward $3,500, silver slides as stock markets enter correction territory – Kitco PM Report

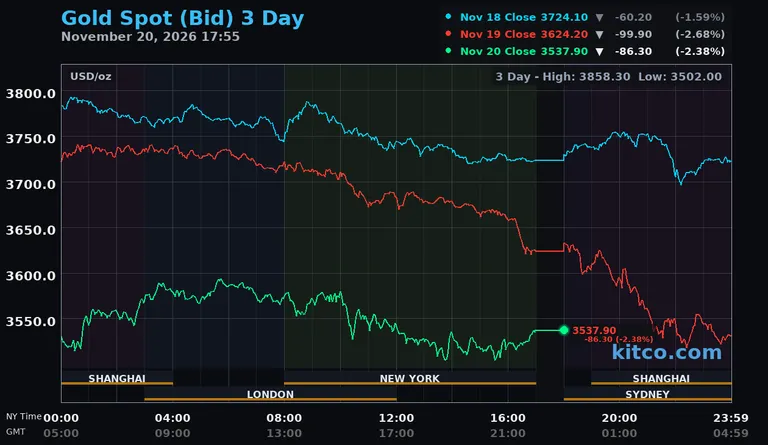
(Kitco NewsWire) – Spot gold and silver prices were sharply lower in late U.S. trading Friday, extending their recent selloff as a historic technology-led equity market decline and expectations for additional Federal Reserve interest rate increases pressured precious metals. Gold approached the psychologically important $3,500 level, trading at its lowest prices since September 2025, while silver suffered

Micron Is Down 32% in a Month. Can MU Stock Get Back to $1,000?

Quick Read Micron (MU) plunged 32% in a month to $605 as doubts grow over how long the AI memory boom can last. UBS warns against companies whose valuations depend on persistent bottlenecks, while Western Digital and Seagate sank similar amounts despite strong revenue growth. Reclaiming $1,000 requires firm memory pricing and strong guidance, with

7 reasons why tech stocks are getting hammered again

So much for the much-hyped Anthropic (ANT) IPO on Thursday lifting the spirits of tech investors ahead of the holidays. Lost in all the Anthropic IPO coverage yesterday was the fact that, while the stock finished up nicely on its debut day, the tech-heavy Nasdaq Composite (^IXIC) fell 2.2%. The selling pressure in wider tech

6 reasons stocks are falling, and what you should do about it

The stock market is having its roughest patch since the early days of the pandemic.  Stocks wavered on Friday after tumbling the previous day, with the S&P 500 on track to mark its seventh consecutive day of losses. That would mark its longest losing streak since February 2020, when investors fled the market amid the

Circle Falls 4% As Broader Stock Market Sells Off

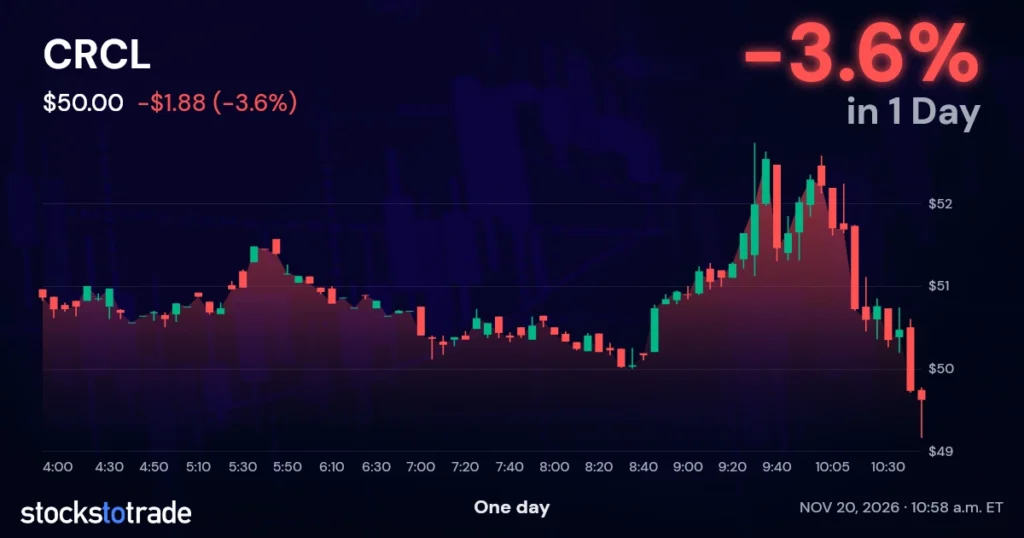
Circle fell 4% alongside a broader market decline, as market coverage warned about the risks of aggressive rate increases. Get Free Alerts Why Circle Stock Is Falling Today Circle Internet Group fell 4% to $50.00 this morning alongside a broad stock selloff. The market decline came alongside a warning that aggressive rate increases could cause

Home Depot Inc Stock (HD) Moved Up by 3.04% on Nov 20: Drivers Behind the Movement

Home Depot advanced solidly during the session, driven by a convergence of resilient quarterly fundamentals, supportive macroeconomic indicators in the housing sector, and favorable institutional positioning. Investor sentiment received a notable boost following stronger-than-anticipated operational metrics, which underscored the retailer’s capacity to navigate a choppy consumer spending backdrop while defending market share in the home

Nvidia stock extends 6-day losing streak, as AMD, Broadcom lead chip sector lower

Chip giant Nvidia (NVDA) extended declines on Friday, heading for seven straight days of losses. Peers AMD (AMD) and Broadcom (AVGO) also tanked 6% and 3%, respectively. US-based chipmaker Intel (INTC) also declined. Memory chipmaker Micron Technology (MU) and peer SK Hynix (SKHY) dropped more than 3%. Shares of Taiwan Semiconductor Manufacturing Company (TSM) and

US Stock Market Today: S&P 500 Futures Slip As Higher Rate Fears Resurface

The Morning Bull – US Market Morning Update Friday, Nov, 20 2026 US stocks look set to open weaker, with S&P 500 and Nasdaq futures in the red as investors refocus on the Federal Reserve. The dominant driver is a renewed push toward higher US rates after hawkish Fed minutes. Minutes from the October meeting

Robinhood Markets vs. PayPal: Which Financial Stock Is a Better Buy for 2027?

Robinhood’s revenue jumped 51.6% last year, but PayPal trades at a far lower multiple, leaving investors to weigh growth against value. By Erin Kennedy – Updated Nov 20, 2026 at 6:41AM EST Key Points Robinhood Markets delivered significant revenue growth and high net margins in its most recent fiscal year. PayPal maintains a massive global

Robinhood Markets vs. SoFi Technologies: Which Financial Stock Is a Better Buy for 2027?

Robinhood’s revenue jumped 51.6% last year, but SoFi trades at a lower forward multiple, and that gap could matter more than either growth story. By Sarah Sidlow – Updated Nov 20, 2026 at 5:48AM EST Key Points Robinhood Markets continues to scale its retail brokerage while expanding into institutional services and crypto markets. SoFi Technologies

Stock markets fall in early trade amid profit-taking, weak global trends

Mumbai: Market benchmark indices Sensex and Nifty declined in early trade on Friday amid profit-taking after a sharp rally in the previous session and bearish trend in global equities. ANYTIME, ANYWHERE. Experience a more refined e-paper today Read E-Paper The 30-share BSE Sensex fell 211.32 points to 82,797.27 in early trade. The 50-share NSE Nifty

Vitasoy Announces Business Results for 1H FY2026/2027

Financial Highlights 6 months ended 30 September 2026 1H FY2026/27 HK$ Mn 1H FY2025/26 HK$ Mn Change Change – Net of currency impact Revenue 3,337 3,227 +3 % -1 % Gross Profit 1,733 1,648 +5 % +1 % Gross Profit Margin 51.9 % 51.1 % +0.8% pts +0.9% pts Profit From Operations 263 247 +7

0
Would love your thoughts, please comment.x
()
x