If the CPI significantly exceeds expectations, the market may shift from ‘the Fed pausing rate cuts this year’ to ‘the Fed possibly having to reconsider rate hikes.’ This would also mean that the dovish optimistic and bullish assumptions supporting the Risk-On environment (i.e., ‘fully embracing risk assets’) would be undermined.
According to Zhitong Finance APP, based on the latest forecasts from Wall Street strategists, an overly heated US CPI data report could trigger a significant market shift – specifically, if the CPI is significantly higher than expected, the market may shift further from ‘the Fed pausing rate cuts this year’ to ‘the Fed possibly having to reconsider raising rates.’ This would also mean that the dovish optimistic and bullish assumptions supporting the Risk-On (i.e., ‘fully embracing risk assets’) scenario would be broken, and the global stock, bond, and currency markets may enter a more intense repricing phase. Particularly for the global stock market bull run centered around AI computing power trading amid rising risk appetite, it could imply at least a short-term major downward correction trend.
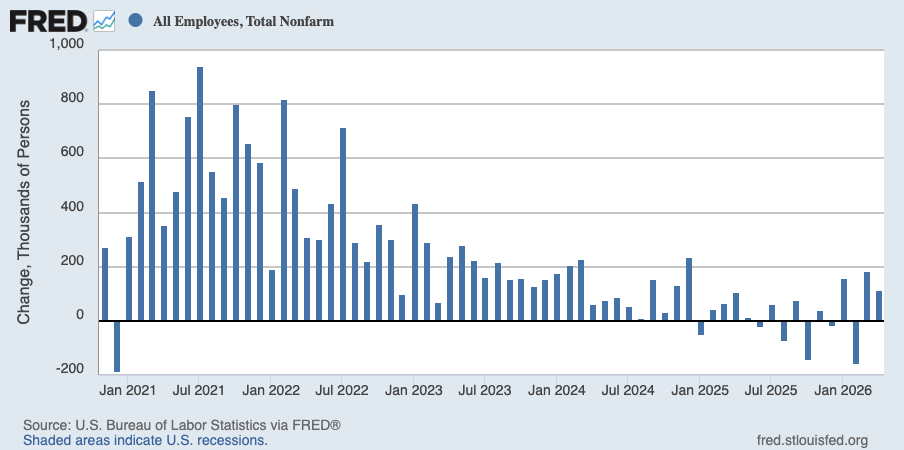
Although the U.S. stock market and even global equity markets have repeatedly hit new historical highs recently due to strong U.S. non-farm payrolls and an unprecedented wave of AI computing investment, increasingly extreme momentum trading, oil price shocks, inflation concerns, and rising long-term U.S. Treasury yields have begun to become key variables suppressing valuations. Particularly, the 10-year U.S. Treasury yield is forming a technical pattern that may rise further; if the yield continues to break upwards, it could threaten the stock market rally.
Additionally, the latest geopolitical developments—namely Trump’s rejection of Iran’s peace proposal—have undoubtedly prolonged the de facto dual blockade of the Strait of Hormuz by the U.S. and Iran, which is crucial for the global energy system. This could lead to further increases in international oil prices. Coupled with momentum trading indicators reaching extreme levels that have historically signaled short-term violent sell-offs, these factors could collectively drive the recent global stock market surge fueled by AI investment fever towards a correction trajectory.
Inflation in the United States is heating up again, primarily due to the sharp rise of over 60% in international oil prices since the end of February. Central banks around the world, including the Federal Reserve, are approaching a point where action may be necessary. For now, the interest rate futures market expects the Fed to remain on hold and sees no signs of rate cuts at least until the end of this year. Meanwhile, the European Central Bank, the Bank of Japan, and the Bank of England may need to resume tightening policies soon.
This is not just about central bank policy. The stakes are high for the global stock market driven by the AI computing frenzy, the U.S. Treasury yield curve known as the ‘global asset pricing anchor,’ and the U.S. Dollar Index. The April U.S. CPI report, due this week, will undoubtedly play a crucial role in determining their next moves.
CPI Storm Approaching! High Oil Prices May Ignite Inflation Beast
April CPI is expected to heat up again, with economists unanimously predicting a substantial month-over-month increase of 0.6%, following a 0.9% rise reported in March. This is expected to push the year-over-year CPI up significantly from last month’s 3.3% to 3.7%. Meanwhile, core CPI is also expected to see a notable jump, with month-over-month growth possibly increasing from 0.2% to 0.4%, and year-over-year core CPI potentially rising from 2.6% to 2.7%.
Prediction markets like Kalshi align with analysts’ expectations, forecasting a 3.7% year-over-year increase in CPI and a 0.6% month-over-month increase, while core CPI is expected to rise 2.7% year-over-year and 0.4% month-over-month. The issue is that May inflation is projected to rise further based on April’s robust inflation figures; currently, the CPI swap market is pricing in a move to 4% overall CPI.
Notably, the U.S. inflation data for March has already shown a heated trend, with a 0.9% month-over-month surge, the largest single-month increase since June 2022. Year-over-year, it rose to 3.3%, the highest level since 2024. Gasoline prices recorded their strongest increase since 1967.

This (rising CPI data) will undoubtedly pose significant challenges to the Federal Reserve and global central banks and may put greater pressure on monetary tightening actions around rate hikes after misjudging inflation in 2021 and 2022. Markets have already reacted, with the federal funds futures market pricing in no rate cuts by the Fed in 2026 and no foreseeable cuts in the near future.
These challenges are not only present at the Federal Reserve but also at other major central banks such as the European Central Bank and the Bank of England, as the threat of high inflation has forced interest rate futures markets and bond trading markets to quickly adapt to oil supply shocks.
Since the outbreak of the Iran conflict at the end of February, the Strait of Hormuz has been effectively blockaded, cutting off one of the most crucial shipping routes for supplying crude oil, natural gas, and refined fuel products to global customers. This disruption has significantly driven up energy prices and exacerbated inflation concerns among global investors. The International Energy Agency (IEA) stated that the supply disruption caused by this geopolitical conflict in the Strait of Hormuz is creating the largest supply-side shock in human history.
Citi released a research report stating that if the long-term peace negotiations between the United States and Iran remain difficult, leading to the prolonged blockade and control of the Strait of Hormuz, the international oil price benchmark—Brent crude oil prices—may rise further from their recent noticeable pullback around the $100 mark, potentially even setting new phase highs.
The market has already begun pricing in the possibility of European interest rate hikes, with the European Central Bank and the Bank of England potentially raising rates up to three times this year. Meanwhile, so far, the market has not priced in a rate hike by the Federal Reserve, only marking the end of an easing cycle.

Even as the CPI accelerates its expansion, the bond market has relatively calmly absorbed this, pricing in risks with higher inflation expectations rather than higher real yields—indicating that the market expects the Federal Reserve to maintain a dovish bias towards potential rate cuts, as some economists continue to insist that the Fed will view the oil price shock as ‘transitory.’
Since international oil prices surged over 60% at the end of February, the 10-year U.S. TIPS real yield curve has actually declined in recent months, while the 5-year inflation swap rate has risen sharply.

This makes the April CPI report especially crucial, as a reading below expectations could prompt the market to reconsider incorporating the Federal Reserve’s rate cut trajectory, while a significantly higher-than-expected reading could lead the market to price in rate hikes, thereby challenging the optimistic view that the Fed remains dovish.
Moreover, the CPI may continue to have significant implications for the trend in the U.S. dollar exchange rate and Treasury yields. The 10-year U.S. Treasury yield is nearing a key potential breakout level above a multi-year downtrend line—a level that has been repeatedly tested before. If the 10-year Treasury yield decisively breaks above the technical trend line and surpasses 4.4%, it could trigger a sustained multi-month upward movement, potentially pushing the 10-year yield back towards the historical highs seen in October 2023.

The same holds true for the U.S. Dollar Index, a benchmark for measuring the strength of the dollar. The index has struggled to break through the critical resistance level of 101 but has formed an uptrend in recent weeks; if the 101 resistance is broken, the dollar could reach its highest level since January 2025, approaching the 109 level.

Currently, the bond market continues to price in the oil price shock by expecting rising inflation without a corresponding increase in real yields, essentially assuming the Federal Reserve will treat the oil price shock as transitory. However, once the CPI consistently exceeds expectations, this dovish assumption will be challenged. If the 10-year Treasury yield effectively breaks above 4.4%, it could trigger an extended upward movement. Similarly, if the Dollar Index breaks above 101, it may move closer to the 109 area near January 2025.
At present, both interest rates and the dollar are at critical junctures on technical charts. If the dollar and 10-year Treasury yield sustain upward breakouts after the release of the CPI report, it could serve as a major red sell signal from the market, difficult for both Federal Reserve policymakers and investors to ignore.
If the 10-year Treasury yield and the dollar remain range-bound, the market is likely to stay neutral for a longer period or at least maintain a wait-and-see stance until the next CPI report in June. During this time, if there is a surge in significant positive catalysts related to AI, it could propel further bullish momentum in U.S. equities and even global stock markets, driving them to new record highs.
The CPI has become the ‘master switch’ for three major markets! A hot CPI report might pull the market back into an era of ‘high yields, high dollar exchange rates, and high volatility.’
This excessively hot US CPI inflation report may force the market to reassess the Federal Reserve’s reaction function. If the CPI is significantly higher than expected, the market could shift from a stance of ‘no rate cuts for now’ to ‘repricing the risk of interest rate hikes,’ driving the 10-year US Treasury yield and the dollar above key technical levels, thereby triggering a brief but sharp sell-off in global risk assets such as the stock market.
For the bond market, the most direct implication of a hot CPI is that long-term nominal yields will rise, inflation compensation will increase, and the 10-year US Treasury yield curve may continue to break upward. If the market believes the Fed can ‘see through’ the oil price shock, real yields may not rise significantly; however, if the CPI heat spreads to core inflation, wages, and service prices, the bond market will have to shift from viewing it as a ‘one-time oil price shock’ to a ‘more persistent inflation shock,’ at which point real yields would also rise, potentially testing higher ranges for the 10-year Treasury.
Recently, Barclays, a Wall Street financial giant, has postponed its forecast for Federal Reserve rate cuts from 2026 to 2027. Traders in the interest rate futures market have priced in about a 78.7% probability of unchanged rates until the end of 2026, indicating that the bond market has significantly scaled back its ‘rate cut dream.’
If yields on US Treasuries with maturities of 10 years or more continue to rise, this would equate to a simultaneous occurrence of ‘significantly higher funding costs, weaker liquidity expectations, and broader macroeconomic denominator expansion’ for core risk assets like the stock market, cryptocurrencies, and high-yield corporate bonds.

From a theoretical perspective, the 10-year US Treasury yield corresponds to the risk-free interest rate (r) in the denominator of the DCF valuation model—a crucial valuation framework for the stock market. If other metrics—particularly cash flow expectations in the numerator—remain unchanged, such as during earnings season when the numerator remains stagnant due to a lack of positive catalysts, then a higher or persistently elevated denominator level would lead to valuation collapses among highly valued tech stocks closely linked to AI, high-yield corporate bonds, and cryptocurrencies, all of which are trading at historically high valuations.
For the foreign exchange market, an overly hot CPI is undoubtedly bullish for the US dollar, especially against the backdrop of rising US yields and greater vulnerability in other economies. The core logic here is that if US inflation heats up again but the economy remains resilient, the Federal Reserve maintaining high rates or issuing more hawkish signals would widen the relative interest rate advantage of the dollar. Additionally, geopolitical conflicts and oil price shocks would reinforce demand for the dollar as a safe haven. A breakout above 101 in the US Dollar Index could open up technical space for a rebound toward 109—consistent with recent trading patterns where energy-importing economies like Japan and South Korea face pressure from oil price shocks and their monetary authorities encounter greater exchange rate pressures.
For the stock market, a hot CPI does not simply spell ‘bearishness across the board’ but instead reshapes the internal structure of the market. If the CPI runs hot, overall valuations in the US stock market would be pressured by a higher discount rate, particularly affecting long-duration unprofitable growth stocks, AI-driven momentum favorites, and the most crowded segments of the semiconductor sector. However, energy, oil services, inflation hedges, and value stocks with strong cash flows and pricing power would relatively outperform. If the CPI is driven primarily by energy while core inflation remains mild and below expectations, the market may continue to bet on ‘upward revisions in earnings driven by the AI infrastructure boom and economic resilience’ to offset pressures, meaning the AI-driven bull market in global equities would remain intact. But if core CPI also shows significant heating, the stock market would transition into a more complex pricing environment characterized by ‘higher yield curves compressing valuations and inflation eroding profit margins.’