The United States and Israel launched military strikes against Iran on February 28, 2026. More than 1,000 Iranian civilians were killed, and at least 11 people in Israel and three in the United Arab Emirates were killed by Iran’s response, including six U.S. service members.
At times like this, talking about stock prices feels wrong. Still, markets keep moving, and investors must make decisions as things unfold. We cannot predict what President Donald Trump, Israel, Iran, or others in the region will do next. What we can do is look at similar moments in history to help guide our investment decisions.
Global oil prices surged by more than 30 percent after the attack on Iran. Oil had begun to rise in anticipation of military conflict; oil prices are up about 60 percent from their 2026 low. Much of those increases can be attributed to the effective shutdown of the Strait of Hormuz, a waterway adjacent to Iran through which one-fifth of the world’s oil supply and liquified natural gas passes.
I believe the best comparison is what happened in the U.S. markets after Iraq invaded Kuwait in 1990 and during the first Gulf War that followed. Following Iraq’s August 2, 1990, invasion of Kuwait, the U.S. led Operation Desert Shield, which was a rapid international response to defend Kuwait. After a United Nations-authorized deadline for Iraqi withdrawal passed on January 15, 1991, the U.S. began Operation Desert Storm on January 17. Kuwait was liberated by February 28, 1991.
During Gulf War I, the stock market focused less on daily battle updates and more on oil prices, recession risks, and the relief that followed the end the oil shock. Notably, the U.S. endured a recession during Gulf War I.
The key lesson from that time is not that stocks ignore war; they do not. Instead, markets react to how war affects oil, inflation, interest rates, confidence, clarity in decision-making, and recession risk. The war mattered to stocks because it changed the outlook for oil.
The U.S. economy before Kuwait
One of the most important considerations about the 1990–91 recession is that the U.S. economy was already weakening before Iraq invaded Kuwait on August 2, 1990. In fact, the recession officially began in July 1990, before the invasion.
By 1990, the long 1980s expansion was getting old: The Federal Reserve had tightened policy in 1988 and 1989 to cool inflation, and the federal funds rate had been near 10 percent in early 1989. It was still above eight percent in mid-1990; borrowing costs were high. The savings-and-loan crisis had damaged credit creation. Commercial real estate was under pressure. And household balance sheets were stretched.
Real GDP still rose through the first three quarters of 1990, but the pace was fading. Payroll growth had effectively rolled over; non-farm payrolls peaked in June 1990 and then began to fall. Unemployment was 5.2 percent in June 1990, 5.5 percent in July, 5.7 percent in August, and 5.9 percent by September. The economy was not falling apart, but it was softening.
The economic weakness of 1990 matters to investors because oil shocks hit the economy hardest when the economy is already fragile. A strong economy can handle a short-term rise in energy prices, but a struggling one, especially with high interest rates and tight credit, has a tougher time.
Why Americans still pay world prices
If the United States produces so much oil, why should Americans still pay for a Middle East oil shock? Oil is traded worldwide, and the U.S. is part of that global market.
The United States now produces more crude oil and petroleum liquids than any other country. That gives the U.S. more resilience than it had during the 1973 oil crisis. But that production does not let the U.S. opt out of global pricing. Crude prices are set on the world market (Brent crude prices are typically the global benchmark, and WTI crude prices are usually for oil produced in the U.S.). If supply through a critical chokepoint, such as the Strait of Hormuz, is disrupted, oil becomes more valuable to buyers everywhere.
Also, the U.S. still imports crude, especially heavier grades that many of its refineries are built to process. The U.S. exports some oil and petroleum products and imports others. So even with strong domestic production, domestic prices remain tied to world prices.
What pushed the U.S. into recession in 1990?
When Iraq invaded Kuwait, the world suddenly lost a meaningful chunk of oil supply. Brent crude had been around $15 a barrel in early July 1990. By October 11, it had surged to roughly $41. That was a violent move, even if it was briefer and smaller than the oil shocks of the 1970s.
Why do higher oil prices matter? According to Moody’s Analytics, every $1 increase in the price of a barrel of oil costs U.S. consumers $3 billion per year (assuming the $1 increase is sustained for 12 months). Before the February 28, 2026, strikes on Iran, Brent crude oil was trading around $70 per barrel (around $59 before it began to rise in anticipation of military conflict). As of the time of writing, it hit a high of about $93. That is a massive spike and, if sustained, would cost U.S. consumers $102 billion. Roughly half of that is felt through higher gasoline prices; every $10 increase in the price of a barrel of oil raises gasoline prices by 25 cents per gallon. But the cost increases do not stop at gasoline.
Airlines pay more for jet fuel. Trucking firms pay more for diesel. Manufacturers pay more to move inputs and finished goods. Heating and utility bills rise. And if consumers do not feel it immediately, it is because businesses are taking a hit to their profit margins. Confidence drops even as the economy cools and inflation rises; all of these are headwinds for stock prices.
That was the bind in 1990. The federal funds rate was about 8.15 percent in July 1990, still 8.20 percent in September, then finally 6.12 percent by March 1991. Policy eased, but it started from a high level and moved amid worsening confidence and banking stress. In 2026, there is less room to cut interest rates but, seemingly, a much healthier appetite to do so. That is a plus for stocks in 2026.
Unemployment continued to rise after the 1990–91 recession officially ended, reaching 7.8 percent in June 1992. The recession was brief on paper but did not feel short to the people living through it. Given that aggregate job creation has been a measly 14,000 per month since April 2025, I have been getting similar vibes—economic growth but rising unemployment (the unemployment rate has increased from 3.4 percent in April 2023 to 4.4 percent in February 2026). That is a negative for stocks in 2026.
How the market traded it
During the Gulf War I period, stocks dropped sharply when oil prices jumped. Then, the pattern reversed.
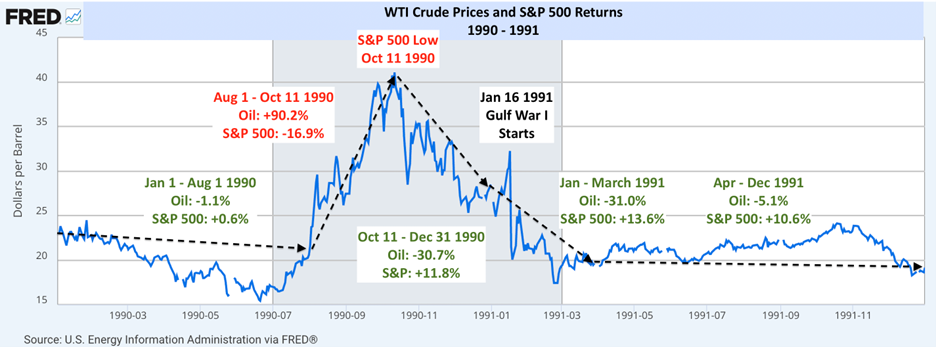
- In July 1990, the price of a barrel of WTI crude oil had hit a low of $15.
- From August 2, 1990, (the day Iraq invaded Kuwait) to October 11, 1990, WTI crude oil prices rose 90.2 percent, while the S&P 500 fell 16.9 percent. October 11 marked the peak in oil prices over the 1990–91 period, according to DataTrek.
- From October 11 through year-end 1990, oil prices fell 30.7 percent, and the S&P 500 rose 11.8 percent, per DataTrek.
- The Gulf War began on January 17, 1991. DataTrek points out that oil prices spiked briefly, but then, from January 1991 to March 1991, oil prices fell another 31 percent as the S&P 500 gained 13.6 percent.
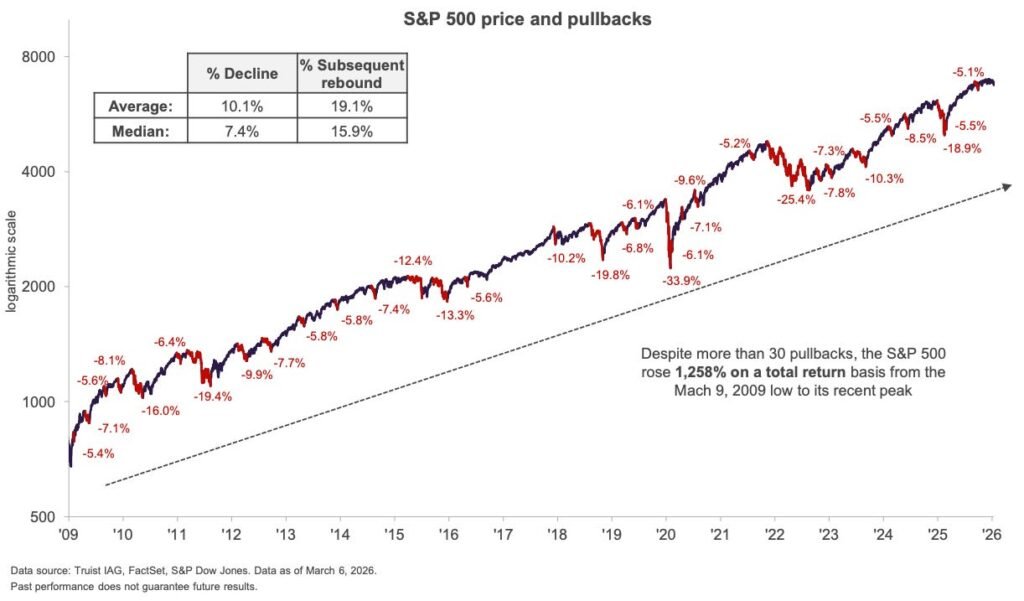
- Over the remainder of 1991, oil prices fell another 5.1 percent and the S&P 500 rose another 10.6 percent, per DataTrek (which annotated the graphic below).
In my weekly Insights video, recorded on February 28, 2026, I noted a few scenarios for the S&P 500’s possible decline in reaction to the attack on Iran. The scenarios included a pullback to the index’s 200-Day Moving Average (a mild six percent decline) as well as a decline to its pre-Liberation Day upside resistance (a 17 percent decline), in line with its 1990 decline. Will the 2026 economy, oil prices, and the stock market react similarly to 1990–91?
What 2026 looks like so far
So far, 2026 looks more like the opening chapter of 1990 than the whole book. But it is too early to tell how this will end; unfortunately, it is not looking like a happy ending. The oil market is showing major stress. The stock market is not yet panicking, but it is growing more concerned. A lid may be kept on outright panic, but stock prices can fall on “just” fear.
The oil derivatives market shows a similar pattern. Short-term volatility has jumped, but many of the 2027 Brent crude futures are still below $70 a barrel. This does not look like a market expecting a return to the energy crisis of the 1970s.
Still, the economic backdrop in 2026 is not especially friendly. Growth of Gross Domestic Product (GDP) slowed to a 1.4 percent annual rate in the fourth quarter of 2025, down from 4.4 percent in the third quarter. February payrolls fell by 92,000. Unemployment ticked up to 4.4 percent. Inflation, as measured by the December 2025 personal consumption expenditure (PCE) index, is 2.9%, well above the Federal Reserve’s target. (The most updated PCE was released just prior to publication and was expected to be slightly higher.)
The economy is weaker today than it was a year ago, but it does not seem to be in a GDP-defined recession. That is an important difference from 1990. Back then, the recession had already started before the invasion. In 2026, the U.S. appears to be entering this crisis during a slowdown, but not a full contraction. The questions, of course, are, “Will oil prices spike further, remain high, and cause a recession?” The answer to those questions will dictate what the stock market does from here.
Three paths from here
If history is any guide, the stock market’s medium-term path will depend less on how dramatic the headlines sound and more on how long oil stays high.
Potential Path #1 (A) — 40 percent odds: If the price of a barrel of Brent crude oil peaks near $120, stays in the three-digit range through March 2026, and then trends back toward $70 by 2027, that is the most manageable case. But it would still hurt.
Gasoline, diesel, and jet fuel would rise, and inflation expectations should prompt the Federal Reserve to pause any planned interest rate cuts.
But a temporary spike is not the same thing as an enduring oil shock. In that case, I expect a growth scare, but not necessarily a recession. The stock market could still correct into the high single digits or mid-teens from its peak, with the Nasdaq more volatile than the S&P 500.
Potential Path #1 (B) — 33 percent odds: Parallel to this path, if oil clearly breaks lower, stocks could stabilize and recover before the economy feels fully comfortable again, much as they did in early 1991. That would likely translate to the S&P 500 tracing its levels back to its 200-day moving average (roughly a six percent correction).
Potential Path #2 — 20 percent odds: If Brent peaks near $150, averages $100 or higher for the first half of 2026, and then trends back to $70 by 2027, the oil shock becomes economically consequential. Months of triple-digit oil would act like a meaningful tax on households and businesses. It would squeeze corporate margins, raise inflation risk, and materially increase the odds that a slowdown becomes a recession. In that world, corporate earnings estimates would likely decline considerably and credit spreads would likely widen (signaling default and recession). In that scenario, I expect the S&P 500 to behave more like a classic recession scare, with a drawdown of 20 percent to 30 percent from its high, and the Nasdaq likely performing worse.
Potential Path #3 — seven percent odds: If Brent peaks near $170, averages about $125 in the first half of 2026, and falls back toward $90 by 2027, that is an ugly case. A shock that large and that persistent would risk becoming a stagflation problem—slower growth, higher inflation, and the Federal Reserve that cannot easily ride to the rescue with rate cuts. In that case, I think recession odds become high (bordering on inevitable), a huge bear-market drawdown would be on the table, and the recovery would probably be slower than in 1991 because oil would still be too high in 2027 to give consumers and margins much relief.
Best guesses
Let’s not bury the lede—my best guess is something between Potential Paths #1 (A) & (B).
If I had to reduce the entire comparison to one practical conclusion, it would be this: In 1990 and 1991, the stock market did not need certainty about the war to recover. It needed confidence that the oil shock would not keep getting worse. That is what I would watch now.
For purposes of asset allocation, do not focus on the latest battlefield updates or the latest cable news theories. Pay attention to oil prices, whether shipping through Hormuz returns to normal, gasoline and diesel prices, inflation expectations, and changes in earnings forecasts.
In 1990, a weak economy met an oil spike and stocks fell hard. Then oil broke, and stocks recovered before the labor market did. In 2026, we have a slower but not yet recessionary economy facing an oil shock. So far, stocks are not behaving as if the worst case is inevitable.
My baseline is:
- Brent crude tops out between $119.50 and $150 per barrel (it reached $119.50 on March 8, 2026), maybe spending a few months vacillating that triple digit line;
- A 17 percent decline in the S&P 500 over a two- to four-month period (the Gulf War I replay);
- Oil prices linger in the $75 to $90 range in the second half of 2026;
- Clarity into the oil supply develops as the U.S. provides insurance, logistics, and military support in the Strait of Hormuz;
- Oil moves toward $70 in 2027;
- The Fed cuts rates at its June 2026 meeting;
- The U.S. economy escapes a technical recession (although the many people who cannot find work understandably won’t care about technicalities);
- Stocks regain their footing and the S&P 500 reaches new highs again by mid-2027.
My best guess is, admittedly, much more dire than history would suggest. Yes, my expectation is that stock market declines in line with the 199–91 Gulf War, as I do see that as the most logical comparison. But, according to RBC, the stock market’s reaction to military conflicts has been a mere six percent decline.
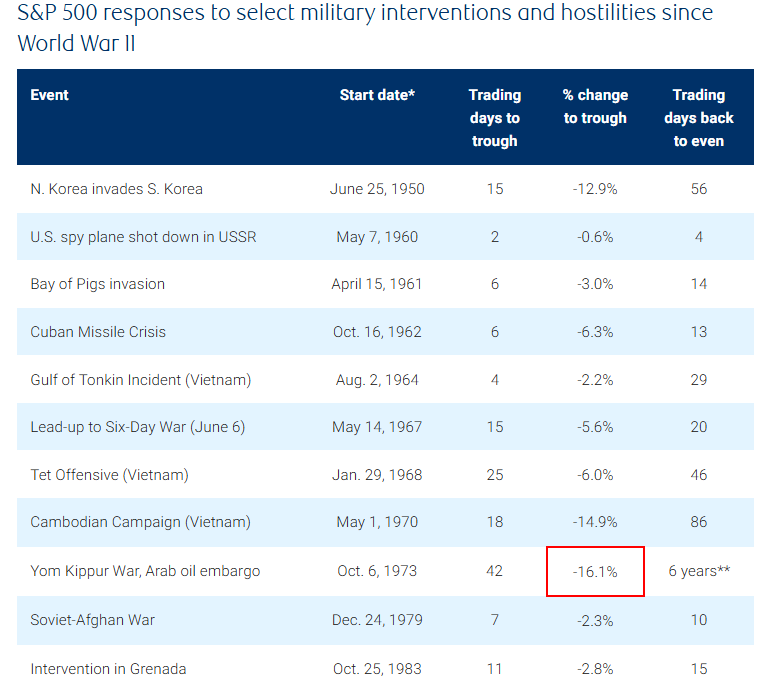
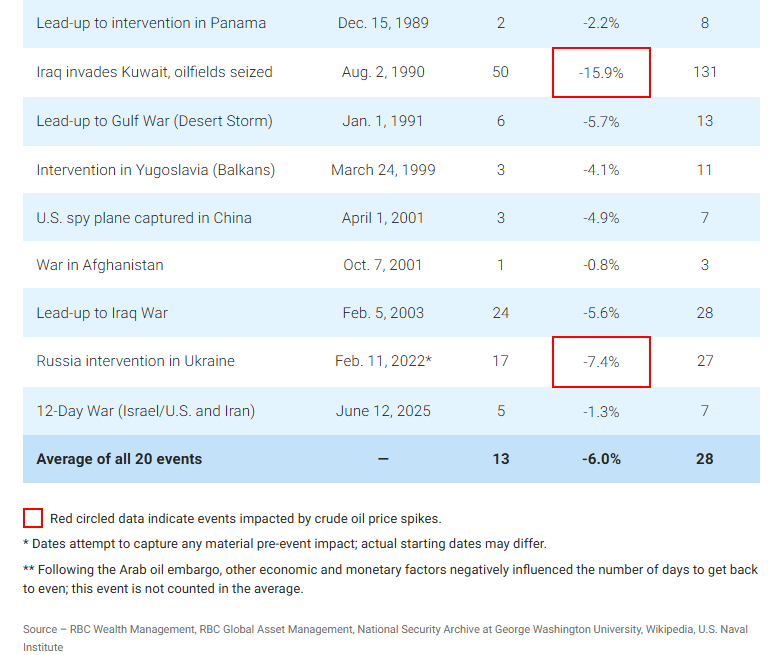
However, if the focus is on conflicts that materially impacted oil prices, the average decline has been 13.1 percent (making my guess of a 17 percent decline seem more realistic, unfortunately).
Could the decline in stocks be almost over? Sure. The U.S. has a plan to help exporters move oil out of the region, restoring supply shock fears, as I explain in some detail in this LinkedIn video from March 8, 2026. And there is a good chance of a Fed rate cut in June 2026. Those moves should buoy stock prices.
Could the outcome be worse for the stock market? Absolutely. If so, I will adjust my portfolios as necessary (so stay tuned!).
But I start with a baseline, and that baseline gets stock prices back to where they were. So, while I am not happy about violence and death, as an investor, I understand that the fee to potentially receive the rewards of being in the stock market is periods of uncomfortable volatility.
While it is certainly prudent, at times, to be out of the stock market and in cash, I remain invested, given that my baseline assumes a brief (but sharp!) pullback followed by higher stock prices in a fairly short period. Nobody wants to go through a correction—including me—but it is challenging to time the moment to get back into stocks once you are out because when prices do come back from those sharp pullbacks, they often rip higher faster than might be expected.
Nonetheless, I did make some changes to my portfolios. For several months, I have been reducing exposure to U.S. large-cap growth companies. I did so again recently and reinvested the proceeds into the State Street Regional Banking ETF (symbol: KRE) for my more aggressive portfolios (not that the industry itself is aggressive, but sometimes I reserve sector-specific investments for growthier objectives).
Scott Little pointed out the attractiveness of this investment, noting that the Federal Reserve will likely cut interest rates in the second half of 2026, which should lead to a steepening yield curve. A steepening yield curve (lower short-term rates and higher long-term rates) helps the profitability of regional banks. And, of course, the valuations are attractive, trading at around 13 times earnings, compared to 16 to 18 for big banks, and 21.2 for the S&P 500.
Allen Harris is an owner of Berkshire Money Management in Great Barrington and Dalton, managing more than $1 billion of investments. Unless specifically identified as original research or data gathering, some or all of the data cited is attributable to third-party sources. Unless stated otherwise, any mention of specific securities or investments is for illustrative purposes only. Advisor’s clients may or may not hold the securities discussed in their portfolios. Advisor makes no representation that any of the securities discussed have been or will be profitable. Full disclosures here. Direct inquiries to Allen at AHarris@BerkshireMM.com.