Chip Stocks are Now Repeating What Happened in 2001
Quick Read
SMH lost 18% in its worst week since September 2001, and NVIDIA, its largest holding, plunged 14% on Friday alone.
The chip crash is moving faster than 2000: a 42% drop took 151 days versus 214 then, but 2001’s failed rally is a warning.
XSD’s equal-weighted structure caps each top holding near 3%, so one company’s trouble can’t hurt it the way NVIDIA hurts SMH.
Released: The Definitive Guide to Retirement Income. It is a free guide from Fisher Investments covering what your retirement will really cost, where the cash flow should come from, and how much you can safely withdraw each year. Learn more here. Learn More Here › (sponsor)
The PHLX Semiconductor Index (SOX) closed at 8,408.59 on Friday, November 20, 2026, after falling 10.73% in that one session. It finished the week down 17.13% from its 10,146.32 close on November 13. That was the worst week for chip stocks since the week ended September 21, 2001.
24/7 Wall St.
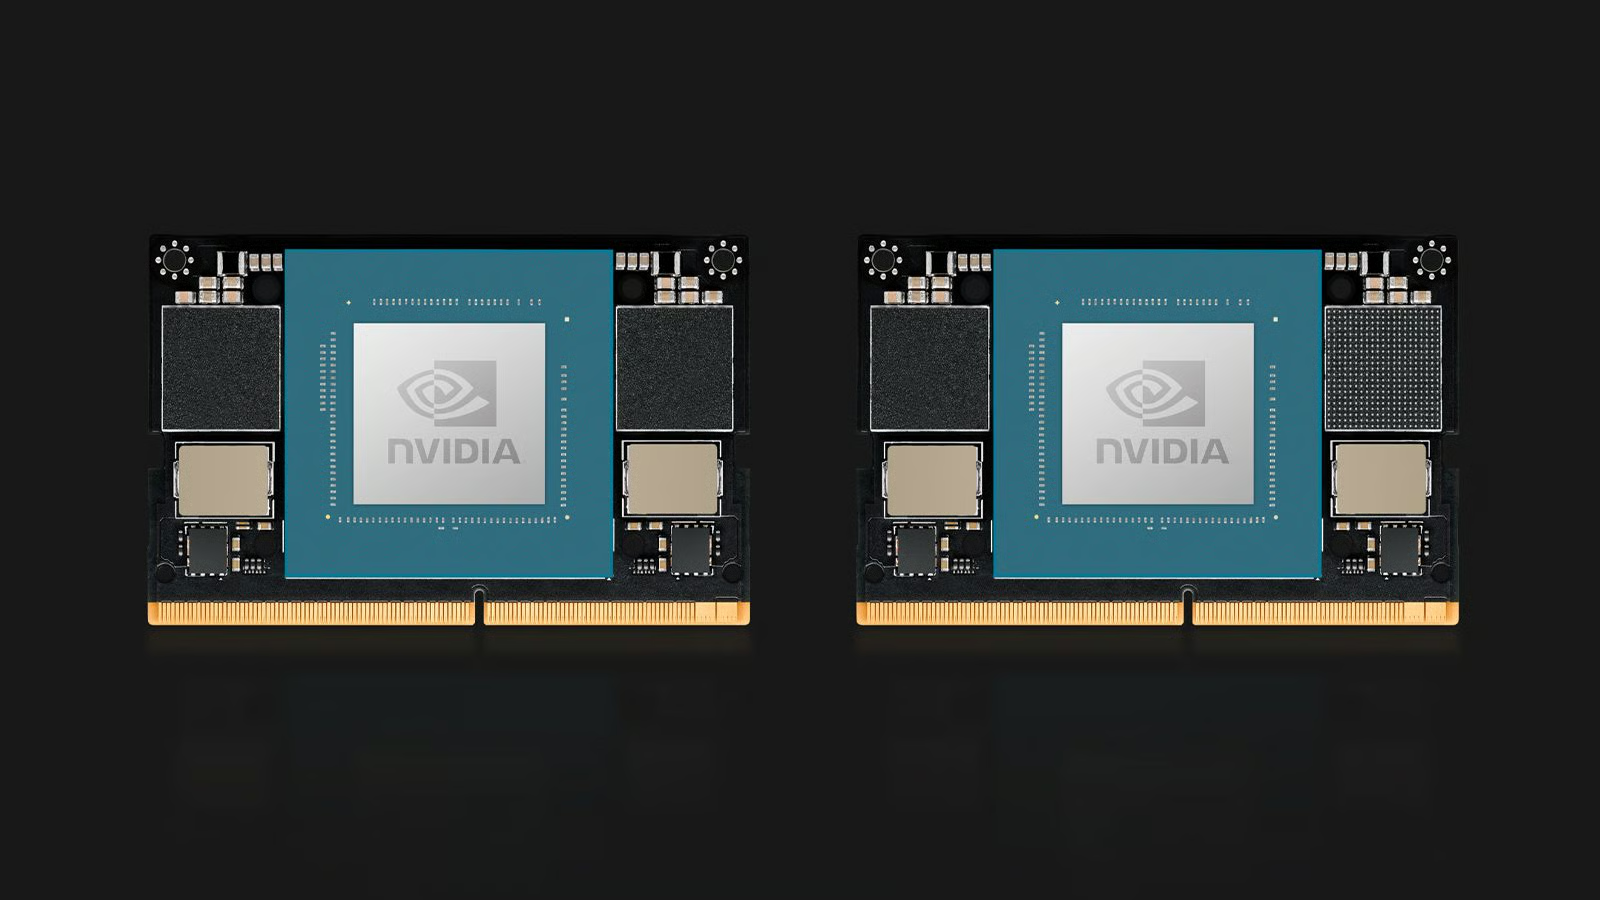
VanEck Semiconductor ETF (NASDAQ:SMH) closed at $400.06 and lost 17.8% for the week, its worst week since that same week in 2001. NVIDIA (NASDAQ:NVDA) is the fund’s largest holding, and it closed at $125.53 after a 14.01% drop on Friday.
For chip fund owners, this selloff tests whether a cycle that still makes money can absorb a sharp correction. The speed and size of the drop look a lot like 2001, but the profits behind today’s leaders are far larger than anything chip companies earned back then.
A Week Ranking Among the Worst Since 1994
This was the fourth-worst week in the index’s daily history back to 1994, and every worse week came as the dot-com bust extended: the -27.1% April 14, 2000 week opened the collapse, the -20.2% December 1, 2000 week compounded it, and the -25.2% September 21, 2001 week ended it.
U.S. markets were closed September 11 through 14, 2001. That week’s figure therefore compares the September 21 close with 509.15 on September 10, the last close before the attacks.
——
Now Available: The Definitive Guide to Retirement Income
Many successful investors eventually reach the same moment. The saving is done, the portfolio is built, and the question quietly changes from how much can I grow this to how much can I take out? Get that second question wrong and decades of good investing can come apart in a handful of years.
That is exactly what The Definitive Guide to Retirement Income helps answer. It covers what your retirement could actually cost, which income sources are worth using, and the withdrawal math that decides whether the money lasts. It is free today from Fisher Investments. Read More Here ›
——
Friday’s drop was the index’s fifth-worst day on record and its worst since a 12.25% fall on November 5, 2026, as selling did not let up.
Losses Spread Across the Whole Chip Group
Market analyst Jared Blikre counted 62 chip stocks that together lost about $1.5 trillion of market value on Friday alone. Blikre also found five AI hardware and cloud names, NVIDIA among them, that each fell more than 20% for the week.
Chips dragged broader indexes lower. The S&P 500 fell 3.70% to 6,910.39, and the tech-heavy Nasdaq Composite dropped 5.28% to 22,617.73.
The SOX peaked at 1,332.73 on March 10, 2000. By September 21, 2001, it was 71.4% below that high.
The index hit a low of 354.63 on October 2, 2001, then rallied 47% to 522.16 by December 31. The rally did not last, and the index made its final bottom on October 9, 2002, at 214.06, which was 83.9% below the 2000 peak.
The current decline has been faster. The index took 151 days to fall 42.5% from its June 22 record of 14,634.72, while the same drop took 214 days in 2000. A faster fall suggests traders unwound borrowed money and crowded positions quickly, which likely uses up the selling sooner, unless forced sellers remain. The harder question is when to step away from a mania before it breaks, which is the whole subject of our free bubble survivor’s handbook.
Why Today’s Leaders Stand on Firmer Ground
Matt Orton, a strategist at Raymond James, argued that today’s market differs sharply from 2000 because the fundamentals are very different. In 2000, many chipmakers traded on hope, while today’s biggest names earn large profits.
NVIDIA’s revenue for the third quarter of fiscal 2027 was $115.84 billion, up 103.2%, and net income was $65.29 billion. For the fourth quarter, the company guided to revenue of $130.0 billion, plus or minus 3%.
NVDA Earnings Explorer — 24/7 Wall St.
Bulls still have to show that AI chip demand holds up. Three direct customers accounted for 14%, 11% and 11% of NVIDIA’s quarterly revenue. Jensen Huang has also resigned as CEO, and SEC enforcement staff are reportedly examining Nvidia’s accounting practices, although no misconduct has been established.
Even after the selloff, the SOX is up 18.7% for 2026 from its 7,083.13 close at the end of 2025, which shows how far the rally had run before the selloff.
What SMH Holders Should Weigh After the Selloff
SMH carries specific risks at $400.06. The 2001 record shows that a sharp rally after a crash can fail. This fund also puts more than 19% of its assets in one company that is searching for a CEO and faces a reported SEC review.
Chip earnings are far stronger than they were in 2001, so the sector’s earnings base remains far stronger, but SMH puts so much of that exposure in one stock.
State Street SPDR S&P Semiconductor ETF (NYSEARCA:XSD) offers a different structure, because it tracks a modified equal-weighted index. On its latest fact sheet, its largest positions each held about 3% of assets, so trouble at one company cannot hurt it the way NVIDIA hurts SMH.
The view is wrong if the SOX closes back above 10,146.32 before NVIDIA’s next quarterly filing explains the SEC matter. That filing is worth reading closely for anyone considering concentrated chip exposure.
Released: The Definitive Guide to Retirement Income
(Sponsor) Most people spend their entire working lives focusing on one thing: growing a pile of money. Then they retire and discover the skill they actually need is close to the opposite. Turning that pile into steady income, year after year, through good markets and bad, without ever running out.
It may be the least discussed and most consequential transition in personal finance, and plenty of otherwise careful investors walk into it with no real plan. That is exactly what The Definitive Guide to Retirement Income helps answer. It is a free guide from Fisher Investments covering what your retirement will really cost, where the cash flow should come from, and how much you can safely withdraw each year. Learn more here. Learn More Here ›
AI stocks with strong fundamentals should rebound quickly from a market crash. By Ryan Vanzo – Nov 21, 2026 at 1:27PM EST Many of the world’s most valuable companies today are artificial intelligence (AI) stocks. That’s for good reason. The global AI opportunity is truly massive, and many AI hyperscalers are already quite profitable. But
Bear markets can present great buying opportunities. By David Dierking – Nov 21, 2026 at 10:45AM EST With the S&P 500 (^GSPC -3.70%) and Nasdaq-100 down 6% and 13% from their all-time highs, respectively, a lot of investors are starting to wonder if a bear market is imminent. Obviously, there’s no sure way to answer
The company is going through a very difficult time. By Will Ebiefung – Nov 21, 2026 at 1:15PM EST Key Points Nvidia is going through one of the most uncertain periods in its history, with a huge leadership shakeup. Shares have dipped, but investors should think twice before buying. November has been absolutely terrible for
Is Micron’s low valuation an attractive entry point? By Adam Levy – Nov 21, 2026 at 9:15AM EST Key Points Pricing improvements are driving profit growth across the memory chip industry. Production is set to ramp up across the industry by late 2028. The earnings downcycle could be massive despite efforts to stem future losses.
On Nov. 12, Nvidia (NASDAQ:NVDA) founder and chief executive officer Jensen Huang resigned from his post after a series of extramarital affairs (including one with an alleged Chinese spy) came to light. To make matters worse, the U.S. government is now investigating some of the company’s customers in Southeast Asia to determine whether advanced artificial
Nvidia is searching for a new CEO following Jensen Huang’s abrupt resignation. By Adam Spatacco – Nov 20, 2026 at 6:42PM EST Key Points Nvidia co-founder Jensen Huang resigned as CEO amid scandals involving extramarital affairs and potential relationships with Chinese intelligence. In recent history, several big tech companies replaced CEOs — each of which
The stock market’s $1.5 trillion powder keg may be about to blow. By Sean Williams – Nov 21, 2026 at 9:06AM EST Key Points The Dow Jones Industrial Average, S&P 500, and Nasdaq Composite have powered higher over the last four years, with the AI revolution doing a lot of the heavy lifting. Wall Street’s
There’s a lot of concern over what the future holds for Alphabet (NASDAQ:GOOG) (NASDAQ:GOOGL). The internet company has transformed from an asset-light business into an extremely asset-heavy business, as it and its hyperscaler peers are set to spend trillions of dollars building new data centers for artificial intelligence over the next few years. That shift
Image source: Getty Images Since selling Legal & General a couple of months ago, I’ve been searching for a new income stock. While I see a handful of potential candidates, there are some I’m keen to avoid. Here are three of them from the FTSE 100. A clear guide to Anthropic’s IPO (without the hype)
Stocks got hit hard this week amid fears that the AI trade could be buckling. Spencer Platt/Getty Images hide caption toggle caption i Spencer Platt/Getty Images A yearslong AI boom showed signs of unraveling this week in spectacular fashion. AI-related stocks have powered markets to record highs and helped support the broader economy. But investors
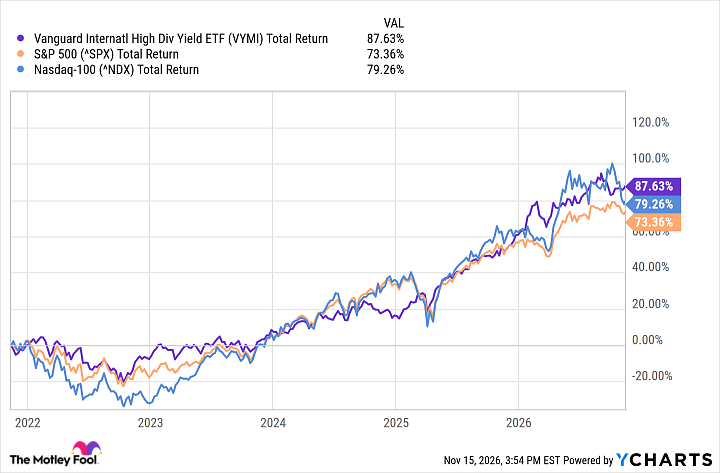
The Vanguard International High Dividend Yield ETF (VYMI) holds 1,502 stocks from financially strong, dividend-paying companies around the world. This fund has delivered strong enough annualized returns to double your money fast. By Ben Gran – Nov 21, 2026 at 5:49AM EST Key Points The Vanguard International High Dividend Yield ETF (VYMI) has outperformed the
The stock market has endured some of its most volatile days in history under President Donald Trump. Nevertheless, the iconic Dow Jones Industrial Average (DJINDICES:^DJI), benchmark S&P 500 (SNPINDEX:^GSPC), and tech-fueled Nasdaq Composite (NASDAQINDEX:^IXIC) have averaged higher returns under Trump than under most other presidents since the late 1890s. Some of this outperformance can be
Image source: Getty Images A recent pullback has dragged BAE Systems‘ (LSE: BA.) shares into crash territory. The share price is now down 20.7% from a high earlier this year. But this is a company that has been thriving. The many billions being pumped into defence budgets have sent the order backlog to record levels,
When the European Central Bank shuffles its top seats while inflation holds at 4% and questions swirl around French debt, bond markets do not sit quietly. Pricing of risk can reset fast, and with it the outlook for large Eurozone financials tied to rates and sovereign yields. This article examines how that shockwave affects three
Another 7.5% fall would send the index into a bear market. Which battered giant would I buy first? By Daniel Sparks – Nov 20, 2026 at 10:57PM EST Key Points The Nasdaq Composite ended around 13.5% below its October record on Nov. 19. Alphabet’s revenue growth has picked up in every quarter of 2026, hitting
If you only skimmed Ranpak’s latest update, modest revenue growth and a smaller quarterly loss might look like progress. For Ranpak shareholders, the loss from the start of the year was 51.7%, including dividends. That gap between improving results and a steep hit to capital raises a blunt question. If you had put money to
Amphastar Pharmaceuticals has seen its share price move around in recent years, and the question now is whether the current valuation can be squared with what the business earns. For anyone following the stock, the key issue is how that earnings profile stacks up against the price on the screen today. Over the past 3
Quick Read Nebius closed at $81.31 on Friday, down 16%, its fourth-worst day since October 2024 and 72% below its $286.69 record on June 18. The stock is down 47% in seven trading days since its Nov. 12 earnings report and down 3% for 2026. Michael Burry posted on X Thursday afternoon: “Coreweave, Nebius, NVIDIA,
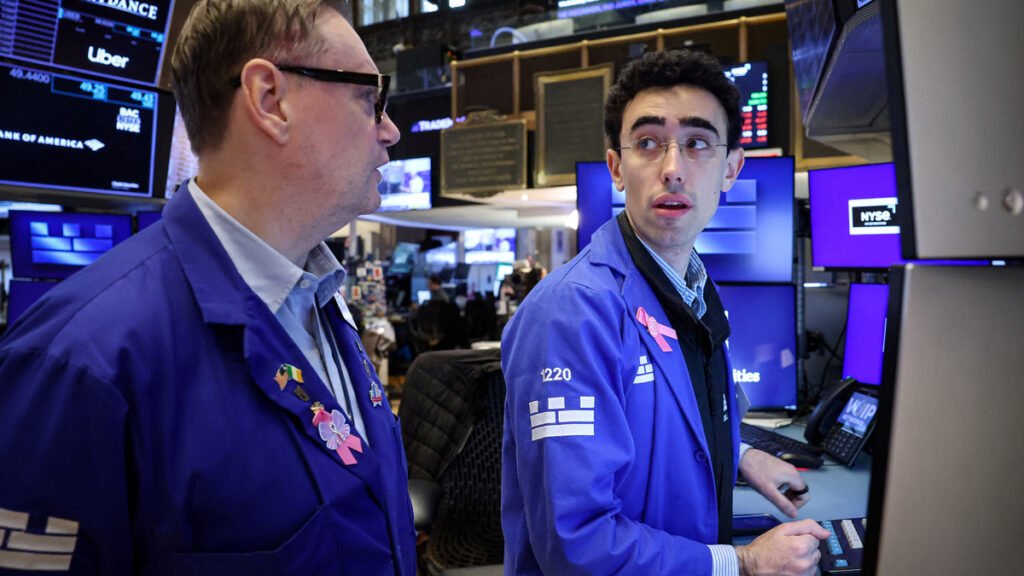
Traders work on the floor at the New York Stock Exchange (NYSE) in New York City, US, November 18, 2026. REUTERS/Brendan McDermid Brendan McDermid Reuters NEW YORK, Nov 20 (Reuters) – Investors next week will focus on consumer spending, looking for evidence that a broadly solid economy can help calm a US stock market unsettled