Daily Market Price Updates and Commentary 16th November 2026


ICE Futures U.S. Sugar No.11 Contract

Settlement (cUS$/lb) Open High Low Last Volume O/I Life High Life Low
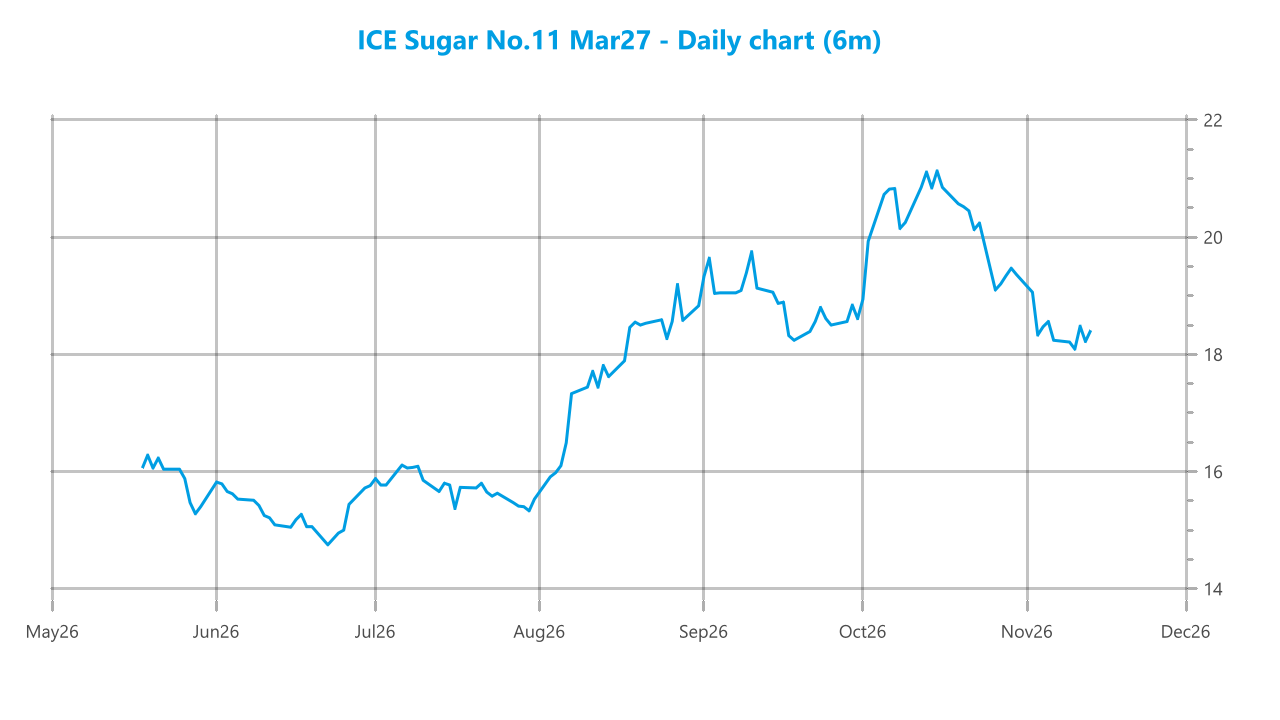
Mar27 18.10 -0.31 ▼ 18.41 18.43 18.07 18.10 53,922 544,768 21.29 14.42
May27 17.59 -0.32 ▼ 17.93 17.93 17.56 17.59 19,654 225,320 20.40 14.29
Jul27 17.26 -0.30 ▼ 17.56 17.56 17.23 17.24 18,502 147,699 19.81 14.27
Oct27 17.29 -0.27 ▼ 17.56 17.57 17.25 17.27 10,359 97,535 19.63 14.45
Mar28 17.67 -0.24 ▼ 17.91 17.91 17.63 17.64 3,524 59,850 19.83 14.97
May28 16.63 -0.26 ▼ 16.85 16.89 16.59 16.59 1,742 26,826 18.77 14.82
Jul28 16.08 -0.29 ▼ 16.33 16.37 16.05 16.05 1,555 20,122 18.10 14.74
Oct28 16.03 -0.29 ▼ 16.29 16.33 15.99 15.99 1,292 17,529 17.91 15.01
Mar29 16.46 -0.29 ▼ 16.72 16.77 16.44 16.44 925 7,248 18.19 16.20
May29 16.09 -0.30 ▼ 16.34 16.38 16.10 16.10 591 3,156 17.74 16.02
Jul29 15.91 -0.29 ▼ 16.17 16.20 15.91 15.91 429 4,261 17.50 15.91
Oct29 15.96 -0.30 ▼ 16.22 16.22 15.96 15.96 61 82 16.30 15.96
Total               112,556 1,154,396    

*Volume includes exchange for physicals.


ICE U.S. Sugar No.11 – Spreads

Date Spread Date Spread
Mar27 / May27 0.51 Oct27 / Mar28 -0.38
Mar27 / Jul27 0.84 Oct27 / May28 0.66
Mar27 / Oct27 0.81 Mar28 / May28 1.04
Mar27 / Mar28 0.43 Mar28 / Jul28 1.59
May27 / Jul27 0.33 May28 / Jul28 0.55
May27 / Oct27 0.30 May28 / Oct28 0.60
Jul27 / Oct27 -0.03 Jul28 / Oct28 0.05
Jul27 / Mar28 -0.41 Jul28 / Mar29 -0.38


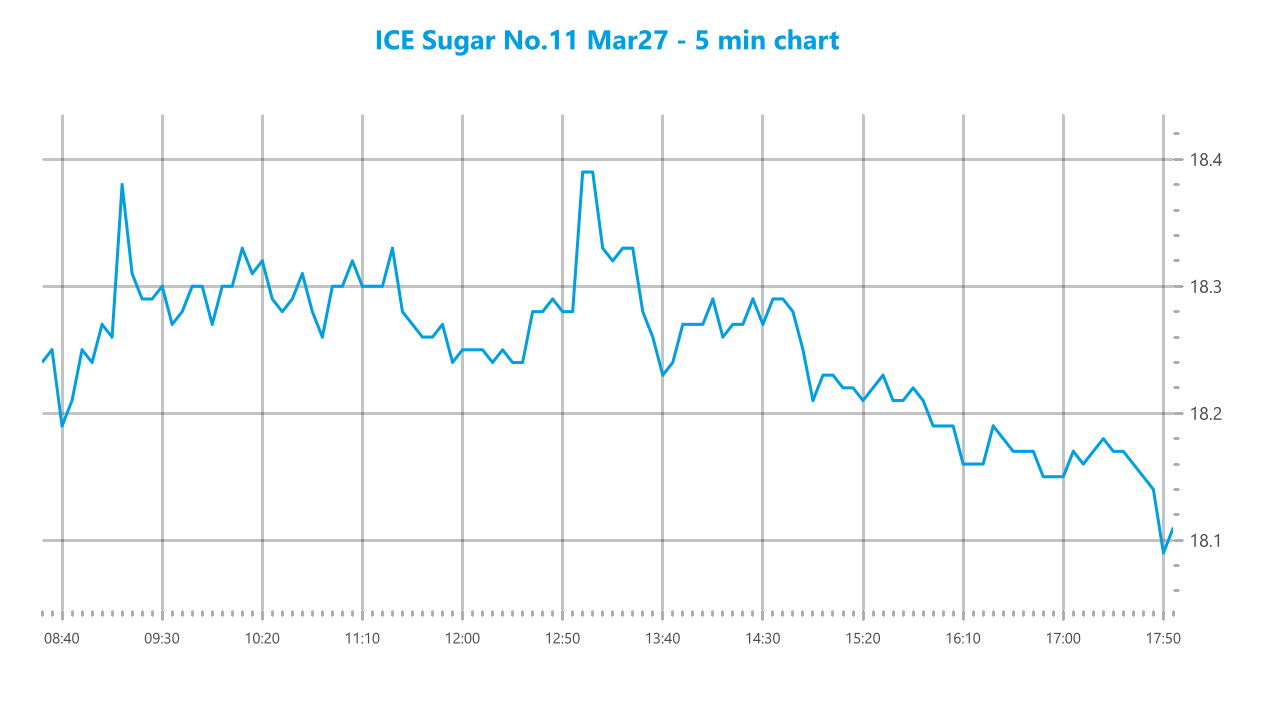
The week started poorly with pressure immediately applied to the March’27 contract, sending the price back to a low at 18.16 within the first 20 minutes. While there was a recovery soon after which peaked at 18.38 the tone had been set for another day within the broad 18.00/18.50 band that has prevailed over recent days and proved difficult to break. Through the rest of the morning the price did not venture far either side of 18.30, and while there was a brief bounce to 18.40 against early US interest the afternoon continued in the same way. A little more pressure was applied later in the afternoon and the lows extended to 18.13, possibly with some selling arriving against the weakening USDBRL, though volumes remained light and so recent lows never looked likely to come back into view. There was one final extension to the range during the last ten minutes as MOC pressure arrived, and while its impact was less than that seen for the whites it did mean a settlement at 18.10 that keeps the recent lows in range, though see-saw activity over recent days implies there is no reason to believe the price will crumble. 


ICE Europe White Sugar Futures Contract

Settlement (US$/mt) Open High Low Last Volume O/I Life High Life Low
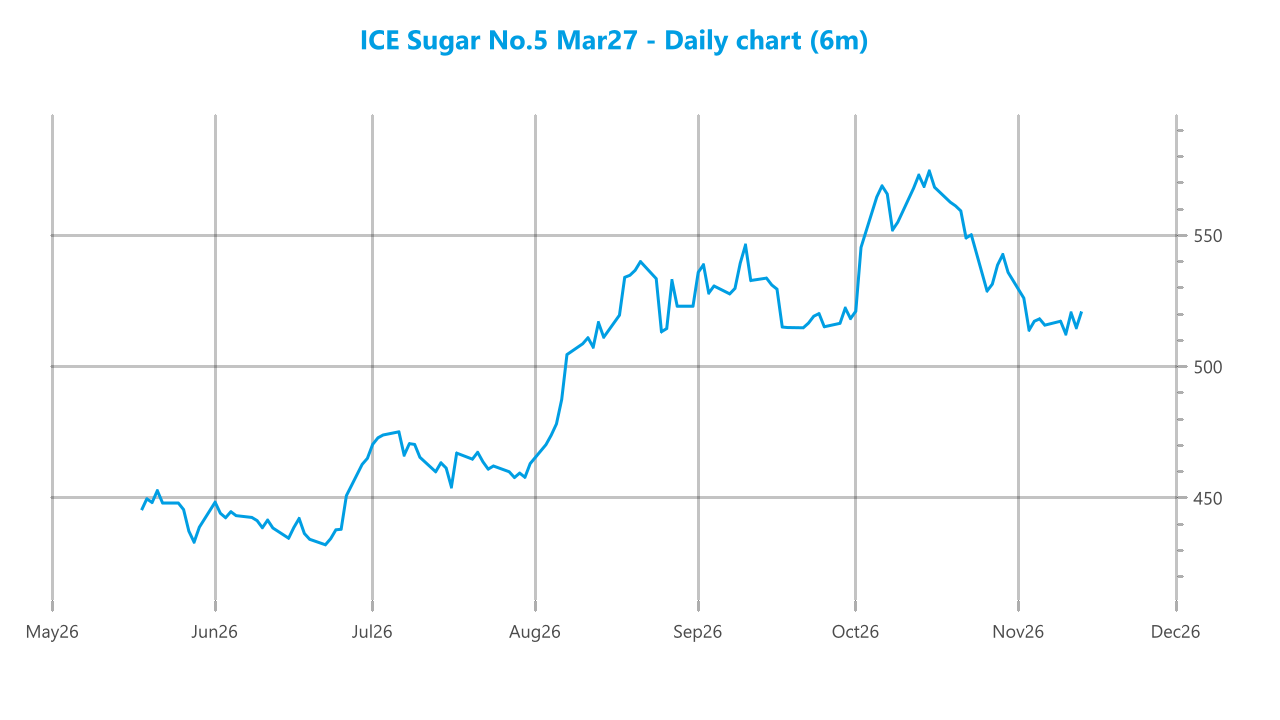
Mar27 510.50 -10.50 ▼ 516.80 519.80 509.50 510.80 7,982 71,249 577.40 398.00
May27 513.00 -9.00 ▼ 517.60 520.80 512.20 513.50 3,783 31,823 581.80 401.40
Aug27 509.80 -7.10 ▼ 512.80 516.60 509.30 510.40 2,938 18,254 574.30 404.30
Oct27 505.60 -5.70 ▼ 508.80 512.20 505.20 506.00 1,001 9,211 565.30 408.20
Dec27 503.00 -4.80 ▼ 505.00 509.30 503.00 503.10 331 4,271 558.20 414.30
Mar28 502.20 -4.60 ▼ 503.80 507.80 503.20 503.30 37 982 552.60 421.00
May28 495.10 -4.40 ▼ 499.30 499.30 495.70 495.80 10 893 542.80 426.30
Aug28 486.00 -3.80 ▼ 489.60 489.60 486.00 486.00 8 628 529.90 431.10
Oct28 479.10 -1.50 ▼ 486.00 489.60 484.70 489.60 26 103 520.00 441.70
Dec28 478.60 0.00   489.30 490.10 488.00 488.00 22 35 518.10 468.60
Mar29 480.00 -33.80 ▼ 517.10 517.10 517.10 517.10 1 7 517.10 483.20
May29 477.30 -0.40 ▼ 474.20 475.60 474.20 475.60 3 7 517.50 473.60
Aug29 474.40 —   — — — — — — — —
Oct29 468.40 —   — — — — — — — —
Total               16,142 137,463    

*Volume includes exchange for physicals.


ICE Europe White Sugar – Spreads

Date Spread Date Spread
Mar27 / May27 -2.50 May27 / Aug27 3.20
Mar27 / Aug27 0.70 Aug27 / Oct27 4.20
Mar27 / Oct27 4.90 Oct27 / Dec27 2.60
Mar27 / Dec27 7.50 Dec27 / Mar28 0.80


White Sugar Premium

Date Premium Date Premium
Mar27 / Mar27 111.46 Jul28 / Aug28 131.50
May27 / May27 125.21 Oct28 / Oct28 125.70
Jul27 / Aug27 129.28 Mar29 / Mar29 117.12
Oct27 / Oct27 124.42 May29 / May29 122.58
Mar28 / Mar28 112.64 Jul29 / Aug29 123.64
May28 / May28 128.47 Oct29 / Oct29 116.54

*Values calculated basis 6:15 PM.


Opening trades were as low as $514.10 for March’27 as buyers retreated in reaction to No.11 prices, though buying / short covering soon followed and we climbed back up through the teens. Activity then settled down and a slow morning ensued in which prices held inside the early parameters, not even finding a hint of interest to test at either end. The situation maintained through a large part of the afternoon also, and it was only with a couple of hours remaining that some new selling emerged and extended the range a little lower. Scale buying from consumers meant that the price extension was gradual, and with much of the selling emanating from smaller traders against zero fresh news, the recent $507.00 low remained comfortably out of reach. More aggressive selling around the close did push the price back to $519.50, and with settlement made only a small way above this mark at $510.50 might we see another downside test at least tomorrow?

As reported on Friday, the Dec’26 expiry drew a tender of 4,898 lots (244,900 mt).


Market chart asset


Market chart asset


Market chart asset


A man with short brown hair and glasses, wearing a light striped shirt, is smiling and looking slightly to the left in an indoor setting. Other people are blurred in the background.

Jon Whybrow

Jon joined CZ in 1991, working in the Treasury department before moving to join the derivatives team in 1994. Over 30 years Jon has built up significant experience across derivatives markets and products, particularly sugar, and is now Head of Flow derivatives providing market execution services for CZ’s global client base. He is responsible for the market commentaries which are published each day on CZ app.


More from this author

Source link

Visited 1 times, 1 visit(s) today

Related Article

Prediction: A Stock Market Crash Is Coming Eventually. Here’s What Investors Should Do Based on What Happened in the Last 3 Crashes.

Over the last few years, both the S&P 500 (^GSPC -1.26%) and Nasdaq Composite (^IXIC -1.94%) have benefited enormously from enthusiasm surrounding artificial intelligence (AI). History suggests a downturn is inevitable at some point, though. While this doesn’t mean a crash is coming tomorrow, one useful valuation metric suggests investors should prepare for the possibility

Ambu A/S : TRANSACTIONS UNDER AMBU’S SHARE BUYBACK PROGRAM

Real-time Estimate 08:52:36 2026-11-16 am EST 5-day change 1st Jan Change 92.10 DKK +0.49% +5.81% +4.49% Published on 11/16/2026 at 06:05 am EST Publicnow English Published: 2026-11-16 11:59:02 CET Ambu A/S – Changes in company’s own shares TRANSACTIONS UNDER AMBU’S SHARE BUYBACK PROGRAM 16.11.2026 11:59:02 CET | Ambu A/S | Changes in company’s own shares

S&P 500 Risks 15% Drop Due to an Unsustainable Divergence, Strategist Says

The pain in AI stocks may stretch on for a while, one longtime strategist is warning. Jim Paulsen, the former chief investment strategist at The Leuthold Group, says he sees a deeper stock correction looming, even as the market aims to regain its footing after a brutal sell-off in Nvidia jolted investors this week. Paulsen

Warren Buffett’s Successor, Greg Abel, Just Dropped a $426 Million Bombshell on Wall Street

This has been a year of immense change for Berkshire Hathaway (NYSE:BRKA)(NYSE:BRKB), the trillion-dollar conglomerate that Warren Buffett built. Following the Oracle of Omaha’s retirement as CEO on Dec. 31, oversight of the company’s day-to-day operations and its closely monitored $368 billion portfolio fell to his successor, Greg Abel. During the first quarter, Abel wasted

Nvidia stock slides as investors weigh Jensen Huang resignation

Nvidia‘s stock continued its slide on Monday, after the chip giant lost hundreds of billions in market cap last week amid the fallout from Jensen Huang resigning as CEO. The company was 2.16% down in premarket trading on Monday. Huang resigned from Nvidia, the company’s board announced on Thursday, after mounting scrutiny following reports that

Buy Alert: 5 Stocks Analysts Upgraded on Thursday

Wall Street’s third-quarter earnings season is nearly over, and the profit numbers are large. With about 88% of S&P 500 companies reported as of November 10, earnings are tracking 31.4% above a year earlier, according to FactSet. That would be the third straight quarter of growth above 25%. On November 10, inflation took over the

Stocks Decline in Asia as Investor Concerns Over Nvidia Fallout Extend Into Another Week

Those worries have spread to Asia, where AI hardware stocks are prominent on markets including in South Korea and Japan. South Korea’s benchmark Kospi index lost 2.8% to 5,142.84. Shares fell for memory chipmaker SK Hynix and Samsung Electronics, two of its most valuable companies. SK Hynix plummeted 5.5%, while Samsung Electronics gave up 3.2%.

External shocks don’t alter A-share long-term case

AI/CAI MENG/CHINA DAILY Recent volatility in overseas technology shares has shown once again how quickly changes in global risk appetite can travel across markets. Concerns about inflation, the cost of financing artificial intelligence investment and the returns on large-scale computing projects have prompted investors to reassess valuations. When tech stocks are crowded trades, leveraged positions

GLOBAL MARKETS CALL: Central Banks Are Tightening

The global AI trade should make a nice comeback now that the latest issue of The Economist sees the bottom falling out of it: The weekly financial magazine, famous for its contrarian cover stories, also recently picked the top in global bond yields when it ran a cover story titled “Will bonds blow up?” in

Is SpaceX Stock Worth Buying and Holding for 10 Years?

Space Exploration Technologies (SPCX -0.59%) has grand ambitions: revolutionizing space travel, making space tourism commonplace, building a human colony on Mars, among others. The rocket company has taken incremental steps toward these goals since it became a publicly traded corporation in June, but its stock has been volatile. It has actually declined from its opening-day

Bloom Energy Is Down 43% From Its High. Should You Buy the Dip?

Bloom Energy (BE -4.92%) had a knockout third quarter, with growth on all sides of its business. Third-quarter revenue came in at $1.24 billion, up 138% year over year, and full-year 2026 guidance was raised again, this time to a range of $4.4 billion to $4.6 billion. Bloom announced another major deal, this one with

0
Would love your thoughts, please comment.x
()
x