Dalal Street Week Ahead: Can Nifty bulls overcome key resistance levels?

The Indian equity markets spent the week consolidating their recent gains and ended on a positive note. Following a remarkable rally of over 1,900 points in the preceding week, the Nifty did not witness any meaningful retracement and instead moved within a relatively defined range. The Index oscillated in a 585-point range, and despite some intermittent selling pressure, the Nifty managed to hold on to most of its recent advances and maintained a constructive undertone. Volatility cooled during the week, with India VIX declining by 4.87% to 16.62. The headline Index ended the week with a net gain of 113.95 points (+0.46%).

ET CONTRIBUTORS

The Nifty’s current technical structure remains positive. Although a sharp rebound from the vicinity of the 200-week moving average has significantly improved the near-term technical setup, the Index is near its overhead resistance area. Importantly, following the magnitude of the recent rally, the absence of any meaningful retracement is itself a sign of underlying strength. Even if the Nifty undergoes a modest corrective move or continues to consolidate sideways, such price action would remain technically healthy, as it would allow the markets to digest the sharp advances witnessed over the past month without materially damaging the improving chart structure.

The coming week is likely to see a stable to cautiously positive start, with the levels of 25,425 and 25,550 likely to act as immediate resistance points. On the lower side, supports are expected at 24,850 and 24,600.

The weekly RSI stands at 61.71 and has moved firmly into bullish territory. It stays neutral and does not show any divergence against the price. The weekly MACD is bullish and stays above its signal line.

From a pattern-analysis perspective, the Nifty has staged a strong recovery after testing the lower boundary of a broad consolidation structure and the long-term moving-average support zone. The recent rebound has carried the Index back above its 50-week moving average, currently at 24,259, and its 100-week moving average, placed at 24,321. The 200-week moving average, currently at 22,772, continues to rise and reinforces the longer-term structural support. The Index is now approaching the upper boundary of a broad trading range that has remained relevant over several quarters. As long as the Index maintains itself above the 24,250–24,320 zone, the broader recovery structure is likely to remain intact.


For the coming week, instead of blindly chasing the upmove, the market participants would be better served by maintaining a cautiously optimistic but disciplined approach. The sharp advance over the past few weeks has brought the Nifty closer to a significant resistance area, making the risk-reward equation relatively less attractive for indiscriminate fresh purchases at higher levels. Existing positions may be held with appropriately trailed stop-losses, while fresh exposures should preferably be restricted to stocks displaying strong relative strength and strong technical setups.

Any shallow corrective moves or sideways consolidation should not necessarily be viewed negatively, provided the important support levels remain protected. The coming week is best approached with selective buying, disciplined protection of profits.In our look at Relative Rotation Graphs®, we compared various sectors against the CNX500 (NIFTY 500 Index), representing over 95% of the free-float market cap of all the listed stocks.

2ET CONTRIBUTORS
3ET CONTRIBUTORS

The Relative Rotation Graph (RRG) shows that the Nifty Financial Services Sector has rolled into the leading quadrant. Besides this, the IT Services Sector, BankNifty, Media, and Pharma sector Indices are also inside the leading quadrant. These groups are likely to relatively outperform the broader Nifty 500 Index.

The Nifty Realty Index is the only sector index in the weakening quadrant. However, that is also seen improving its relative momentum against the benchmark.

The Nifty Energy, Midcap100, Auto, and Metal Indices are inside the lagging quadrant.

These groups may relatively underperform the broader markets. The FMCG, PSE, and Infrastructure Sector Indices are inside the improving quadrant of the RRG.

Important Note: RRGTM charts show the relative strength and momentum of a group of stocks. In the above Chart, they show relative performance against the NIFTY500 Index (Broader Markets) and should not be used directly as buy or sell signals.

Source link

Visited 1 times, 1 visit(s) today

Related Article

Is It Too Late to Buy Micron Stock?

What you think about Micron Technology (MU -2.52%) could depend on how you view the proverbial glass of water, either half-full or half-empty. The half-full side would point to Micron’s impressive year-to-date gain of more than 150%. The half-empty folks would quickly add that the memory chip stock has plunged 40% since late June. Some

Dhampur Bio Organics board approves Rs 50 crore open market share buyback

Representational image (Photo: ANI) The board of Dhampur Bio Organics Limited has approved a buyback of equity shares worth up to Rs 50 crore through the open market route, at a maximum price of Rs 200 per share, according to a stock exchange filing. The proposal still needs shareholder approval. The company said the buyback

Should You Buy Nvidia Stock Before Nov. 17?

All eyes were on Nvidia (NASDAQ:NVDA) this past week as the company’s leadership crisis quickly spiraled from a board investigation to the resignation of Jensen Huang as CEO. Investor attention is likely to remain on the AI chip leader this coming week, and it’s not just because there are so many questions now that Huang

Inside Jim Cramer’s Charitable Trust: 5 Stocks He Actually Owns

Jim Cramer started his Charitable Trust in 2005 with $3 million of his own money. According to CNBC, Cramer’s own investment is at risk, and the trust distributes its investment income and realized capital gains to charity. The CNBC Investing Club gives subscribers a way to follow that portfolio. Members can see how much of

Why Advanced Micro Devices Stock Is Down Today

Advanced Micro Devices (AMD -8.75%) stock is sinking, down 10.8% as of 1:20 a.m. ET on Friday, Nov. 13, as the chip sector sells off amid the developing scandal at rival Nvidia (NVDA -2.01%). The S&P 500 (^GSPC -0.40%) and the Nasdaq Composite (^IXIC -0.91%) were down 0.8% and 1.3%, respectively. AMD – Advanced Micro

Wall Street Is Writing Off Nvidia Stock. Here’s Why That’s a Mistake.

Nvidia (NVDA -2.01%) shares currently face a litany of headwinds. The first challenge has been a correction across AI stocks. Not every AI stock has been targeted. But many industry suppliers have seen their share prices slashed by 10%, 20%, or even 30% in recent weeks. Both Alphabet (GOOG -0.96%)(GOOGL -0.98%) and Meta Platforms (META

5 Multibagger Stocks to Buy According to Wall Street

Wall Street’s AI trade just had one of its worst weeks in years. Politics and inflation hit it at the same time. The Nasdaq Composite posted its deepest one-day drop since April 2025 last week, after Democrats swept the midterm elections and investors began weighing tougher scrutiny of AI and limits on data center construction.

Forget the “Magnificent Seven.” Berkshire Hathaway Could Be the Better Long-Term Bet.

The Magnificent Seven stocks have not been so magnificent as of late. The Roundhill Magnificent Seven ETF (MAGS -0.29%), which invests exclusively in those seven mega-caps dubbed magnificent, has underperformed the S&P 500 this year. The exchange-traded fund, which invests in just seven stocks — Nvidia (NVDA -2.01%), Apple (AAPL +0.39%), Microsoft (MSFT +0.17%), Amazon

Not Nvidia. Not Micron. This Artificial Intelligence (AI) Stock Will Be 2027’s Biggest Winner After the Latest Tech Sell-Off

The recent sell-off in technology stocks has made some top names in this sector extremely attractive right now. For example, industry bellwethers Nvidia and Micron Technology are trading at extremely cheap multiples. Nvidia stock has a forward price-to-earnings (P/E) ratio of just 11, well below its five-year average forward earnings multiple of 33. It could

4 Stocks Bill Ackman and Jim Cramer Are Bullish On

Bill Ackman and Jim Cramer are two of the most closely followed names on Wall Street. Cramer’s stock picks already get plenty of coverage, and we just looked at five stocks he is bullish on. See the five picks here. Ackman founded Pershing Square Capital Management in 2004. From 2004 through early 2026, the firm

Why Virgin Galactic Stock Just Crashed

Virgin Galactic (NYSE:SPCE) stock imploded Friday, tumbling 23.4% through 11 a.m. ET despite beating on top and bottom lines in its Q3 earnings report last night. Heading into the report, analysts forecast Virgin Galactic would lose $0.47 per share on sales of just $231,670 for the quarter. Virgin beat on both top and bottom lines,

Why Micron Stock Was Sliding Today

Shares of Micron (MU -2.52%), the memory chip giant, were pulling back today as part of a broader sell-off in the chip sector. Investors continue to digest the shocking news that Jensen Huang has stepped down as the CEO of Nvidia (NVDA -2.01%) after a string of affairs that included a suspected Chinese spy and

Airbus reports share buyback transactions 9-13 November 2026

Market Closed – 11:55:00 2026-11-13 am EST 5-day change 1st Jan Change 206.65 EUR -0.77% +5.22% +4.16% Published on 11/13/2026 at 03:54 pm EST EQS EQS-Ad-hoc: Airbus SE / Key word(s): Share BuybackAirbus reports share buyback transactions 9-13 November 2026 13-Nov-2026 / 21:52 CET/CESTDisclosure of an inside information acc. to Article 17 MAR of the

Nov. 25 Could Be a Huge Day for the Stock Market

The Bureau of Labor Statistics released the latest inflation reading this morning, showing the Producer Price Index (PPI) jumped 6.5% in October from a year earlier. That’s the biggest annual jump since 2022. And it comes just three days after a hotter-than-expected Consumer Price Index (CPI) report. The market is now treating a rate hike

Daily Market Price Updates and Commentary 13th November 2026

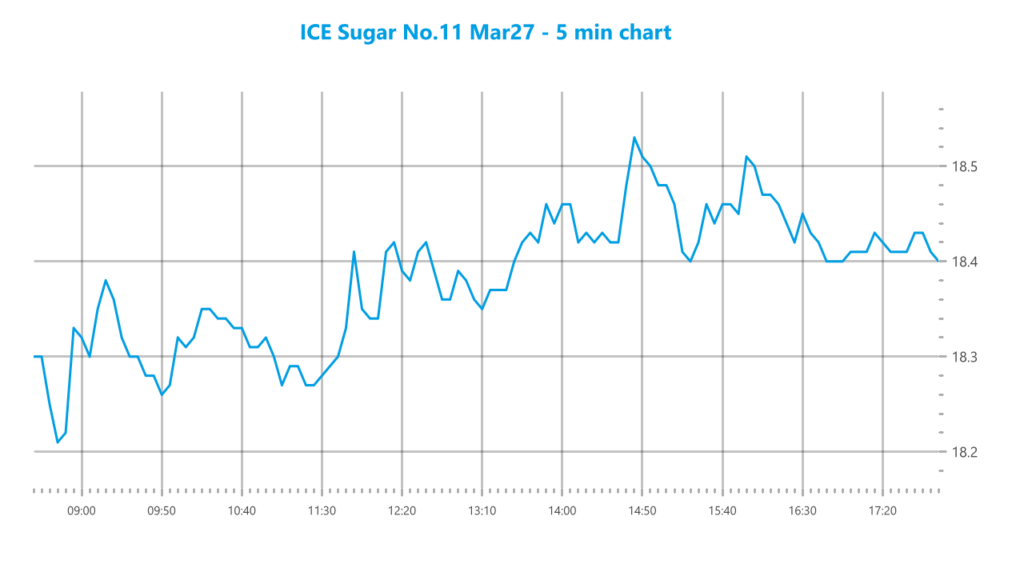
  ICE Futures U.S. Sugar No.11 Contract Settlement (cUS$/lb) Open High Low Last Volume O/I Life High Life Low Mar27 18.41 0.19 ▲ 18.26 18.54 18.16 18.40 59,672 545,655 21.29 14.42 May27 17.91 0.19 ▲ 17.75 18.01 17.66 17.90 33,373 217,928 20.40 14.29 Jul27 17.56 0.18 ▲ 17.41 17.65 17.32 17.54 18,492 145,689 19.81 14.27

Ed Yardeni Spots a Buying Opportunity in AI Stocks

This article first appeared on GuruFocus. Ed Yardeni sees the selloff following Jensen Huang’s resignation from Nvidia (NASDAQ:NVDA) as a buying opportunity for AI stocks. The Yardeni Research president expects the investment boom to continue under interim CEO Colette Kress. His call hinges on whether Nvidia keeps financing companies that are building out demand for

Chipotle Bought Back Stock at $34.05 a Share Last Quarter. Is It Still a Buy Today?

Chipotle‘s (CMG +0.18%) stock closed at a record high of $68.55 per share on June 18, 2024. At the time, investors were impressed by the fast-casual restaurant chain’s robust comparable-store sales growth, ongoing expansion, and rising restaurant-level operating margins. But today, it trades at about $35. It pulled back as its comps growth cooled down

0
Would love your thoughts, please comment.x
()
x