Fundamental Background
The structural deficit in the silver market has now persisted for a sixth consecutive year. According to forecasts by the Silver Institute, the gap between supply and demand in 2026 is expected to reach 67 million ounces, forcing the market to rely on accumulated reserves. However, the demand picture remains uneven.
Industrial consumption continues to decline, primarily due to the photovoltaic sector, where solar panel manufacturers are actively reducing the amount of silver used per cell in response to elevated prices. Against this backdrop, investment demand remains resilient: global ETP holdings have reached approximately 1.31 billion ounces, while silver lease rates in London have climbed to record highs amid a growing physical shortage.
Technical Picture
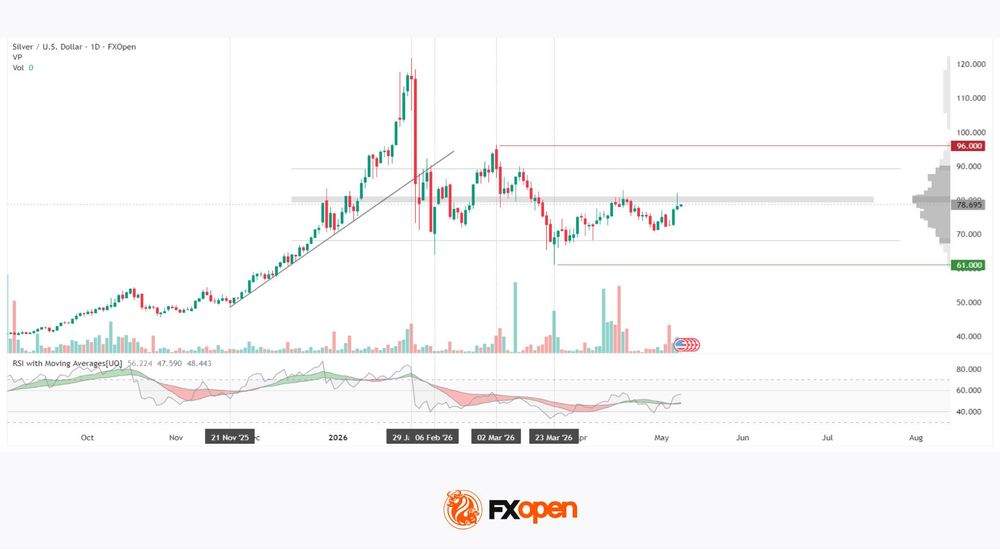
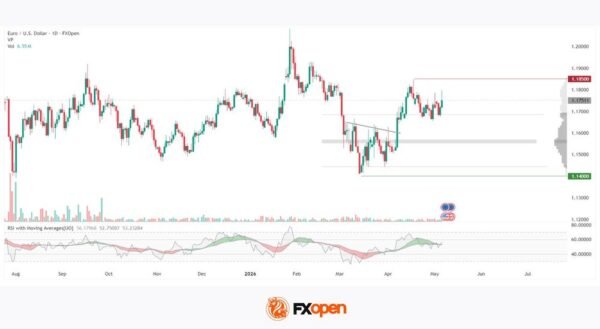
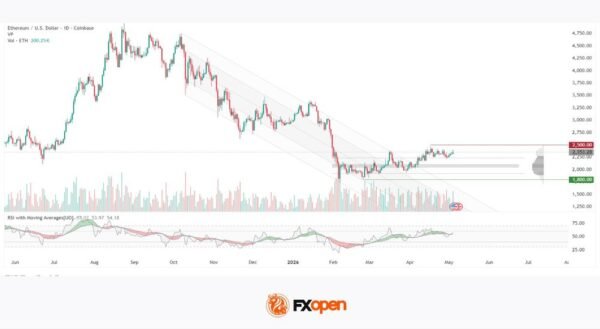
On the daily chart of XAG/USD, a two-phase structure is visible. From 21 November 2025, the instrument formed a strong upward impulse along an ascending trend line, reaching a peak on 29 January 2026. This was followed by a sharp collapse and a break below the trend line, with the low recorded on 6 February near the 64 level. A rebound then followed, and on 2 March a local recovery high was established — this area now corresponds to resistance around 96. A retest of the lows took place on 23 March 2026.
The horizontal volume profile spans the 68.300–89.000 range, with the point of control (POC) concentrated between 79.100 and 81.000. The price is currently trading below the lower boundary of this zone and remains under selling pressure. The nearest support lies at 68.300, followed by stronger support at 61.000, corresponding to the February crash low.
The RSI + MAs indicator shows readings of 55, 47 and 47. RSI remains above both moving averages; however, all indicators are within neutral territory, with no strong directional momentum currently visible.
Key Takeaways
The silver market continues to be influenced by two opposing fundamental forces: a structural supply deficit supported by investment demand, and weakening industrial consumption from the photovoltaic sector. The resolution of this imbalance is likely to determine the future direction and character of the market.
Start trading commodity CFDs with tight spreads (additional fees may apply). Open your trading account now or learn more about trading commodity CFDs with FXOpen.
This article represents the opinion of the Companies operating under the FXOpen brand only. It is not to be construed as an offer, solicitation, or recommendation with respect to products and services provided by the Companies operating under the FXOpen brand, nor is it to be considered financial advice.