Split Personality Markets: Stocks Up, Oil Warns, Dollar Torn

Markets are showing a clear “split personality” right now. Equities are pushing higher on the back of the extended US–Iran ceasefire, while oil continues to signal caution and Dollar is caught between opposing forces. The result is a fragmented picture where no single macro narrative is dominating.

US futures are trading higher after President Donald Trump announced an indefinite extension of the ceasefire. Despite stalled talks, the move has removed the immediate threat of escalation for now, allowing equities to lean risk-on. For the S&P 500 and NASDAQ, the extension is effectively a “yellow light”—not a full green signal, but enough to justify holding or adding exposure in the near term.

At the same time, equities are increasingly pivoting back to fundamentals. Strong Q1 earnings and the continued momentum of the AI-driven investment cycle are providing a more compelling narrative than the geopolitical stalemate. There is a clear effort to decouple from daily headlines, with investors focusing on earnings visibility rather than conflict risk.

In contrast, energy markets are not looking through the situation. Brent may have cooled from peaks above $120, but it remains firmly anchored near $100. This suggests traders are pricing in prolonged disruption in the Strait of Hormuz, even without a full escalation scenario. Oil is effectively signaling that supply risks remain embedded in the system.

This divergence is feeding into the broader inflation outlook. Even without further escalation, the surge in energy costs has already reset the inflation floor. Higher fuel and transport costs are filtering through global supply chains, keeping price pressures elevated and complicating the monetary policy outlook.

Bond markets are reflecting this skepticism. Yields remain supported by the view that Fed cannot pivot quickly toward easing. The persistence of inflation risks means policy is likely to stay restrictive for longer than markets might otherwise expect, with some global central banks pivoting towards tightening.

Currency markets are where these conflicting forces are most visible. Dollar is being pulled in opposite directions. On one hand, the ceasefire extension reduces safe-haven demand. On the other, elevated yields continue to attract capital inflows. Commodity currencies such as the Canadian and Australian Dollars are also caught in this crosscurrent. Higher oil and gas prices are supportive, but the risk of a global slowdown linked to energy-driven inflation caps upside. The result is choppy, range-bound trading rather than directional moves.

This week’s FX performance reflects this lack of conviction. Kiwi is leading on domestic rate expectations, followed by Loonie and Dollar. Yen is the weakest, with Euro and Aussie also under pressure. Sterling and Swiss Franc are holding in the middle. There is no coherent global theme driving currencies.

The broader takeaway is that markets are no longer aligned. Equities are pricing stability, oil is pricing disruption, and bonds are pricing inflation persistence. Each asset class is telling a different story.

Until there is clarity on whether US–Iran talks resume or a decisive shift in geopolitical conditions, this split personality is likely to persist. Markets are not ignoring the risks—but they are no longer reacting to them in the same way.

In Europe, at the time of writing, FTSE is down -0.02%. DAX is down -0.01%. CAC is down -0.30%. UK 10-year yield is down -0.011 at 5.128. Germany 10-year yield up 0.002 at 3.006. Earlier in Asia, Nikkei rose 0.40%. Hong Kong HSI fell -1.22%. China Shanghai SSE rose 0.52%. Singapore Strait Times fell -0.24%. Japan 10-year JGB yield rose 0.013 to 2.399.

UK CPI Hits 3.3% as Fuel Costs Drive Inflation Higher, Pipeline Pressures Build

UK CPI rose to 3.3% in March as fuel costs pushed inflation higher. Core inflation eased slightly, but rising PPI and oil prices signal building pipeline pressures. Read more.

Japan’s Exports Rise 11.7% in March, Trade Surplus Misses

Japan posted another solid month for exports, led by semiconductors and China demand. But the trade surplus still missed expectations as imports jumped on energy costs and a weaker Yen. Read More.

Australia Westpac Leading Index Turns Negative, Signals Below-Trend Growth Ahead.

Australia’s growth signal has turned negative. The Westpac Leading Index now points to below-trend growth, but rising energy costs and inflation risks keep RBA rate hikes firmly on the table. Read More.

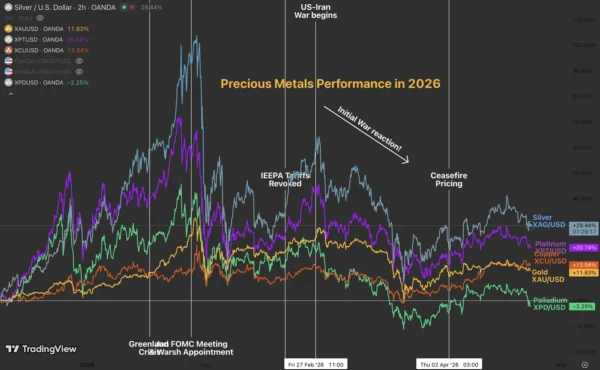
Gold and Silver Recover as US Extends Iran Ceasefire, But Technical Weakness Emerges

Ceasefire relief helped stabilize Gold and Silver—but technical cracks are forming. The next move depends on whether support levels hold. Read More.

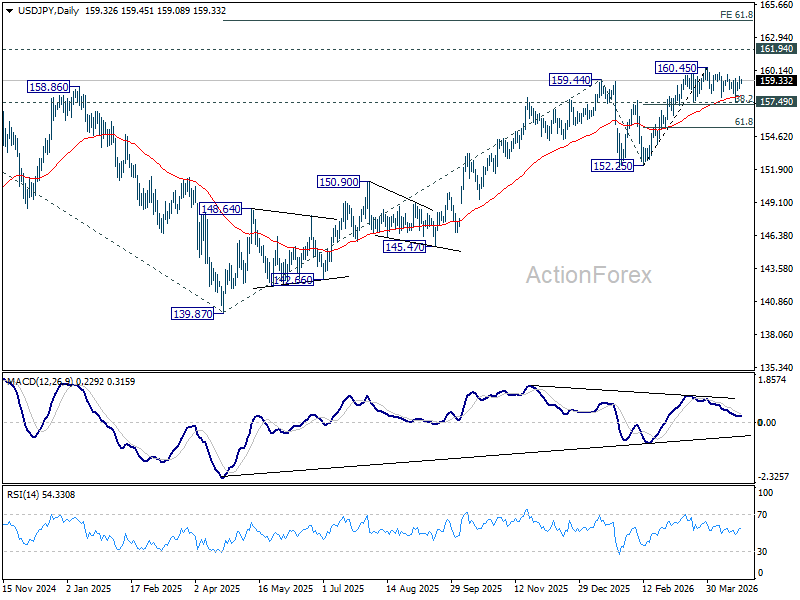
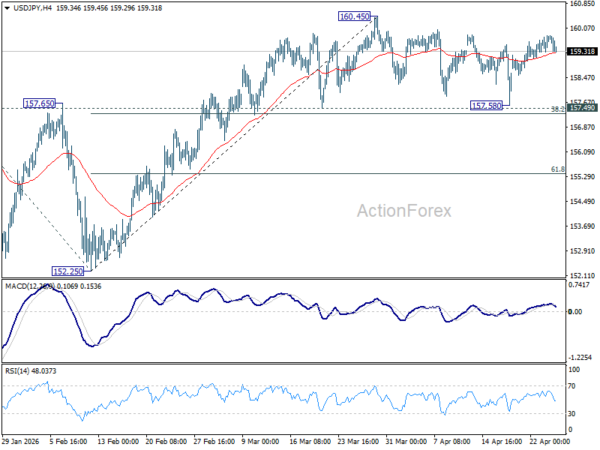
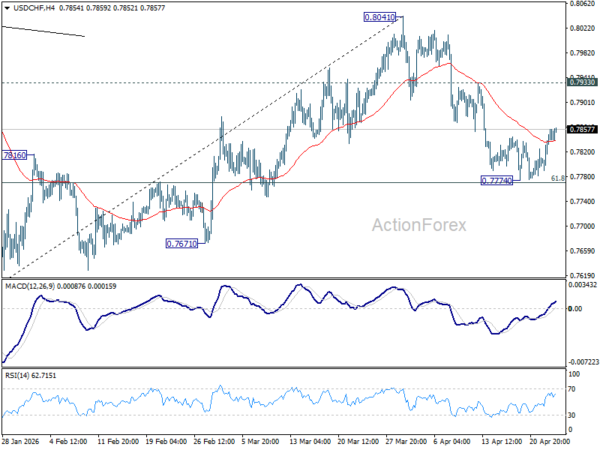
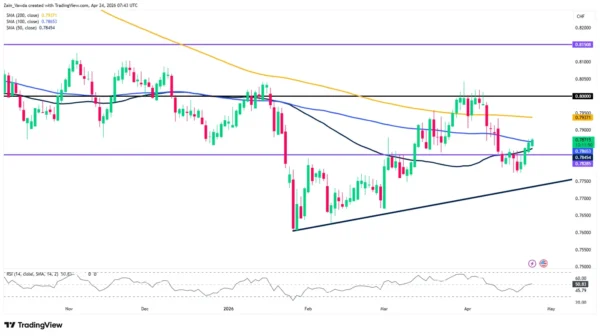
USD/JPY Mid-Day Outlook

Daily Pivots: (S1) 158.80; (P) 159.28; (R1) 159.87; More…

USD/JPY is still gyrating in range below 160.45 as consolidations continues. Intraday bias stays neutral for the moment. Further rise is expected with 157.49 cluster support (38.2% retracement of 152.25 to 160.45 at 157.31) intact. On the upside break of 160.45 will target a retest on 161.94 high. However, firm break of 157.31/49 will bring deeper fall back to 61.8% retracement at 155.38 next.

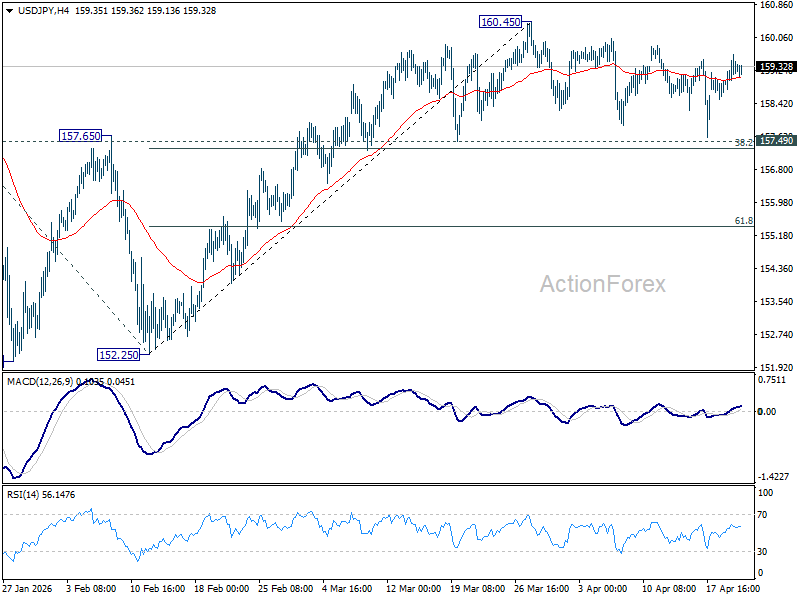
In the bigger picture, outlook is unchanged that corrective pattern from 161.94 (2024 high) should have completed with three waves at 139.87. Larger up trend from 102.58 (2021 low) could be ready to resume through 161.94. This will remain the favored case as long as 55 W EMA (now at 153.80) holds. Firm break of 161.94 will pave the way to 61.8% projection of 102.58 to 161.94 from 139.87 at 176.75.


Economic Indicators Update

GMT CCY EVENTS Act Cons Prev Rev
23:50 JPY Trade Balance (JPY) Mar 0.09T 0.20T -0.37T
01:00 AUD Westpac Leading Index M/M Mar -0.10% -0.10%
06:00 GBP CPI M/M Mar 0.70% 0.60% 0.40%
06:00 GBP CPI Y/Y Mar 3.30% 3.30% 3.00%
06:00 GBP Core CPI Y/Y Mar 3.10% 3.20% 3.20%
06:00 GBP RPI M/M Mar 0.80% 0.40%
06:00 GBP RPI Y/Y Mar 4.10% 3.90% 3.60%
06:00 GBP PPI Input M/M Mar 4.40% 2.90% 0.80% 0.90%
06:00 GBP PPI Input Y/Y Mar 5.40% 0.70% 0.50% 0.70%
06:00 GBP PPI Output M/M Mar 0.90% 1.00% -0.50%
06:00 GBP PPI Output Y/Y Mar 2.60% 1.70%
06:00 GBP PPI Core Output M/M Mar 0.20% -0.80% -0.70%
06:00 GBP PPI Core Output Y/Y Mar 2.00% 2.00%
12:30 CAD New Housing Price Index M/M Mar -0.20% 0.20% 0.30%
14:00 EUR Eurozone Consumer Confidence Apr P -17 -16
14:30 USD Crude Oil Inventories (Apr 17) -1.9M -0.9M


Source link

Visited 1 times, 1 visit(s) today

Related Article

RMB hiking play in forex options mkt

RMB hiking play in forex options mkt

A billboard in Shanghai displays renminbi”s foreign exchange rates. China Daily The renminbi’s rising prominence in global foreign exchange options is not an isolated development, but part of a broader, accelerating expansion of the Chinese currency’s international role across investment, financing and commodity pricing, analysts said. According to the London-based clearing house LCH, the yuan

EUR/CHF Weekly Outlook - ActionForex

EUR/CHF Weekly Outlook – ActionForex

EUR/CHF edged lower to 0.9159 last week but recovered just ahead of 0.9155 support. Outlook is unchanged and initial bias remains neutral this week for more consolidations below 0.9264. Further rally is expected with 0.9155 support intact. On the upside, firm break of 0.9264 will resume the rise from 0.8979 to 0.9394 resistance next. However,

EUR/GBP Weekly Outlook - ActionForex

EUR/GBP Weekly Outlook – ActionForex

EUR/GBP’s extended decline last week suggests that rebound from 0.8610 has completed at 0.8740 already. But as a temporary low was formed at 0.8652, initial bias stays neutral this week first. On the downside, below 0.8652 will resume the fall from 0.8740 to retest 0.8610 support next. Nevertheless, firm break of 0.8685 support turned resistance

EUR/JPY Weekly Outlook - ActionForex

EUR/JPY Weekly Outlook – ActionForex

EUR/JPY stayed in sideway trading last week and the development suggests that it’s merely in a near term consolidations. Initial bias remains neutral this week first. In case of another fall, downside should be contained by 38.2% retracement of 182.56 to 187.93 at 185.87 to bring rebound. On the upside, firm break of 187.93 will

USD/CAD Weekly Outlook - ActionForex

USD/CAD Weekly Outlook – ActionForex

USD/CAD fell to as low as 1.3629 last week but recovered since then. Initial bias remains neutral this week first. On the downside, sustained trading below 61.8% retracement of 1.3480 to 1.3965 at 1.3665 will pave the way to retest 1.3480 low. Nevertheless, break of 1.3729 minor resistance will turn bias back to the upside

USD/JPY Weekly Outlook - ActionForex

USD/JPY Weekly Outlook – ActionForex

USD/JPY extended consolidations below 160.45 last week and outlook is unchanged. Initial bias remains neutral this week. Further rise is expected with 157.49 cluster support (38.2% retracement of 152.25 to 160.45 at 157.31) intact. On the upside break of 160.45 will target a retest on 161.94 high. However, firm break of 157.31/49 will bring deeper

USD/CHF Weekly Outlook - ActionForex

USD/CHF Weekly Outlook – ActionForex

USD/CHF turned into consolidations last week and recovered, but overall outlook is unchanged. Initial bias remains neutral this week first. On the downside sustained break of 61.8% retracement of 0.7603 to 0.8041 at 0.7770 will pave the way to retest 0.7603 low. However, break of 0.7933 resistance will bring stronger rise back to retest 0.8041

EUR/USD Weekly Outlook - ActionForex

EUR/USD Weekly Outlook – ActionForex

EUR/USD’s gyrated lower last week but recovered ahead of 1.1662 support. Initial bias remains neutral this week first, and further rise is in favor. On the upside, sustained trading above 61.8% retracement of 1.2081 to 1.1408 at 1.1824 will pave the way to retest 1.2081 high. However, firm break of 1.1662 support will indicate the

EUR/AUD Weekly Outlook - ActionForex

EUR/AUD Weekly Outlook – ActionForex

EUR/AUD’s fall from 1.6842 extended lower to 1.6340 last week. But a temporary low should be in place on loss of momentum. Initial bias is turned neutral this week first. Further decline is expected as long as 1.6497 support turned resistance holds. Below 1.6340 will target a retest on 1.6125 low. Nevertheless, firm break of

USD/CHF Mid-Day Outlook - ActionForex

USD/CHF Mid-Day Outlook – ActionForex

Daily Pivots: (S1) 0.7808; (P) 0.7830; (R1) 0.7867; More…. USD/CHF recovers further today but stays well below 0.7933 resistance. Intraday bias remains neutral and further decline is expected. Sustained break of 61.8% retracement of 0.7603 to 0.8041 at 0.7770 will resume the decline from 0.8041 to retest 0.7603 low. In the bigger picture, rebound from

USD/CHF Price Analysis: Bulls Eye Key Resistance After Base Formation

USD/CHF Price Analysis: Bulls Eye Key Resistance After Base Formation

On the daily chart, USD/CHF is in a recovery phase, currently sandwiched between the 50-day MA (0.7845) and 100-day MA (0.7865). The H4 chart shows a more defined bullish structure, featuring a “Golden Cross” (100-period MA above 200-period MA). Failure to hold above the 0.7846 short-term support would negate the bullish setup and likely lead

EUR/USD and EUR/CAD Continue Correction Ahead of Key Data

EUR/USD and EUR/CAD Continue Correction Ahead of Key Data

The euro remains under pressure, extending its corrective decline following the previous impulsive rally. Market participants are taking profits and trimming positions ahead of key macroeconomic releases, reducing demand for the single currency and keeping both pairs near important levels, with the potential for increased volatility. Ongoing geopolitical uncertainty in the Middle East continues to

Silver (XAG/USD) Under Pressure from Ceasefire Clouds – In-depth Analysis

Silver (XAG/USD) Under Pressure from Ceasefire Clouds – In-depth Analysis

Precious metals have been the victim of a severe reality check since late January. Subjects of severe melt-ups since August 2025, following a slow but consistent grind higher from de-dollarization trends, the commodities got swept on all sides with extreme leverage and volatility. And in Financial Markets, it rarely translates into anything good – Silver

USD/JPY Edges Up, Can It Sustain Gradual Upside Trend?

USD/JPY Edges Up, Can It Sustain Gradual Upside Trend?

Key Highlights USD/JPY regained traction and climbed above the 158.80 zone. It cleared a key bearish trend line with resistance at 159.35 on the 4-hour chart. EUR/USD started a downside correction and traded below 1.1750. GBP/USD started a consolidation phase below the 1.3550 pivot level. USD/JPY Technical Analysis The US Dollar remained supported above 158.40

Collinson FX: April 23: USD and Equities rebound

Collinson FX: April 24: Safety flows again moved towards the US Dollar

Collinson FX: April 24: Safety flows again moved towards the US Dollar – amid rising tensions. by Collinson FX 24 Apr 10:58 AEST 24 April 2026 2026 Auckland Wooden Boat Show – Jellicoe Harbour – March 13-15, 2026 © Richard Gladwell / Sail-World.com/nz April 24: Economic crisis ahead for Brits? Tensions are on

0
Would love your thoughts, please comment.x
()
x