The S&P 500 Just Endured Its 5th Biggest 2-Day Decline in 75 Years — and History Is Crystal Clear What Happens Next for Stocks

Historic declines in the S&P 500 have paved the way for truly outsize return potential.

For more than two years, Wall Street had been in a virtually unstoppable bull market. The rise of artificial intelligence (AI), the resilience of the U.S. economy, and excitement surrounding stock splits in some of Wall Street’s most-influential businesses all played key roles in sending the Dow Jones Industrial Average (^DJI 7.87%), S&P 500 (^GSPC 9.52%), and Nasdaq Composite (^IXIC 12.16%) to new heights.

But the stock market wouldn’t be a “market” without the ability for equities to move in both directions.

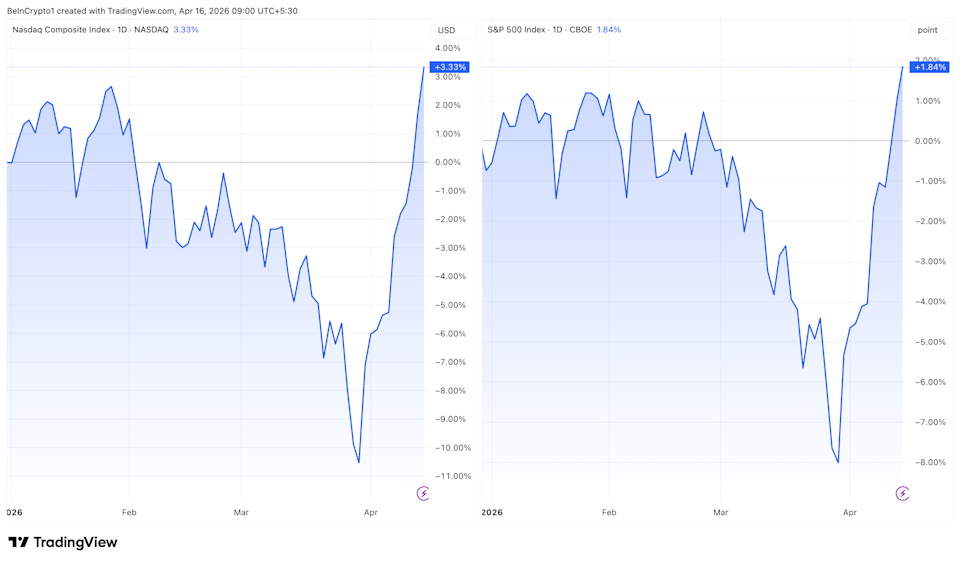
The last seven weeks have not been smooth sailing for Wall Street or investors. Since the S&P reached its all-time closing high on Feb. 19, the ageless Dow, benchmark S&P 500, and growth-focused Nasdaq Composite have respectively fallen by 14.9%, 17.6%, and 22.2%, as of the closing bell on April 7.

Image source: Getty Images.

However, the decline in stocks really picked up to close out the previous week. On April 3 and April 4, the S&P 500 cumulatively lost 10.5% of its value, which marked the fifth biggest two-day decline in the index since 1950.

With investors’ emotions running high, many are looking to historical data points and correlative events for guidance. Though there’s no indicator that can guarantee short-term directional moves for the stock market, history is quite clear what happens next for stocks after two-day wash-out events.

Why is the stock market crashing?

Before digging into the historical data that’s likely to turn investors’ frowns upside down, let’s tackle how we got to where we are now. In other words, why did Wall Street plunge into a correction?

The obvious answer is that uncertainty caused by President Donald Trump’s tariff policy is to blame.

On April 2, the president unveiled his “Liberation Day” tariff policy, which entails a sweeping 10% global tariff, as well as select reciprocal tariffs on countries that have historically run unfavorable trade imbalances with the U.S.

Trump believes tariffs will generate revenue for America, protect U.S. jobs, and encourage domestic production. Additionally, the use of tariffs opens the door for the renegotiation of trade deals that currently may not be in America’s best interests.

Unfortunately, tariffs aren’t as cut-and-dried as President Trump makes them appear. A lack of differentiation between input and output tariffs, for instance, is a dangerous game to play with the U.S. economy. Output tariffs are an added tax placed on finished goods imported into the country. Meanwhile, an input tariff is a tax placed on a good used to complete a finished product domestically. Input tariffs run the risk of increasing the prevailing rate of inflation during a period of slower growth for the U.S. economy.

S&P 500 Shiller CAPE Ratio Chart

S&P 500 Shiller CAPE Ratio data by YCharts.

But the fifth largest two-day decline in stocks isn’t entirely due to Trump’s tariff policy. Some semblance of blame also lies with the stock market’s being historically pricey.

The S&P 500’s Shiller price-to-earnings (P/E) Ratio, which is also known as the cyclically adjusted P/E Ratio (CAPE Ratio), entered 2025 at the third-highest premium during a bull market when back-tested 154 years. It peaked at a multiple of 38.89 in December 2024, which compares to an average multiple of 17.23 since January 1871.

Looking back 154 years, there have only been a half-dozen occasions, including the present, where the S&P 500’s Shiller P/E surpassed 30 and held that level for at least two months. The former five occurrences all resulted in a loss of value of between 20% and 89% in one or more of Wall Street’s major stock indexes losing between 20% and 89%.

This is a roundabout way of saying that investors are unwilling to tolerate outsize stock valuations over an extended period.

A person drawing an arrow to and circling the bottom of a steep decline in a stock chart.

Image source: Getty Images.

When the S&P 500 crashes, it’s a surefire buying opportunity, per history

With a better understanding of what’s driven the Dow Jones Industrial Average, S&P 500, and Nasdaq Composite to jaw-dropping losses recently, let’s allow history to take center stage.

According to data aggregated by Creative Planning’s Chief Market Strategist Charlie Bilello, the 10-biggest two-day percentage declines in the benchmark S&P 500 since 1950 have ranged from 9% to 24.6%. As noted, the 10.5% decline from April 3 to April 4 slotted in as the fifth largest drop.

But what’s far more important is the total return potential, including dividends, of the broad-based index following these sizable declines.

As you’ll note in the following post on social media platform X by Bilello, every single instance where the S&P 500 endured a decline of at least 9% over a two-day period eventually led to significant gains over the next year, three years, and five years.

On average, the S&P 500 was up:

  • 31.8% on a total return basis one year later.
  • 50.2% on a total return basis three years later.
  • 121.9% on a total return basis five years later.

To put this into context, the average annual return from 1957 through March 2023 for the S&P 500 was roughly 10.5%. Historic declines in the benchmark index have paved the way for truly outsize return potential.

Widening the lens a bit further demonstrates just how much of an ally time in the market can be for patient investors.

Every year, the analysts at Crestmont Research refresh a published data set that calculates the rolling 20-year total returns of the S&P 500 dating back to the start of the 20th century. This published data set examines 106 rolling 20-year periods (1900-1919, 1901-1920, 1902-1921, through 2005-2024).

What Crestmont discovered was that all 106 periods produced a positive annualized return. In easy-to-understand terms, if you had, hypothetically, purchased an S&P 500 tracking index anywhere between 1900 and 2005 and held your position for 20 years, you generated a profit 100% of the time. It didn’t matter if you held through a depression, recession, war(s), a pandemic, or various stock market crashes — patience paid off every single time.

Although the recent stock market crash has been scary, history strongly suggests it’s an open invitation for long-term investors to put their money to work.


Source link

Visited 1 times, 1 visit(s) today

Related Article

The Dow Fell Into Correction Territory During the Iran Conflict. It Has Already Bounced Back. Here Is the Pattern Long-Term Investors Should Memorize.

In the first quarter of 2026, the Dow Jones Industrial Average (DJINDICES: ^DJI) experienced a 10% correction, its biggest drop since early 2025. Megacap tech stocks, which had been pulling the markets higher, became average performers. But over the past few weeks, stocks have made a rapid recovery. The U.S.-Iran ceasefire raised hope that a

Nasdaq Extends Winning Streak to 12: Stock Market Today

(Image credit: Getty Images) The Nasdaq Composite about-faced mid-morning and resumed its upward march on Thursday, as tech stocks carry on in the face of war. All three main U.S. equity indexes spent time in the red before rising, keeping a bullish trend intact, despite multiple disruptions and continuing volatility in the crude oil market.

Which Is the Best Way to Buy the S&P 500?

A common bit of advice for beginning investors is to “just buy an S&P 500 index fund.” But there’s more than one way to do this. A variety of S&P 500 ETFs make it possible to buy all the stocks of the 500 largest publicly traded U.S. companies, often at low fees. If you want

Kamux Corporation’s share repurchase program has been completed

Market Closed – Nasdaq Helsinki 12:00:00 2026-04-16 pm EDT After hours 02:31:17 pm 1.728 EUR -0.58% 1.721 -0.41% Published on 04/16/2026 at 01:13 pm EDT Acquiremedia Kamux Corporation | Stock Exchange Release | April 16, 2026 at 19:00:00 EEST Kamux has completed the share repurchase program as announced on November 11, 2025 and February 25,

A Trump-Era Trading Pattern Signals Stock Gains Ahead, Market Vet Says

The TACO trade isn’t the only Trump-era trading pattern that investors should be keeping tabs on. Loading audio narration… Jeffery Hirsch, a longtime market strategist and the editor of the Stock Trader’s Almanac, flagged a seasonal cycle in stock moves during Trump’s presidency, outlining how the 2026 market action fits into the pattern and what

Retail traders pile into Allbirds after odd AI pivot. History shows it won’t end well

Sign on facade at shoe company Allbirds, Walnut Creek, California, August 25, 2025. Smith Collection | Archive Photos | Getty Images Retail traders stampeded into Allbirds after the troubled shoemaker slapped an artificial intelligence label on its business, a set-up that market history suggests rarely ends well once the initial hype fades. Shares of the

Why Did Planet Labs Stock Pop Today?

Planet Labs (PL +12.00%) stock jumped 10.5% through 10 a.m. ET this morning — for no obvious reason. No upgrades from Wall Street, nor even a change in price target. In fact, the closest thing to “news” about this satellite stock… might even be bad news. Image source: Getty Images. Look who’s selling Planet stock

Guideline Launches KPI Forecast 2.0, Delivering Advanced Ticker-Level Forecasting for Capital Markets

New offering leverages proprietary ad spend data to provide high-precision, data science-driven revenue modeling to assist forecasting for institutional investors including hedge funds, mutual funds, and quantitative fund managers NEW YORK, April 16, 2026 /PRNewswire/ — Guideline today announced the launch of KPI Forecast 2.0, an enhanced analytics solution designed to help institutional investors and financial

Top Wall Street Forecasters Revamp Netflix Expectations Ahead Of Q1 Earnings

Got story updates? Submit your updates here. › An extreme close-up of the inner workings of the financial system illustrates the complex machinery that drives the global economy.Los Gatos Today Netflix, Inc. (NASDAQ:NFLX) is set to report its first quarter earnings after the market close on Thursday, April 16. Analysts expect the company to report

If You Only Buy 1 AI Stock This Year, Wall Street Says Make It This One

Wall Street is almost unanimous: Of the 67 analysts covering Alphabet (NASDAQ: GOOG) (NASDAQ: GOOGL), 60 have buy or outperform ratings on the stock, seven have hold ratings, and none have sell ratings, according to S&P Global Market Intelligence. The Google owner is definitely a favorite among analysts. Here’s why. It’s not just equity market

Global Value Stocks Priced Below Estimated Intrinsic Value

As global markets rally on improved sentiment following a U.S.-Iran ceasefire and easing geopolitical tensions, investors are turning their attention to stocks that may be undervalued relative to their intrinsic value. In such an environment, identifying stocks with strong fundamentals and potential for growth can offer opportunities for those seeking value in a market buoyed

Discovering Hidden Opportunities in Middle Eastern Stocks

The Middle Eastern stock markets are currently experiencing mixed performances as investors navigate geopolitical tensions and potential resolutions, with indices like Dubai’s showing resilience by advancing 1.4% amidst these uncertainties. In such a dynamic environment, identifying promising stocks often involves looking for companies that demonstrate strong fundamentals and the ability to adapt to shifting market

Southern First Bancshares, Inc. Announces Public Offering of Common Stock

GREENVILLE, S.C., April 15, 2026 /PRNewswire/ — Southern First Bancshares, Inc. (NASDAQ: SFST) (the “Company,” “we,” “us,” or “our”) today announced that it has launched an underwritten public offering of shares of its common stock. The Company intends to grant the underwriters a 30-day option to purchase up to an additional 15 percent of the shares

Burjeel Holdings And Two Others

Gulf stock markets have recently shown resilience, closing higher on hopes for renewed U.S.-Iran peace talks, which have bolstered investor sentiment across the region. In such a climate, penny stocks—often smaller or newer companies—continue to intrigue investors with their potential for growth and value. While the term “penny stocks” might seem outdated, these investments can

Southern First Bancshares, Inc. Announces Pricing of Public Offering of Common Stock

GREENVILLE, S.C., April 15, 2026 /PRNewswire/ — Southern First Bancshares, Inc. (NASDAQ: SFST) (the “Company,” “we,” “us,” or “our”) today announced the pricing of an underwritten public offering of 1,050,000 shares of its common stock at a price of $54.00 per share. The Company also granted the underwriters a 30-day option to purchase up to

Allbirds shares soar after pivot from footwear to AI

[Allbirds] Shares in shoe brand Allbirds, once seen on the feet of famous people like actor Ben Affleck and former US President Barack Obama, soared on Wednesday after it announced plans to pivot from footwear to artificial intelligence (AI). The San Francisco-based firm said it has struck a $50m (£37m) deal to become an “AI

Stock Market Today, April 15: Robinhood Markets Surges After SEC Eases Day Trading Rules

Today’s Change (10.41%) $8.23 Current Price $87.32 Key Data Points Market Cap $71B Day’s Range $81.50 – $87.55 52wk Range $39.21 – $153.86 Volume 73M Avg Vol 30M Gross Margin 94.96% Robinhood Markets (HOOD +10.41%), a commission-free trading platform for stocks and crypto, closed at $87.32, up 10.41% Wednesday. Shares are surging after the SEC

0
Would love your thoughts, please comment.x
()
x