The TACO trade isn’t the only Trump-era trading pattern that investors should be keeping tabs on.
Jeffery Hirsch, a longtime market strategist and the editor of the Stock Trader’s Almanac, flagged a seasonal cycle in stock moves during Trump’s presidency, outlining how the 2026 market action fits into the pattern and what it might signal about what’s to come.
“One pattern stands out: during Trump Presidency Years, the S&P 500 has tended to carve out a spring bottom in late March to early April before staging meaningful advances into year-end.”
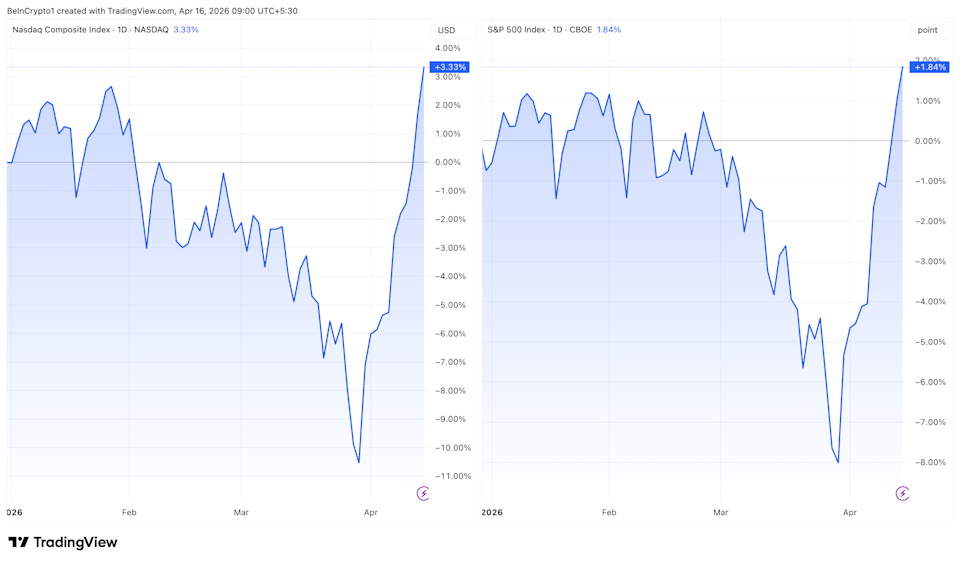
The S&P 500 on Wednesday hit a record high, erasing its wartime losses and rallying even as peace talks have yet to resume and as oil prices remain elevated.
The end of March marked the S&P 500’s closing low, with the two-week ceasefire agreement fueling a rapid relief rally.
Geopolitical is still high despite the rally, with failed in-person talks and an unclear path to a permanent peace deal, prompting some on Wall Street to warn there’s more pain ahead.
Yet, the Trump Presidency seasonal pattern signals the rally has legs, Hirsch argues.
“Markets don’t wait for clarity — they bottom in uncertainty,” he wrote. “The S&P 500 has erased all of its Iran war losses. With sentiment reset, positioning lighter, and volatility elevated, the backdrop is in place for a near-term recovery.”
The strategist noted that the conflict in the Middle East may have pulled forward the typical market weakness seen in midterm election years, creating an opportunity for investors.
“Geopolitical risks and energy markets remain key variables, but the market has absorbed these shocks better than many expected,” Hirsch said.
“Growth is holding, labor is solid, and the Fed is neutral. If diplomacy continues to progress, the setup for equities into year-end looks increasingly constructive,” he added.