3 Asian Stocks Possibly Trading Below Their Intrinsic Value By Up To 39.2%
The Asian stock markets have recently experienced a rebound, supported by stronger-than-expected economic data from China and optimism around geopolitical de-escalation in the Middle East. As investors navigate these shifting conditions, identifying stocks that may be trading below their intrinsic value can offer potential opportunities for growth in an otherwise cautious market environment.
Let’s review some notable picks from our screened stocks.
Overview: Gushengtang Holdings Limited is an investment holding company offering healthcare services in the People’s Republic of China, with a market capitalization of approximately HK$6.34 billion.
Operations: The company’s revenue is primarily derived from the provision of healthcare solutions, amounting to CN¥3.22 billion, and the sale of healthcare products, contributing CN¥29.42 million.
Estimated Discount To Fair Value: 18%
Gushengtang Holdings is trading at HK$28.88, which is 18% below its estimated fair value of HK$35.21, highlighting potential undervaluation based on cash flow analysis. The company reported increased earnings and revenue for 2025, with net income rising to CNY 352.77 million from CNY 306.78 million the previous year. Despite moderate earnings growth forecasts of 14.9% annually, the company’s revenue growth outpaces the Hong Kong market average, suggesting robust future performance prospects amidst recent executive changes and strategic investments.
SEHK:2273 Discounted Cash Flow as at Apr 2026
Overview: Nanjing Vazyme Biotech Co., Ltd provides technology solutions in life science, biomedicine, and in vitro diagnostics with a market cap of approximately CN¥7.85 billion.
Operations: Nanjing Vazyme Biotech Co., Ltd generates revenue through its offerings in life science, biomedicine, and in vitro diagnostics.
Estimated Discount To Fair Value: 39.2%
Nanjing Vazyme Biotech is trading at CNY 19.73, significantly below its estimated fair value of CNY 32.45, indicating undervaluation based on cash flows. The company reported Q1 2026 sales of CNY 320.65 million and net income of CNY 4.18 million, showing improvement from the previous year. With forecasted annual revenue growth of 25.7%, outpacing the Chinese market average, and expected profitability within three years, it presents a compelling investment case despite current dividend sustainability concerns.
SHSE:688105 Discounted Cash Flow as at Apr 2026
Overview: ACES Electronics Co., Ltd. is engaged in the research, development, manufacture, and sale of electronic connectors across Taiwan, China, the Philippines, the United States, and other international markets with a market cap of NT$13.16 billion.
Operations: The company’s revenue is primarily derived from its Connector Department, contributing NT$6.78 billion, followed by the Cables Segment at NT$2.50 billion and the Metal Stamping Department at NT$1.98 billion.
Estimated Discount To Fair Value: 17.1%
ACES Electronics is trading at NT$77.8, below its estimated future cash flow value of NT$93.89, suggesting undervaluation. Recent earnings show strong growth with net income rising to NT$661.19 million from NT$344.06 million year-on-year, driven by revenue increases to NT$10,859.56 million from NT$9,770.9 million. Despite a low forecasted return on equity and unsustainable dividend coverage by free cash flows, the company expects significant earnings and revenue growth exceeding market averages over the next three years.
TWSE:3605 Discounted Cash Flow as at Apr 2026
This article by Simply Wall St is general in nature. We provide commentary based on historical data and analyst forecasts only using an unbiased methodology and our articles are not intended to be financial advice. It does not constitute a recommendation to buy or sell any stock, and does not take account of your objectives, or your financial situation. We aim to bring you long-term focused analysis driven by fundamental data. Note that our analysis may not factor in the latest price-sensitive company announcements or qualitative material. Simply Wall St has no position in any stocks mentioned.
Companies discussed in this article include SEHK:2273 SHSE:688105 and TWSE:3605.
This article was originally published by Simply Wall St.
[Getty Images] The Bank of England expects stock markets around the world to fall as share prices do not reflect the many risks facing the global economy, its deputy governor has told the BBC. Sarah Breeden said: “There’s a lot of risk out there and yet asset prices are at all-time highs. We expect there
Today’s Change (7.50%) $3.63 Current Price $52.02 Key Data Points Market Cap $16B Day’s Range $47.94 – $53.37 52wk Range $5.72 – $76.87 Volume 58M Avg Vol 37M Gross Margin 26.67% Iren (IREN +7.50%), a Bitcoin mining and AI data center operator, closed Thursday at $52.02, up 7.50%. The stock advanced on positive coverage of
Over the past year, many of the top tech stocks lost their momentum as the Fed’s reluctance to cut interest rates, escalating geopolitical conflicts, and other macro headwinds drove investors toward more conservative sectors. Some investors also likely worried that the artificial intelligence (AI) market — which had generated strong tailwinds for many tech companies
Etsy (ETSY 4.54%), the online artisan marketplace for customized and handcrafted goods, closed at a record high of $296.91 per share on Nov. 24, 2021. That marked a 1,756% gain from its IPO price of $16 on April 16, 2015. At the time, investors were impressed by its accelerating growth during the pandemic and its
International stocks have been hot over the past 16 months, significantly outperforming U.S. stocks since the beginning of 2025. That outperformance continued into 2026, as most international indexes are up, while U.S. markets have mostly sputtered through the first four months of the year. Diversifying your portfolio with international stocks and exchange-traded funds (ETFs) is
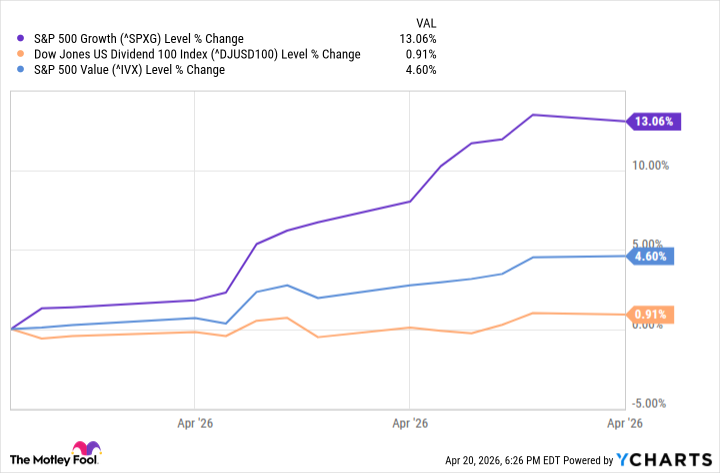
It’s been tough being an income investor of late. All the excitement seems to be on growth’s side of the fence. Indeed, after an alarming pullback in February and March, the S&P 500 Growth index is up nearly 13% just since the end of last month. That seems to have come at the expense of
The Iran war came as an unwelcome shock to the stock market and the global economy. Between Feb. 27 (the day before U.S. military strikes on Iran began) and March 30, the tech-heavy Nasdaq-100 index lost 8% of its value. With the news full of alarming headlines, investors fled to safe-haven assets and moved away
Oneok (OKE +0.23%) is one of the more resilient dividend stocks in the energy sector. The energy midstream company has delivered over a quarter-century of dividend stability and growth. It currently offers a dividend yield of more than 5%. The pipeline company is off to a strong start this year, rallying about 15% and outpacing
📌 Top story — scroll down for more updates Top of the Morning 10:25 am — ISRG flat By Sanmeet DeoTeam Rule Breakers Intuitive Surgical (ISRG 0.14%) dropped its Q1 2026 results on April 21, and the numbers were hard to argue with. Revenue hit $2.77 billion, up 23% year over year, while non-GAAP earnings per share
The stock market has largely performed well on Donald Trump’s watch. Even recent economic shocks like new tariffs and oil price spikes haven’t chased away the Wall Street bulls. At least, not yet. Will AI create the world’s first trillionaire? Our team just released a report on the one little-known company, called an “Indispensable Monopoly” providing
Johnson & Johnson (NYSE:JNJ) was among Jim Cramer’s stock calls on Mad Money recently. Cramer highlighted buying the stock for the Charitable Trust, as he stated: We bought the stock of Johnson & Johnson today for the Charitable Trust… Are we crazy? No, we’re not crazy. We’re buying what may be the best drug stock,
Kelvin Wong Senior Market Analyst Based in Singapore, Kelvin Wong is a well-established senior global macro strategist with over 15 years of experience trading and providing market research on foreign exchange, stock markets, and commodities. Passionate about connecting the dots in the financial markets and sharing perspectives around trading and investment, Kelvin Wong is an
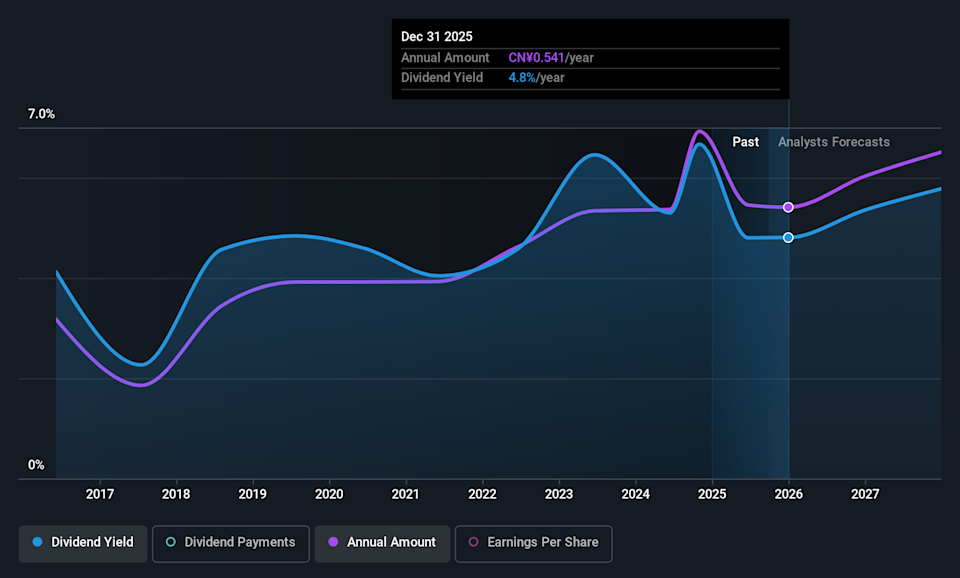
Amid signs of de-escalating Middle East tensions and strong earnings reports, global markets have shown resilience, with major indexes like the Nasdaq Composite and S&P 500 reaching record highs. In this environment of optimism, dividend stocks can offer a compelling investment opportunity by providing regular income streams alongside potential capital appreciation. Name Dividend Yield Dividend
Making history is nothing unusual for Wall Street’s benchmark indexes. As of the closing bell on April 17, the S&P 500 (SNPINDEX: ^GSPC) and Nasdaq Composite (NASDAQINDEX: ^IXIC) were both at record highs, while the Dow Jones Industrial Average (DJINDICES: ^DJI) was one solid day away from joining its peers. The Nasdaq was also on
PRESS RELEASE Share Buyback Transaction Details April 16 – April 22, 2026 Alphen aan den Rijn – April 23, 2026 – Wolters Kluwer (Euronext: WKL), a global leader in professional information solutions, software and services, today reports that it has repurchased 95,594 of its own ordinary shares in the period from April 16, 2026, up to
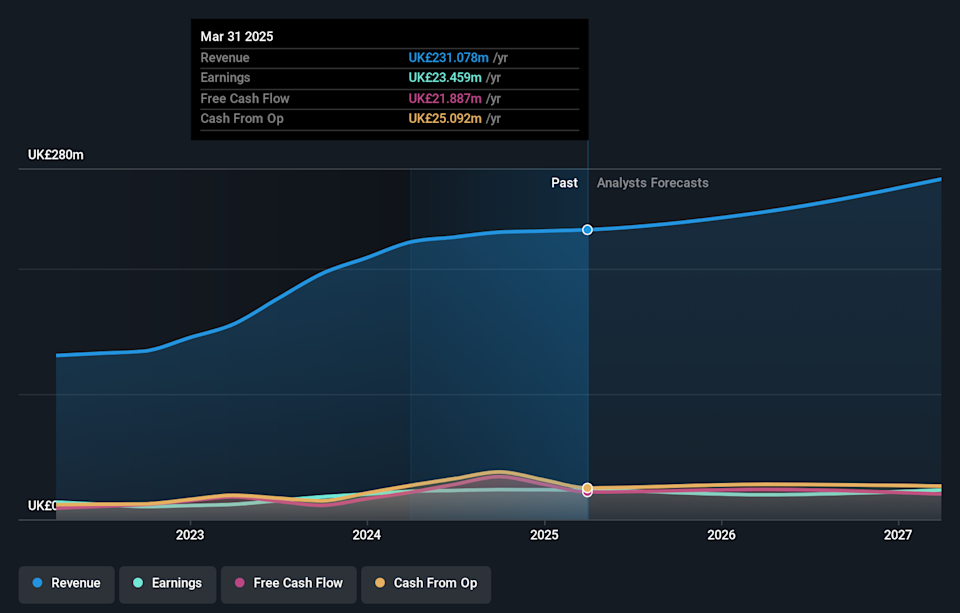
The United Kingdom’s stock market has recently faced challenges, with the FTSE 100 and FTSE 250 indices experiencing declines amid weak trade data from China, highlighting global economic uncertainties. In this environment, small-cap stocks can offer unique opportunities for investors seeking growth potential, as these companies are often less exposed to international fluctuations and may
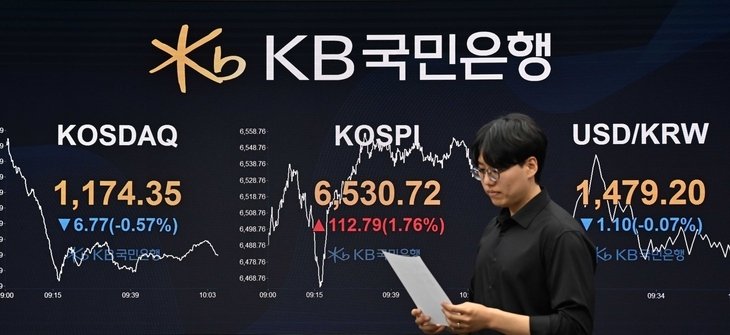
Despite inflows, RIAs account for just 0.38% of overseas holdings Traders at KB Securities in Seoul monitor the market on April 23, after the Kospi broke through 6,500 points, following a tech-led surge from Wall Street and stellar performance by SK hynix. (The Korea Herald) South Korea’s record-setting Kospi rally is driving a surge in
The Middle Eastern stock markets have recently faced challenges, with Gulf indices experiencing declines due to geopolitical tensions and the closure of the Strait of Hormuz. Despite these headwinds, certain investment opportunities remain attractive, particularly in the realm of penny stocks. Although often considered a term from past market eras, penny stocks continue to offer
Micron (NASDAQ: MU) stock is roaring higher in Wednesday’s trading. The artificial intelligence (AI) memory-chip leader’s share price was up 7.7% as of 1:15 p.m. ET. Meanwhile, the S&P 500 was up 0.6%, and the Nasdaq Composite had risen 1.2%. The stock market is rallying on news that the U.S. and Iran have agreed to
Kazuhiro Nogi | AFP | Getty Images Japan and South Korea stocks hit record highs Thursday, trailing overnight gains on Wall Street after President Donald Trump‘s extended a ceasefire with Iran, boosting investor sentiment alongside strong corporate earnings. Trump extended a two-week U.S. ceasefire on Tuesday, saying it was warranted due to Tehran’s “seriously fractured” government.