In today’s Market Outlook, let’s take a look at Forex Trading on Silver, XAGUSD, Gold, XAUUSD, AUDUSD, the NASDAQ, and WTI & Brent Crude Oil.
If we look at WTI and Brent side by side, we see a very rare phenomenon.
For a while, the price per barrel was equal, as we know, Brent Crude is usually more expensive.

We all know why the price of oil shot up with the US attacking Iran, making the main supply route for 20% of the world’s oil too dangerous to pass.
But, we see 3 reasons why prices have fallen:
There are reports of negotiations or possible intervention to stabilise shipping in the Strait of Hormuz.
G7 countries discussed releasing emergency oil reserves.
And, thirdly, the sudden 30% move to the upside attracted massive profit-taking from funds.
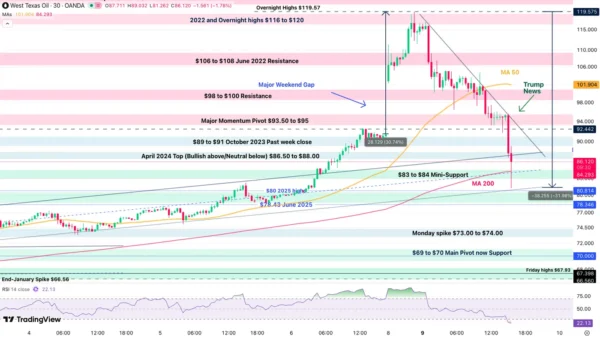
Right now, we see technical signs of price action rising again, but as usual, keep an eye on the news.
This week, we will be watching Wednesday’s US Crude Oil Inventory report, where analysts can’t even give us an estimate.
Last week’s disastrous Non-Farm Payroll report, combined with news from Iran, caused most indices like the NASDAQ to open with a gap on Monday morning and fall further.
We got a technical pullback as rumours of diplomacy in Iran were floated, but don’t hold your breath.
Price action has reached the upper trend line, and the stochastic oscillator is very overbought.
Also, on Wednesday, we have US CPI, which, along with last week’s terrible Non-Farm Payroll surprise, may have the Fed thinking about lowering Interest Rates again.
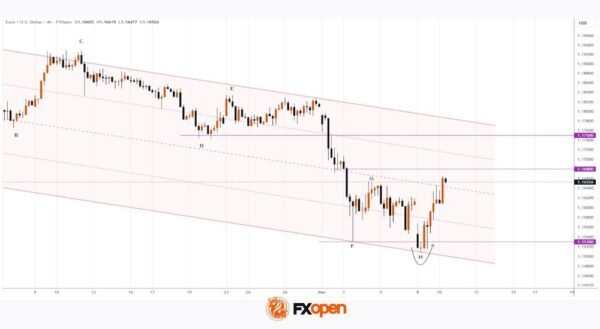
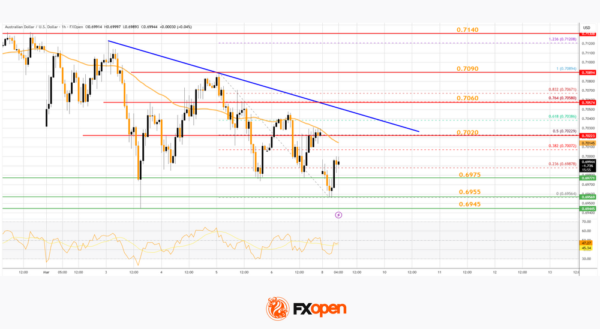
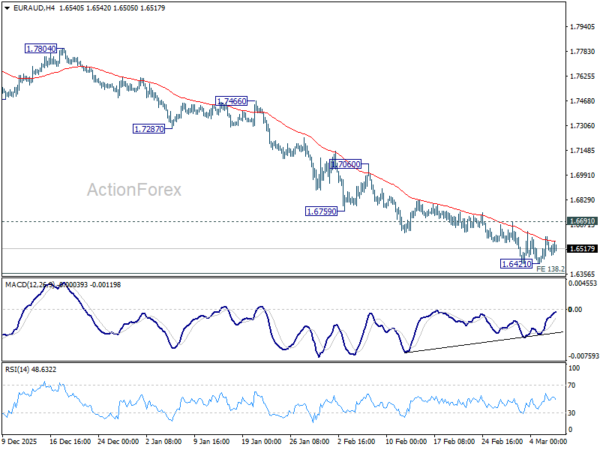
Most USD pairs, like AUDUSD, showed similar price action responses to the news last week and this week, with a gap, then recovery.
We also see price action at the upper trend lines, and the stochastic oscillators are very overbought and turning over.
Check all your Index and USD pairs charts.
We see similar technical setups with gold and silver, with XAGUSD showing us something completely different with a huge breakout from this trading range.
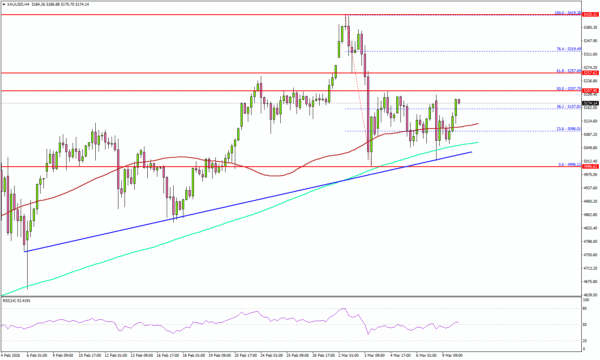
Gold, in fact, is still in a trading range, and we can see how many traders could use the Relative Strength Index or RSI to pick the tops and bottoms between resistance at almost $5,200 and support at $5,000.