What Happened at the Month-End Fix?

Although markets settled somewhat in May, the heightened volatility, with the associated nervousness, means that market impact at the month-end London 4pm FX Fix remains at high levels relative to recent history, with May exhibiting the second highest (after April) costs since February 24.

Investors whose funds use the 20-minute Siren FX methodology at the May month-end, would have benefited from $592 per million savings, compared to those using the five-minute WMR Benchmark Fix at the same time. This is above the 2024 average of $319 per million and largely in line with the 40-month average (since The Full FX started tracking data) of $577 per million.

Although that number should be a concern to investors, perhaps more worrying is the size of the gulf in EUR/USD, with the longer Siren window providing $732 per million in potential savings for the world’s busiest currency pair. This is the highest since December 2023 and the second highest since November 2022. It is also more than three-times the 2024 average, and significantly over the 49-month average of $495 per million.

In contrast, USD/JPY had its lowest market impact since September 2023 at “just” $97 per million, notably below its 49-month average of $581 per million and the 2024 average of $489 per million. Cable was also below its longer-term average, but above the 2024 mean, while USD/CAD, USD/CHF, AUD/USD and NZD/USD all provided larger-than-average savings.

While these savings are significant, the reality is that they were likely to have been higher than published here. As noted below, the WM rate is calculated by Siren FX using its proxy WM calculation method, but this still uses higher frequency data than WM, meaning there are, occasionally, meaningful differences.

This was the case this month in terms of EUR/USD. Cable, and USD/CHF , which were all actually higher than the proxy fix according to sources with whom The Full FX checked the data, while in USD/JPY, the actual saving would have been slightly lower using the actual WM rate. The differences were, according to the sources, 1.1 pips in EUR, 2.3 pips in Cable and 1.6 pips in the Swiss, while the yen difference was 0.8 pips. AUD, CAD and NZD were either exactly on the Siren proxy or close in the case of the latter.

To provide more context, the table below also presents projected dollars per million savings across a portfolio of different pairs using a correlation with the Fix calculation, depending upon how much flow was in the direction of the market, or “with the wind”. The rates used for the WM column are calculated using Siren’s proxy five-minute window, which utilises data from New Change FX, however The Full FX endeavours to check that they are a reasonable reflection of those published by the WM.

CCY Pair WMR 4pm Fix* Siren Fix 100%** 80% 70% 60%
EUR/USD 1.13514 1.13431 $732 $439 $293 $146
USD/JPY 144.287 144.301 $97 $58 $39 $19
GBP/USD 1.34832 1.3479 $312 $187 $125 $62
AUD/USD 0.64352 0.64313 $606 $364 $243 $121
USD/CAD 1.37495 1.37586 $661 $397 $265 $132
NZD/USD 0.59698 0.59659 $654 $392 $261 $131
USD/CHF 0.82171 0.82235 $778 $467 $311 $156
USD/NOK 10.21603 10.22351 $732 $439 $293 $146
USD/SEK 9.60534 9.61261 756 $454 $303 $151
Average     $592 $355 $237 $118

*According to Siren FX calculation using NewChange FX data

** Savings are in dollars per million by percentage of correlation to the Fix flow. Blue cells signify a projected saving using Siren, Red cells a saving using WMR

It is perhaps not insignificant that there was a degree of confusion over month-end flows leading into the 4pm Fix on May 30, based on equity and bond performance, several banks signalled expectations of dollar buying, however the models signalling dollar selling, especially versus G10. This was especially the case in USD/JPY, which saw a strong sell off by some 45 points, followed by a 90-point rally leading into the WM window.

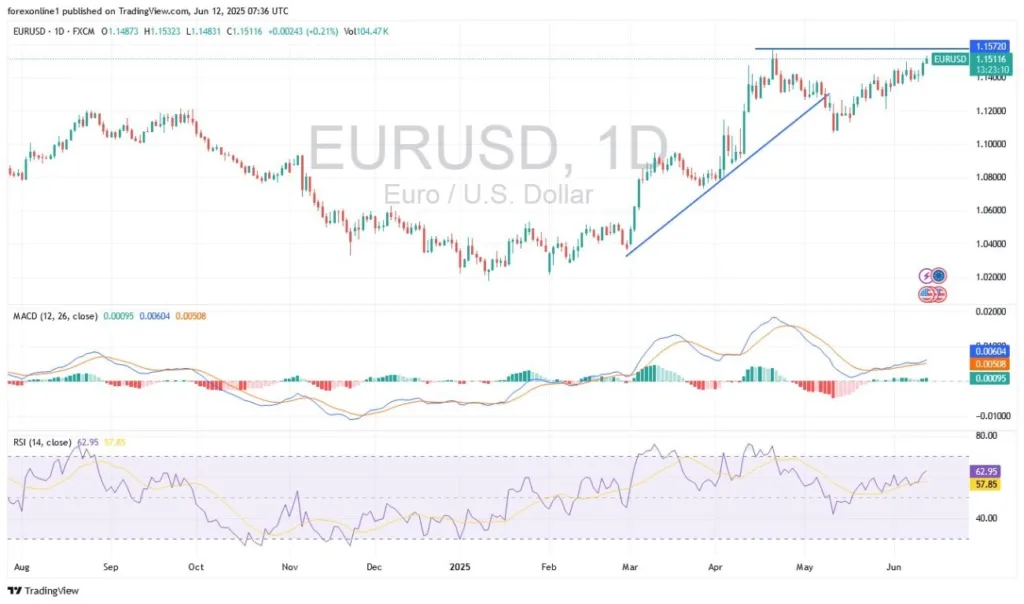
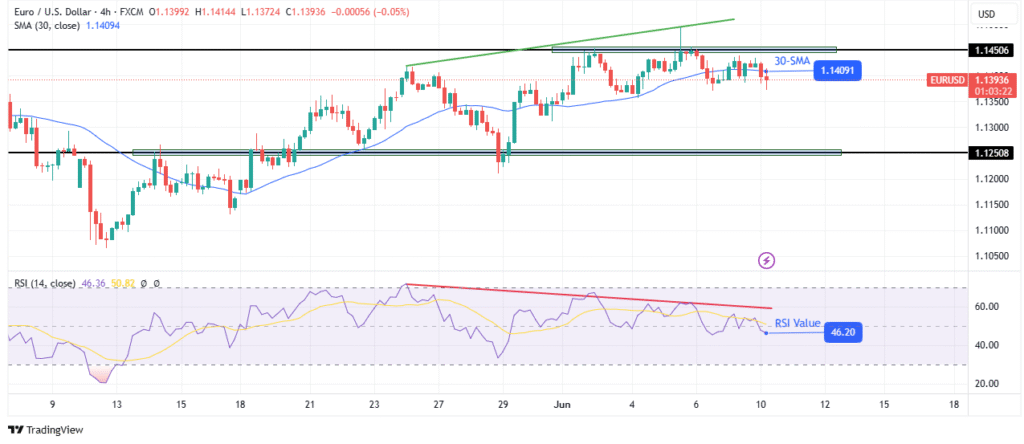
EUR/USD in contrast, with one small selling spurt, saw steady EUR buying for some 10 minutes ahead of the WM window opening. The pair entered the five-minute window some 20 points higher, before rising another 10 pips ahead of two-way trading setting in for the second half of the window.

The pair traded sideways exiting the WM window, highlighting that the demand for euros in that period far outweighed the market’s capacity, thus providing an example of why critics of the shorter mechanism call for a longer calculation period.

Source: Siren FX

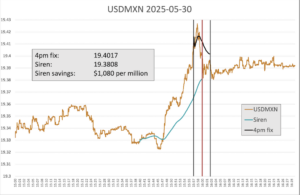
Every month, The Full FX is selecting an emerging market currency pair at random, and before the data is available, to broaden the analysis – this month the selected pair is USD/MXN. Data is again provided by Siren FX according to the same guidelines in place for the regularly reported currency pairs.

Source: Siren FX

There was pronounced dollar buying ahead of the WM window, driving the pair more than nine big figures higher in the 10 minutes up to the opening of the calculation window. This sharp move continued in the early stages of the WM window, before an equally sharp reversal after about one minute. This could be the result of a dollar sell order hitting the market, but is more likely to have been selling by speculators, tipped off by the hedging activity in the lead up.

The potential saving from using the 20-minute methodology was $1,080 per million, down from that in April in USD/ZAR, but well above the 2024 average of $774 per million. For the 48 months that The Full FX has been publishing the data, the average emerging market pair saving is just under $1,060 per million.

Source link

Visited 1 times, 1 visit(s) today

Related Article

IC Markets goes live with cTrader Copy Trading widget

IC Markets goes live with cTrader Copy Trading widget

IC Markets, a leading Forex and CFDs provider, offering trading solutions for active day traders, scalpers and traders new to the forex market, has announced the successful integration of the cTrader Copy widget into its client area. This marks a step forward in delivering a faster, simpler and more engaging trading experience by enabling direct

EUR/USD Analysis Today 12/06: Attempts to Break Peak (Chart)

Attempts to Break Peak (Chart)

EUR/USD Analysis Summary Today Overall Trend: Bullish Today’s EUR/USD Support Levels: 1.1430 – 1.1360 – 1.1290 Today’s EUR/USD Resistance Levels: 1.1520 – 1.1600 – 1.1720 EUR/USD Trading Signals: Buy EUR/USD from the support level of 1.1380 with a target of 1.1420 and a stop-loss at 1.1300. Sell EUR/USD from the resistance level of 1.1570 with

Forex Trading Discord Groups – All You Need to Know!

Forex trading Discord groups can offer active communities of like-minded traders, free signals, and other relevant content. Forex trading Discord channels continue to grow in popularity, and Daily Forex conducts in-depth and impartial reviews based on what traders require. We ignore market gimmicks and spot scammers, fraudsters, marketers, and impostors to offer you the hottest

Dollar Crushed as Dovish Inflation Data and Trade Tensions Weigh; Euro Surges to Multi-Year High

Dollar accelerated its broad-based selloff in early US trading, plunging to its lowest level against Euro since 2021. The latest catalyst came from softer-than-expected May PPI data, which followed Wednesday’s downside surprise in CPI. The tandem inflation prints have further calmed fears of immediate tariff-driven price pass-through, at least for now, and are reinforcing expectations

Sunset Market Commentary – Action Forex

Markets One way to put it is saying that you are prepared to roll the date forward for countries/blocs which are negotiating in good faith. US Treasury Secretary Bessent framed it like this when asked about the approaching end date (July 8) to the 90-day pause for reciprocal tariffs on all countries expect China (early

Scalping Trading – Halal or Haram

By Huzefa Hamid Reviewer DailyForex.com Team Created on June 12, 2025 Scalping is not automatically Halal or Haram. Instead, its permissibility depends on multiple specific components, such as the underlying assets, whether interest is involved, and whether there is excessive risk, among other factors. In this article, we’ll conduct a full analysis of the conditions

EUR/USD technical outlook

EUR/USD Outlook: Bulls Pounce 1.16 Amid Hawkish ECB

The EUR/USD outlook is positive amid a hawkish ECB and a weaker dollar. Tariff concerns and downbeat US CPI continue to weigh on the dollar. Trade talks and US PPI remain the limelight events for now. The EUR/USD outlook stays strongly bullish as the pair breaks multi-month highs, nearing 1.1600 during the European session. The

The rupee could move within a range of 85.40-90 during the day, with the mid-month demand coming up for oil, defence, and government payments, forex traders said. File

Rupee rises 6 paise to 85.51 against U.S. dollar in early trade

The rupee could move within a range of 85.40-90 during the day, with the mid-month demand coming up for oil, defence, and government payments, forex traders said. File | Photo Credit: Reuters The Indian rupee rose 6 paise to 85.51 against the U.S. dollar in early trade on Wednesday (June 11, 2025), aided by strong

EUR/USD Daily Outlook – Action Forex

Daily Pivots: (S1) 1.1383; (P) 1.1415; (R1) 1.1458; More… Range trading continues in EUR/USD and intraday bias stays neutral. Price actions from 1.1572 are seen as a corrective pattern to rally from 1.0716. While rebound from 1.1064 might extend, strong resistance should emerge from 1.1572 to limit upside. On the downside, break of 1.1356 support

HFM Announces Upgraded Trading Conditions to Zero Account Type

HFM Announces Upgraded Trading Conditions to Zero Account Type

HFM have announced that clients with an MT5 Zero Account will now receive lower commission rates on GOLD trades. Written by: Sophia Cruz • Wednesday, June 11, 2025 • 1 min read • Last updated: Wednesday, June 11, 2025 Add an article to your Reading List Register now to be able to add articles to

Gold Analysis Today 11/06: Upward Momentum (Chart)

Gold Analysis Today 11/06: Upward Momentum (Chart)

Today’s Gold Analysis Overview: The overall Trend for Gold: Bullish Today’s Gold Support Levels: $3310 – $3255 – $3160 per ounce Today’s Gold Resistance Levels: $3355 – $3380 – $3420 per ounce Today’s gold trading signals update: Sell Gold from the resistance level of $3370 with a target of $3280 and a stop-loss at $3400.

May CPI Could Shape Fed Outlook

Forex Signals Brief June 11: US CPI Data Looms Large as Trade Effects Eyed

btc-usd Investors are watching this week’s U.S. CPI release closely for signs of whether April’s inflation uptick was a blip—or the start of a…. Written by: Skerdian Meta • Wednesday, June 11, 2025 • 3 min read • Last updated: Wednesday, June 11, 2025 Add an article to your Reading List Register now to be

Trade and Inflation in Focus

Trade headlines are striking an optimistic tone this week. According to Bloomberg, US and Chinese officials have agreed to a plan ‘to ease trade tensions,’ a move that could revive the flow of sensitive goods between the world’s two largest economies. Meanwhile, the US and Mexico appear close to finalising a deal that would lift

EUR/USD Analysis Today 10/06: Awaits Key US Releases (Chart)

Awaits Key US Releases (Chart)

EUR/USD Analysis Summary Today Overall Trend: Bullish. Today’s Euro-Dollar Support Levels: 1.1375 – 1.1300 – 1.1220. Today’s Euro-Dollar Resistance Levels: 1.1460 – 1.1520 – 1.1600. EUR/USD Trading Signals: Buy Euro-Dollar from the 1.1340 support level with a target of 1.1420 and a stop-loss of 1.1300. Sell Euro-Dollar from the 1.1480 resistance level with a target

EUR/USD technical outlook

EUR/USD Outlook: Dollar Strengthens on US-China Trade Talks

The EUR/USD outlook shows optimism over the ongoing trade talks between China and the US. Market participants are eagerly awaiting the US inflation report. Traders expect the next Fed rate cut in October.  The EUR/USD outlook shows optimism over the ongoing trade talks between China and the US, which is supporting the dollar. However, the

ET logo

Subdued Asian FX, ‘matching’ flows anchor rupee in quiet trading day

The Indian rupee logged its quietest trading session in more than a month on Tuesday, tracking muted moves in most Asian currencies and anchored by two-sided client flows, traders said. The rupee closed at 85.6025 against the U.S. dollar, nearly unchanged from its close of 85.62 in the previous session. The currency hovered in the

Trade Optimism Reins – Action Forex

The week started on a quiet note in the US and with some weakness in Europe, where many were off due to a religious holiday. But futures are in positive territory this morning as traders return to their desks. One of the main drivers of optimism is the renewed momentum in US/China trade talks. The

Markets Eye US-China Trade Talks for Fresh Catalyst

Asian equity markets opened the week on a positive note, supported by cautious optimism surrounding the high-stakes US-China trade negotiations in London. US Treasury Secretary Scott Bessent, along with Commerce Secretary Howard Lutnick and Trade Representative Jamieson Greer, are meeting Chinese counterparts as efforts to revive dialogue intensify. The outcome of these talks could set

Gold Analysis Today 09/06: Gold's Rally May Fail (Chart)

Gold’s Rally May Fail (Chart)

Today’s Gold Analysis Overview: The overall Gold Trend: Bullish. Today’s Gold Support Levels: $3295 – $3240 – $3180 per ounce. Today’s Gold Resistance Levels: $3355 – $3380 – $3420 per ounce. Today’s gold trading signals update: Sell Gold from the $3370 resistance level with a target of $3280 and a stop-loss of $3400. Buy Gold

0
Would love your thoughts, please comment.x
()
x