I wrote on 27th April that the best trades for the week would be:
- Long of the EUR/USD currency pair following a daily (New York) close above $1.1517. This did not set up.
- Short of the USD/JPY currency pair (New York) close below ¥140.75. This did not set up.
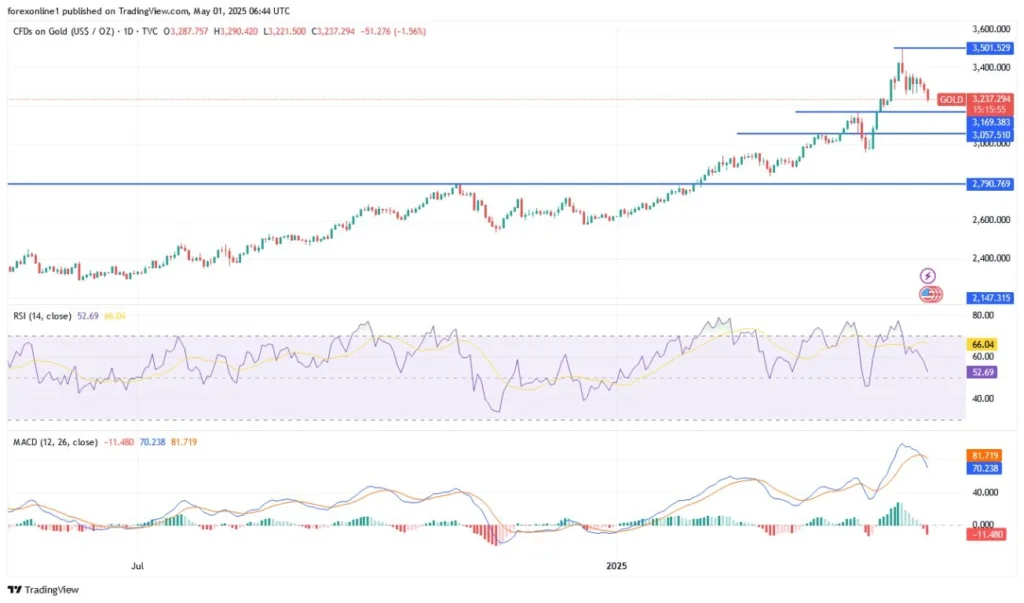
- Long of Gold following a daily (New York) close above $3,425. This did not set up.
- Short of the USD/MXN currency pair. This rose by 0.39% over the week.
The overall result was a loss of 0.39%, which was 0.10% per asset.
Last week saw a calmer and more bullish market as we seem to have moved beyond any new tariff bombshells. Negotiations will be ongoing until the 90-day period ends in early July. You can see the areas hit hardest by the tariff issue are the ones which are now doing the best, such as the US Dollar and even more so, commodity currencies such as the Canadian and Australian Dollars.
Beyond that, although not especially significant, the major events of last week were the lower-than -expected inflationary indicators in the USA, but the surprise was the shrinking GDP data which might indicate the start of a recession. Despite that, the week ended with US stock markets and the US Dollar firmly higher.
Last week’s major data points were:
- US Core PCE Price Index – came in a fraction lower than expected, showing no change over the month, which was logically bearish for the greenback but bullish for US stocks.
- US Average Hourly Earnings – a fraction lower than expected, showing only a 0.2% increase on the month, which reinforced the point 1. above.
- US Non-Farm Employment Change – this was larger than expected, somewhat contradicting the potentially recessionary Advance GDP data.
- US Advance GDP – this showed a shock 0.3% decline over the past month, when it was expected to increase by 0.2%. This shook the greenback and US stocks somewhat earlier in the week when the data was released.
- German Preliminary CPI – this was slightly higher than expected, printing a 0.4% month-on-month increase.
- Australian CPI (inflation) – this was a fraction higher than expected, leaving the annualized rate unchanged at 2.4%, which makes a rate cut a little less likely, helping to boost the already strong Aussie.
- Bank of Japan Policy Rate, Monetary Policy Statement, and Outlook Report – no surprises, rates were left unchanged.
- Canadian GDP – this showed a contraction month-on-month of 0.2%, so like the USA, we may have seen the first indication that a recession is starting. This seems to have had little effect on the Loonie though, which remains strong.
- Canadian Federal Election – the governing Liberals won a narrow victory but only managed to secure a minority government.
- Australian Parliamentary Election – the result was a surprise, with the governing Labor party winning a landslide majority. This is the first Australian government to be re-elected with a majority since over 20 years ago.
- US JOLTS Job Openings – worse than expected, with 7.2 million jobs compared to the 7.5 million anticipated.
- US ISM Manufacturing PMI – practically as expected.
- US Employment Cost Index – as expected.
- US Unemployment Claims – practically as expected.
- US Unemployment Rate – as expected.
- Chinese Manufacturing PMI – practically as expected.
The coming week has a less intense schedule of important releases but notably will include policy meetings at the US Federal Reserve and the Bank of England.
This week’s important data points, in order of likely importance, are:
- US Federal Funds Rate / Statement
- Bank of England Policy Rate / Summary / Report
- Swiss CPI
- US ISM Services PMI
- US Unemployment Claims
- Canada Unemployment Rate
- New Zealand Unemployment Rate

For the month of April 2025, I made no monthly forecast, as at the start of that month, the Forex market was dull and there were only mixed long-term trends.
For the month of May 2025, I again made no monthly forecast as although there is a long-term trend against the US Dollar, the price action suggests a major bullish reversal could be underway.
As there were no unusually large price movements in Forex currency crosses over the past week, I make no weekly forecast.
The Australian Dollar was the strongest major currency last week, while the Japanese Yen was the weakest. Volatility decreased again last week, with only 22% of the most important Forex currency pairs and crosses changing in value by more than 1%. Next week will likely see a similar volatility as there will be two high-impact central bank policy meetings, including in the USA.
You can trade these forecasts in a real or demo Forex brokerage account.

Last week, the US Dollar Index printed a bullish candlestick which closed above the former resistance level at 99.27. The price reached a new 4-year low a couple of weeks ago before bouncing strongly off the support level shown in the price chart below, at 97.67. As the rise has continued, these are bullish signs, but the strong long-term bearish trend is a bearish sign.
It is hard to say what will happen to the US Dollar next week after this bullish bounce, but trading in line with the long-term trend would be short of the greenback. Much may depend on the FOMC meeting scheduled for Wednesday this week. It did not seem last week as if the poor GDP data and slightly better than expected average hourly earnings data had much impact on the price of the greenback.

The EUR/USD currency pair fell again last week with a moderately bearish candlestick which followed the previous week’s bearish pin bar. This is a bearish sign and suggests we may have seen a major bearish reversal. However, the long-term trend is still bullish, the price has recently been trading in blue sky, and this currency pair tends to trend slowly but reliably.
So, it may still be worth being involved on the long side here, but I’d want to see a new significant bullish breakout first. Once we get a daily (New York) close below about $1.1260, that will shake out a lot of trend traders from any existing long positions. The support level at $1.1241 could also be significant if it breaks down.
If the price can get established above $1.1517 that will probably be a good long trade entry signal, as there are no key resistance levels above that area for a few hundred pips.

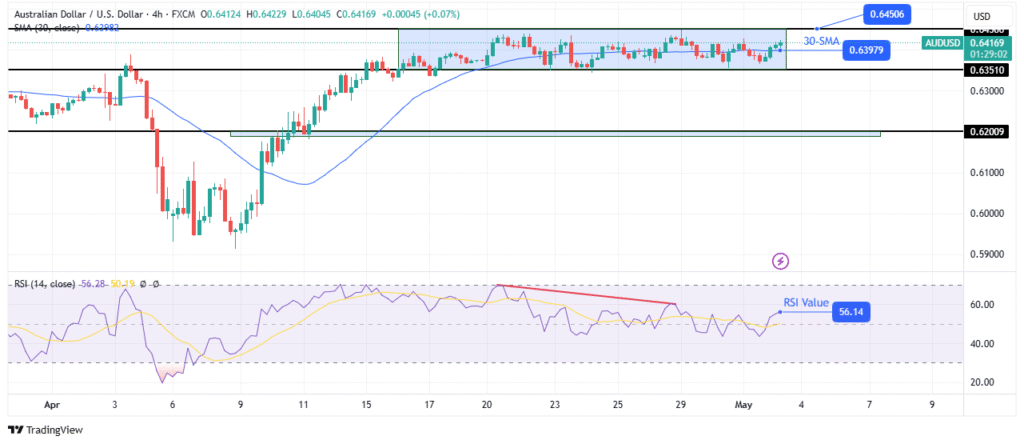
The AUD/USD currency pair printed a bullish candlestick last week, with the Aussie being one of the few major currencies which gained against the US Dollar over the past week – it was commodity currencies which performed best over recent days.
We have seen four consecutive weeks of strong gains, and the momentum seems to be holding steady as risky assets continue to recover in this macro environment, notably including stock markets, and the Aussie typically goes along with that.
The price last week traded at a near 5-month high, and with the solid result in the Australian election over the weekend producing a majority government, we may see the Aussie and the Australian stock market remain in a bullish move as markets open as the week begins in Asia.
Unfortunately, this currency pair tends to trend unreliably, so I do not like to follow trends here and I cannot suggest a trend-following opportunity. It could be that we have already seen a significant bearish double top at $0.6470.

The USD/CAD currency pair fell again last week, continuing its long-term bearish trend, although the trend seems to be running out of momentum as the supportive area below $1.3800 continues to hold.
The bearish trend is one of the few surviving long-term trends against the USD, with the price above its levels of both 3 and 6 months ago.
The Canadian Dollar is strong as a commodity currency as risk-on sentiment has continued to recover as the Trump Administration successfully kicked the tariffs can down the road to July, although it will resurface as an issue before then. The successful re-election of the Canadian government is also contributing to the stronger Loonie.
Despite the clear long-term trend, I don’t find this pair’s trends are very reliable. Yet the relative strength in the Canadian Dollar could make it a good long counterparty for an FX trade this week where the focus is on the currency to go short of.

The S&P 500 Index advanced again last week on improved risk sentiment, despite the surprisingly negative Advance GDP data. The price has risen to get quite close to the 200-day moving average and the confluent resistance levels at 5713 and 5786. If the price can continue its advance over the coming week and get established above this structure, that would be a bullish sign. The price has already advanced by more than 17% since the big low was made barely four weeks ago!
Despite the bullish potential, it may be that this resistant area near the 200-day moving average holds as resistance and produced a bearish reversal.
Traders who were active during and after the coronavirus crash of 2020 might find the current situation familiar, although the 2020 decline was much stronger and faster than what we saw here at the height of the panic over Trump’s tariffs. What was unusual about 2020 was the recovery – the price just kept going up and up from the low, when it might have been expected to bump around for a while, as bear markets typically take at least several months to play out.
Shorting US equity indices is very risky and probably not advisable to anyone except a very experienced trader. This is especially true as we are now seeing such signs of resilience.
I believe there is going to be more turbulence in the stock market over the coming months as we approach the 90-day tariff deadline in early July, so I am happy to be out of stocks for now. However, if the price ends the week near the weekly high and above 5786, the bullish case is going to look stronger.

The USD/MXN currency pair has continued to look heavy as it weighs on the key support level at $19.4933, which is confluent with the major half-number at $19.5000. If the price breaks below this area, it could fall strongly and quickly.
Despite the greenback’s recovery over the past couple of weeks, the Mexican Peso has been one of the very few currencies which continues to show strength against the greenback as well as standalone long-term relative strength.
The fundamental driver behind the strong Mexican Peso is the way the trade war between the USA and Mexico has been defused, at least until late June. Absent any sign of worse US intentions, the price is prone to making a sharp bearish breakdown below $19.4933.
If we get a daily (New York) close below $19.4933 I will enter a short trade.

I see the best trades this week as:
- Long of the EUR/USD currency pair following a daily (New York) close above $1.1517.
- Short of the USD/MXN currency pair following a daily (New York) close below $19.4333.
Ready to trade our weekly Forex forecast? Check out our list of the top 5 Forex brokers in the world.