I wrote on 2nd March that the GBP/NZD currency pair would likely fall in value. Unfortunately, it rose in value by 0.71%.
Last week saw several data releases affecting the Forex market:
- US Average Hourly Earnings – a month-on-month increase of 0.3% as expected.
- ECB Main Refinancing Rate & Monetary Policy Statement – the rate cut of 0.25% was widely expected, but the ECB cut its growth forecast which could be seen as a small dovish surprise.
- US Non-Farm Employment Change – this was just a little less than expected.
- US ISM Services PMI – slightly better than expected.
- US ISM Manufacturing PMI – almost exactly as expected.
- Australian GDP – as expected.
- Swiss CPI (Inflation) – the month-on-month increase was 0.6%, slightly higher than the widely expected 0.5%.
- US Unemployment Claims – just a little less than expected.
- US Unemployment Rate – this unexpectedly increase from 4.0% to 4.1%.
- Canadian Unemployment Rate – this was expected to tick higher, but it stayed at 6.6%.
Last week’s key takeaways were:
- The data outlined above was inconsequential for the markets, which are much more concerned with the US-centered trade war which seems to be underway without a clear end.
- The ongoing trade war between the USA on one side and Canada, Mexico, China and potentially the European Union on the other is what has really been driving market movements over the past week. There is no deal in sight and the new tariffs remain in place, causing economic harm to all three countries.
- It was a bad week for stock markets, especially in the USA, where major indices dropped sharply enough to shake out more trend followers from long positions, with many institutions either reducing or eliminating their exposure. Friday saw some gains, however.
- Market sentiment is basically in risk-off mode, with commodities and commodity currencies taking a serious beating. Even Gold, which had been holding up relatively well, has not been able to reach a new high.
- In the Forex market, the Euro made very strong gains, while the US Dollar was weak.
- There are concerns that the USA may be starting to tip into recession after the Atlanta Fed data suggested GDP could be running at an annualized decline of 2.4%.
- President Trump announced the creation of a strategic crypto reserve for the USA, also stating he wanted to see stablecoin legislation passed by the end of this summer. This gave crypto a temporary boost, but major cryptocurrencies quickly gave up all gains as it was realized the US government would still not be purchasing crypto.
The coming week has a lighter schedule of important releases, so we are likely to see less volatility in the Forex market over the coming week.
This week’s important data points, in order of likely importance, are:
- US CPI (inflation)
- US PPI
- US Preliminary UoM Inflation Expectations
- Bank of Canada Overnight Rate & Rate Statement
- US Preliminary UoM Consumer Sentiment
- US JOLTS Job Openings
- UK GDP

For March 2025, I made no forecast, as there were no clear trends at the start of this month.
Last week, I forecasted that the following currency cross would fall in value over the week:
- GBP/NZD – rose by 0.71%
This was not a profitable call.
This week, I forecast that the following currency crosses will fall in value:
The Euro was the strongest major currency last week, while the US Dollar was the weakest, putting the EUR/USD currency pair in focus. Volatility increased last week, with 70% of the most important Forex currency pairs and crosses changing in value by more than 1%. It is likely to remain at a similar level over the coming week, despite the lighter agenda, due to US inflation data due, and the ongoing trade war.
You can trade these forecasts in a real or demo Forex brokerage account.

Last week, the US Dollar Index printed the largest weekly bearish candlestick in almost 2.5 years. The Dollar was the worst performing major currency last week and suffered a big loss, closing back within its dominant recent range and well below its level from 3 months ago, invalidating its former long-term bullish trend. At one point, the price reached a new 4-month low.
These are bearish signs, although there is some lower wick suggesting a little buying at the low.
Global markets have entered a strongly risk-off mode, but the greenback does not benefit because of the uncertain trade war the US is now engaged in against Canada, Mexico, and China, with no end in sight.
Trades taken over the coming week will probably be best positioned against the US Dollar, at least until a deal is announced replacing reciprocal import tariffs involving the USA.

The EUR/USD currency pair made a huge gain over the week, rising by more than 4%, which is unusual. The key driver is certainly the US-centered trade war, which has sent the greenback flying lower, while the Euro has gained as a store of value.
Although the European Central Bank met last week and gave a slightly dovish report, as well as cutting rates by 0.25%, that was not enough to weaken the Euro at all.
Despite the strong bullish move, the daily price chart below shows that the bulls may have run out of steam towards the end of last week, with the final two daily candlesticks close to looking like bearish pin bars. Another factor is the tight cluster of resistance levels overhead which are confluent with a major bearish inflection point near the major round number at $1.1000.
Another bearish factor is that the moving averages are misaligned: although the price has made a bullish breakdown to new multi-month highs, the 50-day moving average is still below the 100-day moving average, and this is often used as a filter by successful trend traders, suggesting we are most likely to see a bearish reversal.
I caution traders positioned long here to think about exiting and suggest that other traders consider a short trade, if and when we get a reversal from a key resistance level.

The USD/JPY currency pair fell last week to trade at a new 5-month low. Trend traders would have got signals to go short here last week but this was stopped by one key filter still saying no short trade: the 50-day moving average remains above the 100-day moving average.
Note how the price rejected the low of the week Friday and the support level at ¥147.84 with a bullish pin bar. This is certainly not decisive, but until the price makes a stronger fall and erases that low with a strongly bearish close, it will be unwise to go short. Also, the moving averages need to cross.
The US Dollar is very weak due to the US-centered trade war, and the Japanese Yen typically benefits in this kind of risk-off situation where the greenback cannot. The Yen also has a tailwind as Japanese wage inflation is clearly rising and the Bank of Japan seems set to implement meaningful rate hikes for the first time since 2008.

The S&P 500 Index fell strongly last week and reached a level nearly 8% below its record high which was made barely more than 2 weeks ago. The main reason for the strong drop in most global stock markets, and the major US indices in particular, is of course the large tariffs President Trump has imposed on US imports from Canada and Mexico, and the fact that neither country seems close to capitulating or to make the kind of deal President Trump would want to call off the tariffs. The US tariffs are just negotiation by another means.
Technically, what is most interesting here is that the price on Thursday and Friday traded below the 200-day moving average, which is drawn within the daily price chart below. This indicator is used to establish a technical bear market, and it is interesting we have not yet had a daily close below it. This suggests that this moving average may be acting as a mobile pivotal point. If the price keeps refusing to close below it, we may see the start of another bullish rally, and if a tariff deal were then concluded, that would give a big tailwind to any bullish push.
Personally, as a trend trader, I will not be entering any new long trades until we see the price make a new record high, and that might not happen for quite a long time.

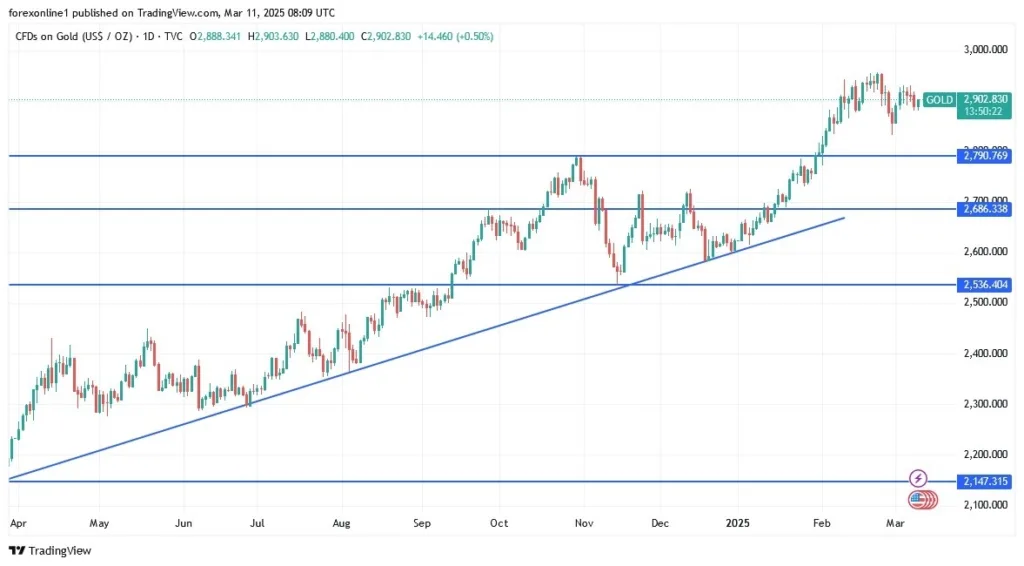
It was a poor week for commodities generally, with the possible exception of Gold, which mostly traded not far away from its recent all-time high just above $2,950.
One of the very few exceptions is Natural Gas. The nearest futures contract of Henry Hub natural gas rose during last week to make a new 2-year high and ended the week not far from that.
So, what is driving Natural Gas higher? Most analysts see it as a combination of extreme cold weather, seasonality, and strong demand plus weak supply.
March can be a pretty cold month in the Northern Hemisphere, and the cold can even stretch into April, so there is reason to believe this long-term bullish trend might continue for a while longer yet.
If you are worried about the generally poor environment for commodities and start of the spring season later this month, you could pass on this long trade or take an unusually small position.

I see the best trades this week as:
- Long of Natural Gas futures.
- Short of the EUR/JPY and EUR/NZD currency crosses.
Ready to trade our Forex weekly forecast? Check out our list of the top 10 Forex brokers in the world .