I wrote on 30th March that the best trades for the week would be:
- Long of Gold, which fell by 1.78%.
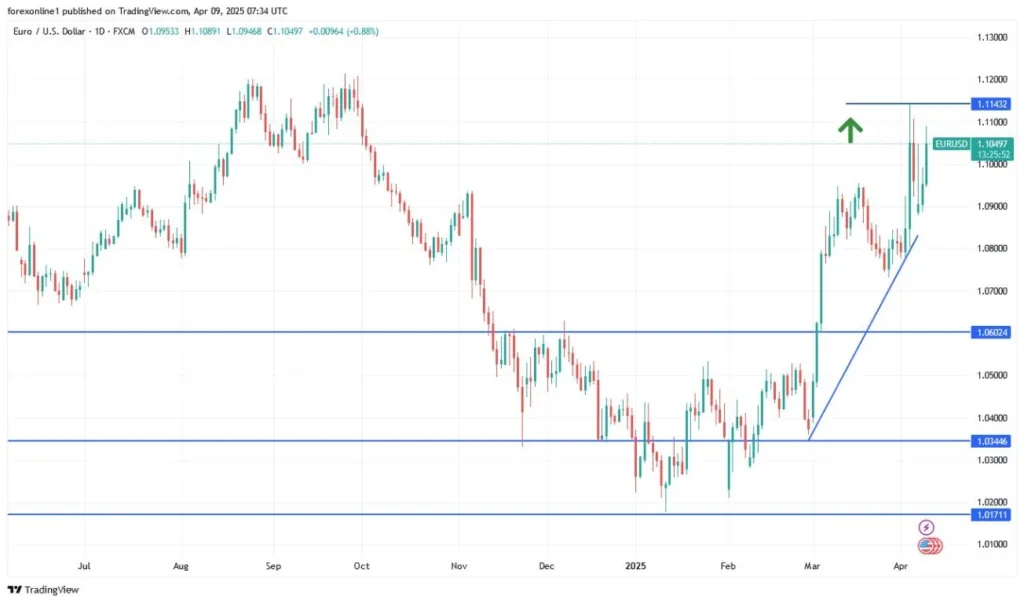
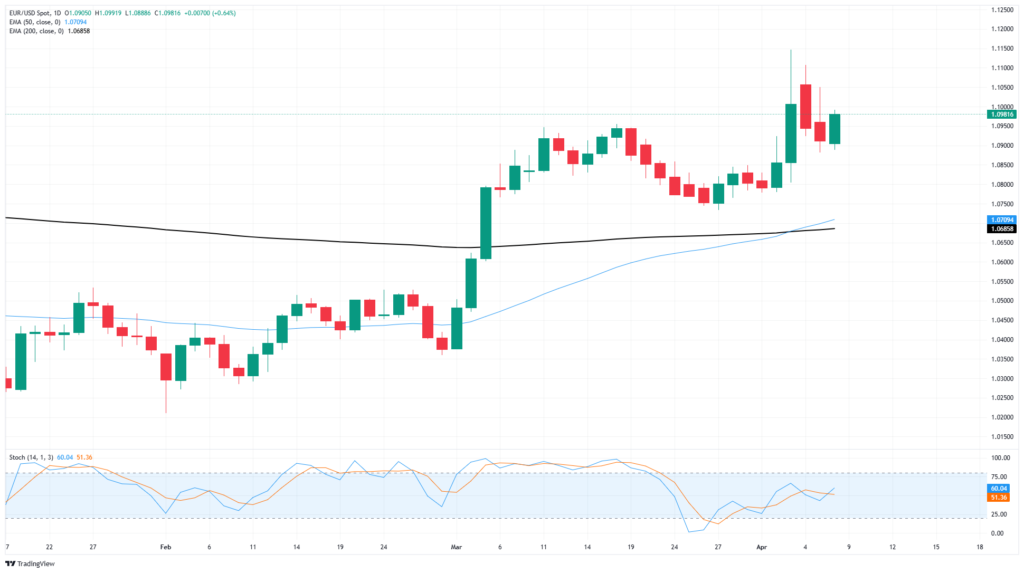
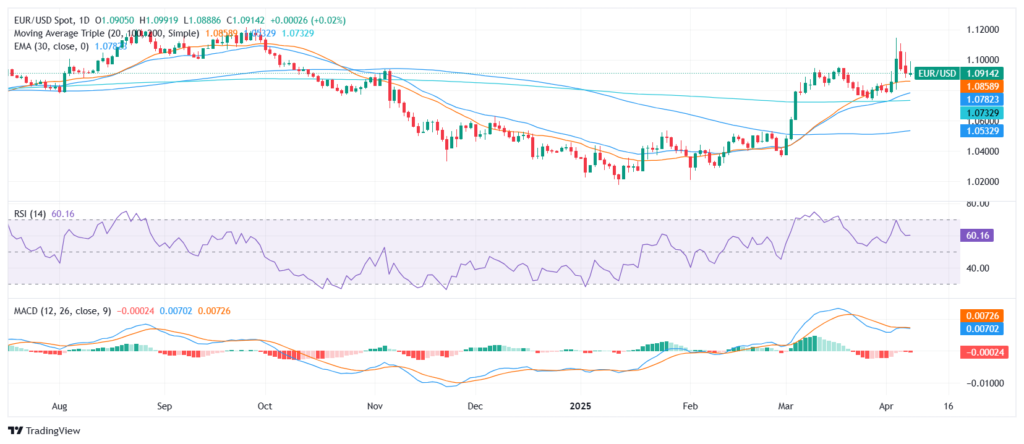
- Long of EUR/USD following a daily close above $1.0951. This set up on Thursday, but the week ended lower by 0.80%.
- Long of US Copper futures following a daily close above $5.25. This did not set up.
The overall result was a loss of 2.58%, which was 0.86% per asset.
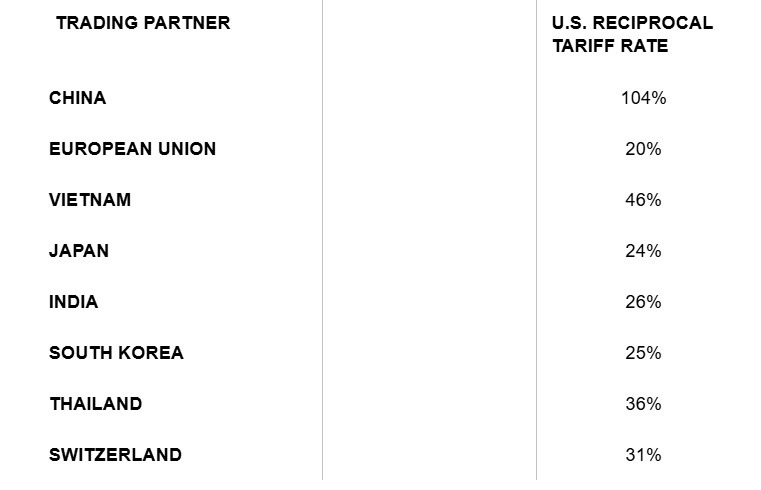
Last week saw the Presidency of the USA announce new tariffs on imports which were set at a flat 10% with many individual countries given higher rates, sometimes considerably so. The key USA trading partners tariffs were set at:
- China 54%
- Japan 24%
- European Union 20%
- Canada 25%
- Mexico 25%
The tariffs have been justified as “reciprocal” by President Trump, with the White House publishing an infographic showing the tariffs imposed and the claimed related “tariffs and other barriers to trade” imposed on US exports by the same countries, which were invariably higher, hence Trump’s claim that he is being “kind”. However, the numbers given are extremely questionable and certainly cannot be verified as tariffs or taxes on imports but seem to have been calculated by comparing the balance of trade between the USA and the relevant nation.
No country except China has yet reacted by imposing retaliatory tariffs against the USA. The Trump administration will be hoping that the tariffs on both sides will be mostly negotiated away, which would likely provide a boost to US corporate profits and economic growth. However, if this does not happen, especially with the key US trading partners, it is hard to see how the world will escape a global recession and a renewed spike in inflation.
The tariffs were somewhat worse than expected and have triggered huge market moves which rival the coronavirus crash of 2020 and the market crash of 2008, especially in US stock markets and in certain currencies (especially the commodity currencies and the Japanese Yen) and major commodities, such as foodstuffs, energies, and metals. Markets are extremely volatile, and the usual technical factors will be mostly irrelevant, with the future of the tariffs being the only major question driving prices over the short term.
There were a few important data releases last week which should also be noted:
- US Average Hourly Earnings – as expected.
- US Non-Farm Employment Change – this was much better and stronger than expected, showing 228k net new jobs created when only 137k were expected, suggesting the US economy is stronger than thought.
- US Unemployment Rate – this rose unexpectedly from 4.1% to 4.2%.
- US JOLTS Job Openings – a bit worse than expected, suggesting a slowing economy.
- US ISM Manufacturing PMI – this was slightly worse than expected.
- German Preliminary CPI (inflation) – a 0.3% increase month on month, as expected.
- Swiss CPI (inflation) – a tick lower than expected, completely flat month on month.
- Reserve Bank of Australia Policy Meeting – the Cash Rate was left unchanged at 4.10% as expected.
- US ISM Services PMI – this was worse than expected.
- US Unemployment Claims –as expected.
- Canadian Unemployment Rate – as expected, this rose from 6.6% to 6.7%.
The coming week has a lighter schedule of important releases, but the releases are the most important ones in the market. However, unless there is more news about the tariff issue, volatility is likely to be at least a little bit lower this week.
This week’s important data points, in order of likely importance, are:
- US CPI (inflation)
- US PPI (Purchasing Power Index)
- US FOMC Meeting Minutes
- US Preliminary UoM Inflation Expectations
- US Preliminary UoM Consumer Sentiment
- Reserve Bank of New Zealand Official Cash Rate and Rate Statement
- UK GDP
- US Unemployment Claims

For the month of April 2025, I again made no monthly forecast, as the Forex market was dull and there were only mixed long-term trends.
Last week, I made no weekly forecast, as there were no unusually strong movements in any weekly currency crosses.
This week, I make weekly forecasts as there have been very strong price movements in currency crosses:
- GBP/JPY is likely to rise
- AUD/JPY is likely to rise
- GBP/CHF is likely to rise
- NZD/JPY is likely to rise
- EUR/NZD is likely to fall
- EUR/AUD is likely to fall
- GBP/AUD is likely to fall
- AUD/CAD is likely to rise
- NZD/CAD is likely to rise
- NZD/CHF is likely to rise
The Japanese Yen and the Swiss Franc were the strongest major currencies last week, while Australian Dollar was the weakest. Volatility increased markedly last week, with more than 75% of the most important Forex currency pairs and crosses changing in value by more than 1%. Next week will likely see relatively high volatility as the tariff saga continues, but it will likely be at least a little lower than the volatility we saw last week.
You can trade these forecasts in a real or demo Forex brokerage account.

Last week, the US Dollar Index printed a very large bearish candlestick, but the price regained most of its losses at the end of the week, leaving a large lower wick. There was a lot of movement in the Forex market last week due to the US announcing large tariffs on imports.
The price is well below its level of 3 months ago, invalidating its former long-term bullish trend. The price is still above its level from 6 months ago, but not by much. The support level at 102.25 held, and this level is starting to look like the last pivotal defense against the formation of a new long-term bearish trend in the greenback.
It is very difficult to say what will happen next, as the Dollar will be driven by political developments – whether the tariffs are negotiated away, or whether they stay or even increase, is likely to make all the difference.

The NASDAQ 100 Index fell very sharply last week, closing in bear market territory for the first time in almost 4 years. The price is more than 20% off its record high it made just a few months ago and is far below its 200-day moving average. It last saw these levels in August 2024.
The main reason for the strong drop in most global stock markets, and the major US indices in particular, is of course the large tariffs President Trump has imposed on US imports. This tech index is more strongly affected than the broader market, due partly to higher prices of chips which will result, especially from Taiwanese imports. However, the decline is mostly due to uncertainty and a fear of recession.
The price closed near the week’s low, and there is no bottom in sight yet.
The S&P 500 Index fell very sharply last week, closing near bear market territory for the first time in almost 4 years. The price is more than 15% off its record high it made just a few months ago and is far below its 200-day moving average. It last saw these levels in May 2024 almost a year ago.
The main reason for the strong drop in most global stock markets, and the major US indices in particular, is of course the large tariffs President Trump has imposed on US imports. There are many companies which rely upon strong domestic sales in the USA which manufacture abroad that are hard hit. A good example is NIKE, which fell by 14% in one day after the tariffs were announced.
The price closed near the week’s low, and there is no bottom in sight yet. Some analysts are looking to the big round number at 5000 as potential support.

Gold rose firmly last week to reach a new record high just below the round number at $3,200. However, after the new US tariffs were announced, the price see-sawed sharply, selling off strongly twice before closing the week significantly lower, almost three times the long-term average true range off its high closing price. Many trend traders will still be long but will be very close to being shaken out and exiting.
Gold can advance during periods of crisis like the one we are in now but seems to not be behaving as a hedge against risk, and this is common during strongly risk-off markets like we are seeing now.
So, I think it is wise to not be long of Gold right now, unless we get a new record high New York close over the coming week.

The AUD/JPY currency cross fell very strongly over the week, with the Australian Dollar extremely hard hit by Trump’s new tariffs as a major exporter of raw materials for manufacturing, and its close economic ties to China. The Japanese Yen was the week’s big gainer, along with the Swiss Franc, as a safe- haven.
This currency cross is often a barometer of market sentiment, and this is what we see happening here. The price has reached a new 2-year low.
There is a good chance we will see the price rebound somewhat over the coming week, especially if there are any signals of tariff negotiations getting underway, or even if there is no further tariff escalation.
Technically, the fact that we may be seeing a bottom at the big quarter-number of ¥87.50 could also be significant.
It may be wise to drill down and look for a long trade if this bottom continues to hold.

I see the best trades this week as:
- Long of Gold following a daily close above $3,134.31.
- Following these expected movements in the Forex market:
- GBP/JPY is likely to rise
- AUD/JPY is likely to rise
- GBP/CHF is likely to rise
- NZD/JPY is likely to rise
- EUR/NZD is likely to fall
- EUR/AUD is likely to fall
- GBP/AUD is likely to fall
- AUD/CAD is likely to rise
- NZD/CAD is likely to rise
- NZD/CHF is likely to rise
Although it might be tempting to short stock market indices or individual stocks, this is a very risky move for beginners. With such high levels of volatility and relevant political factors, stock markets might make a very strong recovery any day.
Ready to trade our Forex weekly forecast? Check out our list of the top 10 Forex brokers in the world.