Fundamental Analysis & Market Sentiment
I wrote on 22nd March that the best trades for the week would be:
-
Long of the USD/JPY currency pair. This gave a win of 0.95%.
-
Long of Brent Crude Oil but with ¼ of the normal position size. This gave a loss of 1.85%.
Last week’s overall loss of 0.90% is 0.80% per asset.
A summary of last week’s most important data in the market:
-
UK CPI (inflation) – as expected at 3.0%.
-
Australian CPI (inflation) – unexpectedly ticked lower to 3.7%, producing a slight weakening in the Aussie.
-
USA, Germany, UK Flash Services & Manufacturing PMI – manufacturing did better than expected, services did worse.
-
US Unemployment Claims – as expected.
-
UK Retail Sales – slightly better than expected, showing a month-on-month decrease by only 0.4% when a decline of 0.6% was expected.
Last week’s data had little effect on the market. Generally, we are seeing hawkish central banks against the backdrop of a potentially inflationary energy price shock generated by the ongoing war in the Middle East. There are open and frightening questions over how this war might end, and what its global economic effects might be, although reports of imminent catastrophes are exaggerated.
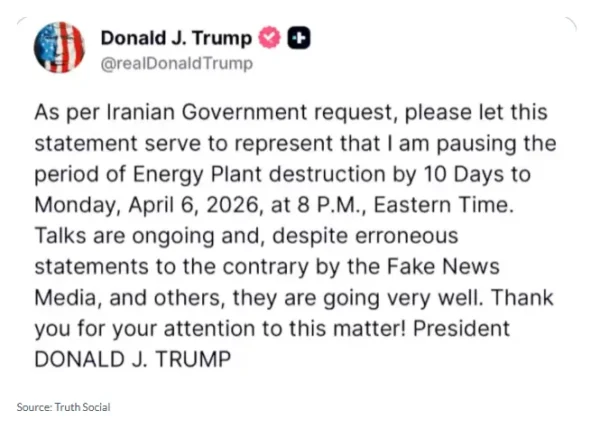
An element of the war took the headlines early last week when President Trump successfully suppressed energy prices by extending the deadline to this earlier threat to begin destroying Iranian power plants by five days, as the USA and Iran were in talks. This immediately triggered a 10% reduction in the price of energies, and the S&P 500 Index jumped by almost 200 points. However, the euphoria was somewhat short lived, as Iran denied any ongoing talks, and gaps between the parties remained reportedly huge and unbridgeable. As the week went on, the price of energies began to rise again, while remaining off recent highs. However, the earlier gains in the stock market evaporated completely, with the S&P 500 Index closing sharply lower at a new 7-month low price.
US politicians have been talking about the war ending soon, but not for a little while, or words to this effect. This tactic of talking up an end to the war while pressing on with as total a destruction as possible of the regime, its nuclear and missile programs, its other military assets, and its financial assets. Tactically, the war has been a stunning success for the USA and Israel, with this destruction having been pressed home.
Although president Trump has pushed it off twice, it is worth remembering that his threat to destroy Iran’s power plants is still live, with a deadline of 6th April.
Prediction markets such as Polymarket suggest that the war will last until May, when after using US troops on the ground in some capacity starting in April, President Trump will likely order a unilateral halt to operations in coordination with Israel. Markets then expect some kind of formal ceasefire deal by the end of May. Concerning US ground troops, there is speculation that they might be used to seize Kharg Island and/or possibly other strategic Islands, or the Hormuz coast, which might provide further economic leverage over the regime. An operation to remove the highly enriched uranium which is still located in Iran is also a possibility.
It seems very likely that the war will end with the regime remaining in power but nearly stripped of its military equipment and programs, facing its people. The regime will probably survive for a while and possibly indefinitely but may not survive the anger of the people and its own weakening. Two issues that will remain to be resolved will be the full opening of the Strait of Hormuz (there are rumours about countries making their own individual deals with Iran about that) and the enriched uranium. Apart from these two issues, it looks as if in two or three weeks from now the US and Israel will announce a halt and hope that Iran stops firing or at least desires to negotiate a ceasefire. It will then remain to be seen whether the USA and Israel will be able to translate a huge tactical gain into a long-term strategic gain.
The price of energies will likely decline when the US and Israel cease fire, and the stock market will probably get a boost, although it seems like the stock market has a bigger underlying problem.
The Week Ahead: 30th March – 3rd April
The middle east war is likely to remain more influential that any economic data releases which are scheduled over the coming week, especially if it escalates towards increased targeting of infrastructure. The top three items have realistic potential to move the market a bit, especially in the US Dollar.
The coming week’s most important data points, in order of likely importance, are:
-
US Average Hourly Earnings
-
US Non-Farm Employment Change
-
US JOLTS Jobs Openings
-
US Retail Sales
-
ADP Non-Farm Employment
-
Canadian GDP
-
US ISM Manufacturing PMI
-
US Unemployment Rate
-
US Unemployment Claims
Friday will be a public holiday in Australia, New Zealand, Germany, Switzerland, the UK, and Canada.
Monthly Forecast April 2026

Currency Price Changes and Interest Rates
For the month of March, I made no monthly Forex forecast as the US Dollar was not in a clear trend at the start of the month.
For the month of April, I forecast that the USD/JPY currency pair will rise in value.
Weekly Forecast 30th March 2026
Last week saw no currency crosses with excessive volatility, so I am making no forecast for the coming week.
The US Dollar was the strongest major currency last week, while the Australian Dollar was the weakest. Directional volatility increased significantly last week, with 30% of all major pairs and crosses changing in value by more than 1%.
Next week’s volatility is likely to remain the same or possibly decline as the week will end a bit early for some due to the Easter holiday. However, the ongoing war in the Middle East retains the ability to roil the market if there are any surprises. This could generate volatility in the US Dollar, the Japanese Yen, and the Canadian Dollar, not to mention stock markets.
You can trade these forecasts in a real or demo Forex brokerage account.
Technical Analysis
Key Support/Resistance Levels for Popular Pairs

Key Support and Resistance Levels
US Dollar Index
The US Dollar printed a bullish candlestick, with a large lower wick, and a close that was right on the high of its range. It was almost the highest weekly close in the past ten months, so we are very close to a significant bullish breakout after a relatively consolidative period.
Other bullish factors are the long-term bullish trend in the Dollar, and rising US Treasury Yields which are also breaking to new long-term highs, pushing the greenback higher.
I think expecting the greenback to rise is the correct approach. It is very difficult to imagine the Middle East war ending surprisingly soon, so we will likely continue to see the same kind of flow which benefits the US Dollar over the coming week.

US Dollar Index Weekly Price Chart
USD/JPY
The USD/JPY currency pair gained firmly last week, finally making the long-anticipated bullish breakout beyond the big round number at ¥160. This is the highest price seen here in over 1.5 years, and the weekly candlestick was a bullish one which closed very near the high of its range. These are bullish signs, as is the fact that the price chart below shows an orderly bullish trend supported by an obvious trend line for about one year now.
I am happy to be long of this currency pair, especially now that we are above ¥160.
The US Dollar was the biggest gainer of all the major currencies last week and seems poised to break higher. The Japanese Yen is relatively weak as markets are still not convinced the Bank of Japan is really going to be able to start getting serious about hiking rates due to massive Japanese debt.

USD/JPY Daily Price Chart
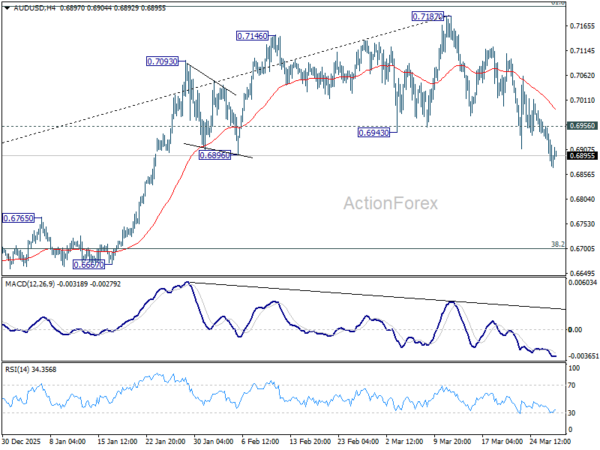
AUD/USD
The AUD/USD currency pair was at the heart of the Forex market last week, with the greenback gaining by more than any other major currency, while the Australian Dollar was the biggest lower. There has been a very long-term bullish trend in the Aussie, which seemed to have decoupled from risk sentiment to some extent, but we see the Aussie getting hit hard as the world faces up to the fact that the Middle East war may now drag out for several more weeks and even escalate, potentially disrupting shipping and raising insurance premiums.
Looking technically at the weekly price chart below, we can see we have a strong bearish U-shaped top, and now the bearish leg has really gained momentum, ending the week very near the low of its range – a bearish sign of bearish momentum.
It is hard to see the current picture changing, barring a sudden surprise end to the war in the Middle East.
I won’t be trading in this currency pair yet, but day traders might want to look for shorts in this currency pair if the week opens with similar bearish momentum as was seen last week.

AUD/USD Weekly Price Chart
Brent Crude Oil Futures
Brent Crude Oil is tending to outperform WTI Crude Oil during this crisis, so if I am looking to the long side which I am here, I will focus on Brent and not WTI.
The price here was looking very bullish last weekend, which is why I saw a long trade, albeit a very small-sized one with only a quarter of normal position size. This trade would have been a big loser at full size, after President Trump talked the price down last Monday by extending the deadline for his threat to destroy Iran’s power plants.
The price has since recovered somewhat, and the action is bullish, but a bit muted.
There is still a potential for escalation and supply disruption within this ongoing war, which prediction markets do not see ending before May, so I remain ready to go long here if we see a new long-term high daily (New York) closing price above $112.
I continue to recommend a small position size, but I would move that up from one quarter of normal size to one half.

Brent Crude Oil Futures Daily Price Chart
Gasoline Futures
RBOB Gasoline futures can be understood by reading what I wrote above for Crude Oil. One thing that is particular to Gasoline is that the price action is even more bullish, and the price is even more sensitive to what is going on in the Middle East, as gasoline companies are very quick to pass on their anticipated higher costs to consumers.
There is still scope here for higher prices due to the war, and the price is much closer to making a breakout to new highs than crude oil is.
I will go long here if we see a daily (New York) closing price above $3.2319 but with only half my usual position size.
If Gasoline futures are expensive for you, and they probably are as there are no Gasoline micro futures, you might try using the ETF UGA or one outside the USA if you prefer – these are much more affordable.

RBOB Gasoline Futures Daily Price Chart
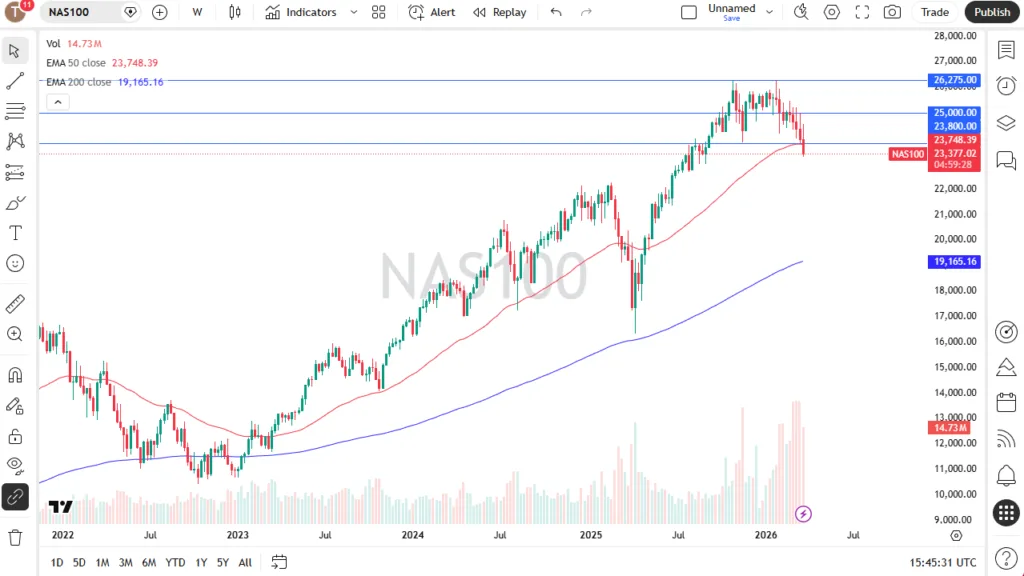
S&P 500 Index
Last week was poor again for the US stock market, with the S&P 500 Index falling heavily, especially on the final two days of the week, to reach a new 7-month low, with the daily chart closing quite far below both the SMA 200 and the EMA 200. These are bearish signs, with the market now almost 10% below its recent all-time high which it reached just a few weeks ago – that would be formal correction territory.
By some metrics – notably the 200-day moving averages and the fact we are at a 7-month low, not to mention the recent strong bearish momentum – you could call this a bear market.
The ongoing war in the Middle East has spooked an already nervous and overbought stock market, especially in the USA, probably hastening (but not causing) its fall.
This is not an environment to buy stocks or the market index. If you want to buy a dip, you should really wait for a sign that the dip has ended, and the price is heading up again.
I am bearish and I can see the price reaching 6,250 or even lower over the next week. However, it is extremely hard to exploit bearish markets on the short side. It is best just to get out and stay on the sidelines until things stabilize.

S&P 500 Index Daily Price Chart
US 10 Year Treasury Yield Futures
Treasury Yield instruments have tended to trend very reliably and can be an excellent instrument to bring profit to trend followers. There is a micro future available here sized at only about $4,000 so it can be affordable.
We have seen US Treasury Yield rise with quite strong momentum over the past month, enough to completely reverse the technical picture from long-term bearish breakdown to long-term bullish breakout, with the price here making a new 18-month plus high. Although there is a fairly large upper wick on Friday’s daily candle, I still feel trend trading US yields is an excellent thing to be involved in. Also, it is hard to see what might change this picture of rising US yields, it really takes a change in some macro input or sentiment, which is why these can be so great for trend followers.
I will be entering a long trade here on Monday with a normal position size.
If a $4,000 future is too much for you, some brokers might offer it as a CFD, but then you must watch the overnight rates closely and make sure it is still worth it.

US 10 Year Treasury Yield Futures
Bottom Line
I see the best trades this week as:
-
Long of the USD/JPY currency pair.
-
Long of the 10Y US Treasury Yield Future.
Ready to trade our weekly Forex forecast? Check out our list of the top 10 Forex trading platforms.