Weekly Forex Forecast – 08th to 13th February 2026 (Charts)

I wrote on the 1st February that the best trades for the week would be:

  1. Long of the EUR/USD currency pair following a daily close above $1.2039. This did not set up.

A summary of last week’s most important data in the market:

  1. Preliminary UoM Inflation Expectations – fell from 4.0% to 3.5%.
  2. European Central Bank Main Refinancing Rate & Monetary Policy Statement – rates left on hold as expected.
  3. Bank of England Official Bank Rate, Votes, Monetary Policy Summary & Report – rates left on hold as expected, but there were a couple more abstentions on the vote than were expected, which was a minor dovish tilt, boosting chances of a rate cut in the near term.
  4. RBA Cash Rate, Rate Statement, and Monetary Policy Statement – the RBA hiked its interest rate by 0.25% as was expected, albeit with 73% probability, so the Australian Dollar rose following this news.
  5. US JOLTS Job Openings – this was a little worse than expected, which was slightly negative news on the US economy.
  6. Preliminary UoM Consumer Sentiment – stronger than expected, which was positive news on the US economy.
  7. US ISM Services PMI – approximately as expected.
  8. US ISM Manufacturing PMI– considerably stronger than expected, which was positive news on the US economy.
  9. New Zealand Unemployment Rate – unexpectedly ticked higher to 5.4%.
  10. Canada Unemployment Rate – unexpectedly fell from 6.8% to 6.5%.
  11. US Unemployment Claims – slightly higher than expected.

The only two elements here which really affected the markets last week was the continued bullish performance of the US economy, which keeps rate cut expectations low, and the RBA’s rate hike which kept the Australian Dollar performing as the strongest major currency.

The other two relevant issues are

  1. The continuing US military build up against Iran, although the USA and Iran began talks last Friday, with President Trump publicly saying they are going well. Prediction markets currently see a US attack on Iran before July as unlikely.
  2. An election to the more powerful Lower House of the Japanese Parliament is being held today (Sunday), and opinion polls suggest the new LDP administration will probably win a landslide. This may weaken the Japanese Yen further as the administration truly requires a weaker Yen, or it could be a case of “sell the fact”, which would present a Yen rebound recovery when results start to emerge.

The coming week’s most important data points, in order of likely importance, are:

  1. US CPI (inflation)
  2. US Average Hourly Earnings
  3. US Retail Sales
  4. US Non-Farm Employment Change
  5. Swiss CPI (inflation)
  6. UK GDP
  7. US Unemployment Rate
  8. US Unemployment Claims

Wednesday will be a public holiday in Japan.

Currency Price Changes and Interest Rates 08/02/2026

Currency Price Changes and Interest Rates

For the month of February, I forecasted that the EUR/USD currency pair would rise in value.

February 2026 Monthly Forecast Performance to Date 08/02/2026

February 2026 Monthly Forecast Performance to Date

Last week saw one cross with excessive volatility, so I made the following weekly forecast:

The Australian Dollar was the strongest major currency last week, while the Japanese Yen was the weakest. Directional volatility rose significantly last week, with one third of all major pairs and crosses changing in value by more than 1%.

Next week’s volatility is likely to be similar.

You can trade these forecasts in a real or demo Forex brokerage account.

Key Support and Resistance Levels 08/02/2026

Key Support and Resistance Levels

Last week, the US Dollar Index printed a bullish candlestick which closed higher but with a significant upper wick, signifying some indecision. This is weakly bullish by itself, but we also have a long-term bearish trend with the price below its levels of both 13 and 26 weeks ago. This gives us a conflicted technical picture about the US Dollar.

So, I see the outlook now as uncertain and the best market opportunities will probably not be US Dollar-dependent.

US Dollar Index Weekly Price Chart 08/02/2026

US Dollar Index Weekly Price Chart

The AUD/JPY currency cross made a very strong upwards move, with the weekly close almost right at the high of the range, with unusually high volatility. The price made a bullish breakout to a new 30+ year high.

These are very bullish signs, as are the facts that the Australian Dollar was the strongest major currency last week, backed by an RBA rate hike, while the Japanese Yen continues to depreciate against most currencies as part of its long-term bearish trend, driven by the massive level of Japanese debt.

While this may look like the perfect bullish storm, an excessive weekly move like this is often followed by a retracement for at least a few days, so a drop in price over the next week would not surprise me.

This pair is likely to see the most action in the Forex market next week, at least until the US CPI data is released, so it might be interesting for swing traders on the long side or day traders on the short side.

AUD/JPY Weekly Price Chart 08/02/2026

AUD/JPY Weekly Price Chart

The major US equity indices like the S&P 500 Index and the tech-focused NASDAQ 100 Index are looking very choppy as they struggle to make new highs, showing swings with high volatility. This suggests an unstable market which, although bullish, may be about to reverse.

Yet, the old fashioned, old economy Dow Jones Industrial Average had a very strong week, closing right on its high at a new record, and breaking the big round number at 50,000 too. These are bullish signs, suggesting that it is the big tech firms which dominate the major indices which are causing poor price action. Away from the big tech giants, we see the basic sectors of the old economy doing well enough to make new record highs.

I am not strongly confident of this trade, but I think a long trade here with a trailing stop loss, due to the US economy’s historically strong track record, is worth taking. You might want to use a smaller than usual position size, like 50% for example.

Dow Jones Industrial Average Weekly Price Chart 08/02/2026

Dow Jones Industrial Average Weekly Price Chart

BTC/USD has continued to make significant bearish breakdowns below a few long-term support levels from just above $81,000 and has recently reached a new 16-month low. This is technically very significant in a bearish way.

While stocks and precious metals were rising strongly over recent months, Bitcoin fell from a record high a few months ago and continued to decline. It is clear the crypto sector is in decline, and that Bitcoin is in serious trouble. Bitcoin was meant to change the world, but outside of Africa, is just has not – you still can’t use it and it is unclear what value it really holds.

I do not like shorting assets, and Bitcoin now seems to be staging a recovery, with a significantly long lower wick now showing on the current weekly candlestick.

I think the price to watch is the support level at about $68,500. If the price action settles above this support, the fall will likely at least pause for a while. If the price action settles below this level, we will likely see a further drop towards the $50,000 area soon.

Bitcoin Weekly Price Chart 08/02/2026

Bitcoin Weekly Price Chart

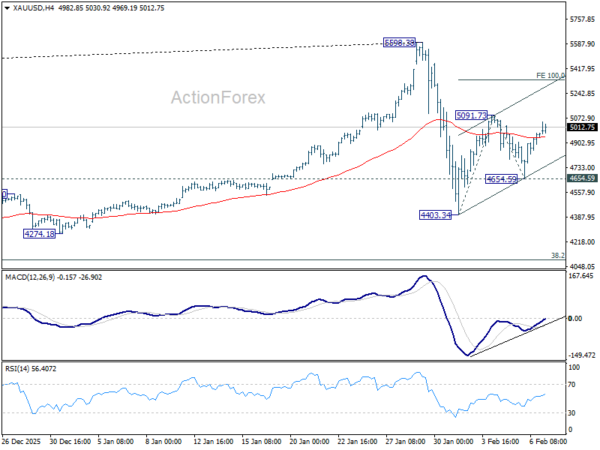
Gold, like Silver, saw a massive drop in just a day or two at the end of January. The drop is Silver was stronger, but Gold fell quickly from a record high at about $5,600 to a low at $4,400 by the end of the week, which is shown within the daily price chart below.

Applying a Fibonacci retracement study, we can see that the halfway level of this movement is very confluent with a major round number at $5,000 and this has held firmly as resistance.

The price action suggests we are going to get a consolidation now on gradually declining volatility, like a struck tuning fork playing itself out.

I think short trades from rejections of the $5,000 level as this plays out, provided they are handled skillfully as short-term trades on lower timeframes, is probably going to be the best strategy for trading Gold over the coming week.

If the price gets established above $5,000 that will be a contradictory bullish sign.

Gold Daily Price Chart 08/02/2026

Gold Daily Price Chart

I see the best trades this week as:

  1. Long of the Dow Jones Industrial Average.

Ready to trade our Forex weekly forecast? Check out our list of the best Forex brokers.

Source link

Visited 5 times, 5 visit(s) today

Related Article

EUR/USD Breaks Higher As USD/JPY Loses Bullish Grip

EUR/USD Breaks Higher As USD/JPY Loses Bullish Grip

EUR/USD started a decent upward move above 1.1880. USD/JPY declined below 155.00 and is currently consolidating losses. Important Takeaways for EUR/USD and USD/JPY Analysis Today The Euro found support and started a recovery wave above the 1.1850 resistance zone. There is a connecting bullish trend line forming with support at 1.1890 on the hourly chart

image

USD/BRL Analysis 11/02: Lower Depths Emerge (Chart)

Created on February 11, 2026 The USD/BRL has once again entered its lowest depths. Yesterday’s finish around the 5.1985 ratio may have been above the lowest ratios seen on Monday and Tuesday, but the USD/BRL remains well within sight of the 5.1750 mark. Today’s opening will prove interesting to gauge existing behavioral sentiment, particularly as

Youtube preview

Smart money levels, liquidity and trade ideas

This is a weekly trading outlook for forex, gold, and indices, focused on institutional price action, liquidity, and smart money positioning. In this video, I break down US30, NAS100, GBPUSD, EURUSD, GBPJPY, USDJPY, XAUUSD (gold), and XAGUSD (silver) using pure price action, identifying key supply and demand zones, liquidity pools, and high-probability trade ideas for

XAGUSD: The Case for Buying into a $250 Silver Price Target

XAGUSD: The Case for Buying into a $250 Silver Price Target

Silver has historically been viewed as both a monetary metal and an industrial commodity. In recent years, structural changes in global debt, currency debasement, and industrial demand have led some analysts to project an extreme upside scenario for silver, with long-term targets as high as $250 per ounce. This article examines the macroeconomic, supply-demand, and

SGX FX and CME Group’s Spot FX venues to integrate

SGX FX and CME Group’s Spot FX venues to integrate

SGX FX is set to combine its global liquidity and buy-side client base with CME Group’s EBS Market and FX Spot+ platform – which launched in April 2025.  Jean-Philippe Male The move is aimed at meeting the growing demand for increasingly connected and interoperable execution. Speaking to The TRADE, Vinay Trivedi, chief operating officer, SGX FX, explained: “By partnering with CME FX

image

a New Near-Term Trading High (chart)

Created on February 10, 2026 The Nasdaq 100 has taken on a rather stormy pattern the past couple of weeks. As of this morning the Nasdaq 100 via its futures trading is near the 25,280.00 ratio, this after touching the 24,200.00 threshold last Thursday when frantic selling was taking place. And just to remind readers,

Exclusive: PU Prime adds UAE CMA Category Five license

Exclusive: PU Prime adds UAE CMA Category Five license

FNG Exclusive… FNG has learned that Retail FX and CFDs broker PU Prime has secured a Category Five license from UAE financial regulator Capital Market Authority (CMA, formerly known as the SCA), as the company looks to continue expanding in the MENA region. Ali Afzaal The license, granted to PU Prime Financial Services LLC, allows

CAGE FX Consulting Ltd Opens in Cyprus, Expanding Access to Forex Education, Analysis, and Signal-Based Market Insights

CAGE FX Consulting Ltd Opens in Cyprus, Expanding Access to Forex Education, Analysis, and Signal-Based Market Insights

CAGE FX Consulting Ltd Opens in Cyprus, Expanding Access to Forex Education, Analysis, and Signal-Based Market Insights CAGE FX Consulting Ltd announced the official opening of CAGE FX in Cyprus, marking a significant step in supporting the country’s rapidly growing foreign exchange (FX) trading ecosystem. With its headquarters in Nicosia, CAGE FX enters a market

USD/CAD Daily Outlook - ActionForex

USD/CAD Daily Outlook – ActionForex

Daily Pivots: (S1) 1.3624; (P) 1.3675; (R1) 1.3725; More… Intraday bias in USD/CAD stays neutral at this point. In case of another rise, upside should be limited by 55 D EMA (now at 1.3781) to complete the corrective bounce from 1.3480. On the downside, break of 1.3625 will bring retest of 1.3480. Firm break there

AUD/USD Daily Report - ActionForex

AUD/USD Daily Report – ActionForex

Daily Pivots: (S1) 0.6933; (P) 0.6979; (R1) 0.7061; More… Intraday bias in AUD/USD remains neutral at this point, and consolidations could continue below 0.7093. In case of another fall, downside should be contained by 38.2% retracement of 0.6420 to 0.7093 at 0.6836. On the upside, break of 0.7093 will extend larger up trend to 100%

The TradeTech FX US Daily launches in Miami as your official guide to the event!

The TradeTech FX US Daily launches in Miami as your official guide to the event!

The TRADE is excited to present the digital edition of The TradeTech FX US Daily 2026, the official magazine to accompany TradeTech FX US, offering you 32 pages of news and tailored content to guide you through the event.  This year’s TradeTech FX US Daily unpacks the hottest, most timely topics shaping the FX markets including a deep dive into the state of play of the European shift to T+1

COMEX Default Looms: Silver Could Skyrocket Past $200/Oz

COMEX Default Looms: Silver Could Skyrocket Past $200/Oz

Written by: Olumide Adesina • Sunday, February 8, 2026 • 1 min read • Last updated: Monday, February 9, 2026 Add an article to your Reading List Register now to be able to add articles to your reading list. ” aria-hidden=”true”> Quick overview Price action indicates a potential silver rally reminiscent of the 1979-1980 event

Gold eyes 5,300 after surviving shakeout, but longer-term reset will take more time

Gold eyes 5,300 after surviving shakeout, but longer-term reset will take more time

After two volatile weeks, Gold appears to have regained its footing. Prices have stabilized around the 4,400 area and have since pushed back above 5,000, signalling that the first wave of profit taking has likely run its course. The sharp pullback from the record high was forceful, but the subsequent price action suggests sellers have

EUR/USD Weekly Forecast 08/02: Uncertainty Grip? (Chart)

EUR/USD Weekly Forecast 08/02: Uncertainty Grip? (Chart)

Created on February 08, 2026 Threats of volatility still are shadowing the broad Forex market. The EUR/USD exhibited its high for last week on Monday when the 1.18750 area was challenged, but headwinds quickly erupted and incremental selling started to stiffen. The EUR/USD has correlated to the broad Forex market with jolts of volatility, but

Image1

Forex 24/5 Trading: Market Hours, Key Sessions, and Best Strategies

What is forex 24/5 trading? Forex 24/5 trading refers to the continuous availability of the decentralised, over-the-counter (OTC) currency market from 22:00 UTC on Sunday to 22:00 UTC on Friday. This forex 24 hour trading model is enabled by the sequential opening of major financial centres – Sydney, Tokyo, London, and New York – across

LINK FOREX Accelerates Global Expansion in 2026, Reshaping

LINK FOREX Accelerates Global Expansion in 2026, Reshaping

London, United Kingdom, Feb. 07, 2026 (GLOBE NEWSWIRE) — Entering 2026, LINK FOREX announced a new phase in its globalization strategy. The company is moving from “covering multiple markets” to “deeply localized services,” simultaneously advancing trading channels, strategy execution, and regional support systems to improve the efficiency and feasibility of retail investors participating in global

Link-Forex

Cross-Market Strategy System Enters “Institutional-Grade Execution” Phase

Link-Forex London, United Kingdom, Feb. 07, 2026 (GLOBE NEWSWIRE) — LINK FOREX recently disclosed that its research team, led by David Whitcombe, the core head of the company’s US equity research system, has completed a new round of strategy system upgrades and is officially advancing LINK FOREX’s comprehensive iteration in three areas: “cross-market data model

GBP/USD Declines After Bank of England Decision

GBP/USD Declines After Bank of England Decision

Yesterday’s decision by the Bank of England came as a surprise to forex traders. While the Official Bank Rate was left unchanged at 3.75%, markets were caught off guard by the notably dovish signals regarding future policy. According to media reports, four out of nine Monetary Policy Committee members voted for an immediate rate cut.

Broadridge buys futures trading platform CQG

Broadridge buys futures trading platform CQG

Leading fintech solutions provider Broadridge Financial Solutions Inc (NYSE:BR) has announced that it has entered into an agreement to acquire CQG, a leading provider of futures and options trading, execution management, and market connectivity. CQG will add complementary execution management, algorithmic trading, and analytics capabilities to Broadridge’s order management and client connectivity solutions, creating an

0
Would love your thoughts, please comment.x
()
x