War Begins, Wall Street Unfazed (for Now!) – Dow Jones and US Stocks Outlook

  • US Stock Benchmarks gapped lower at the open but have bounced higher significantly since.
  • Investor sentiment remains elevated despite the new beginning of a rough conflict in the Middle East.
  • Exploring Technical Levels for the Dow Jones, Nasdaq and S&P 500.

Stock Markets have eased significantly during the Asian and European sessions, but it seems that US Markets are remaining unfazed.

Gapping lower by 1.50% across all benchmarks, Stocks are now rallying back, now close to unchanged, and essentially filling the gaps.

J.P. Morgan issued a buy-the-dips recommendation, which undoubtedly helped risk sentiment ease, but US stocks remain at key inflection points.

What is surprising is also seeing US Treasuries sell off (10Y Yield back above 4.00%) despite ongoing intense exchanges in the Middle East – Bitcoin and Cryptocurrencies are also exploding higher as we speak.

Markets were trading at the lows of their ranges, which could also have helped the rebound.

I invite you to check out Morning reactions and a detailed resume of the events right here.

Keep a close eye on sentiment throughout the week, as economic damage from the war is still far from reflected. The Strait of Hormuz and a potential closure there could be hurting sentiment more consistently throughout the week.

Let’s explore the key levels for weekly action by diving into today’s session charts and key trading levels for the major US indices: the Dow Jones, Nasdaq, and S&P 500.

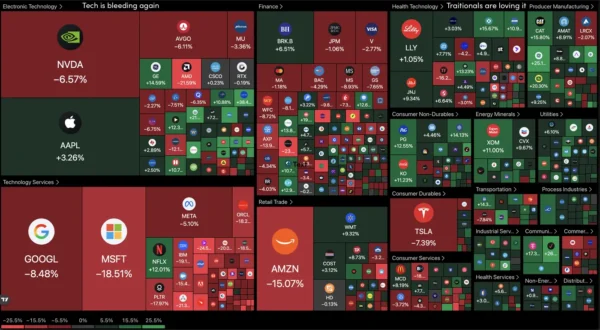
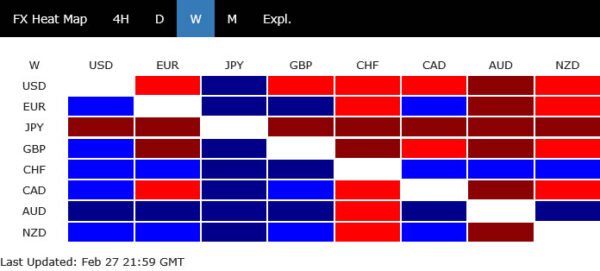
Current Session’s Stock Heatmap

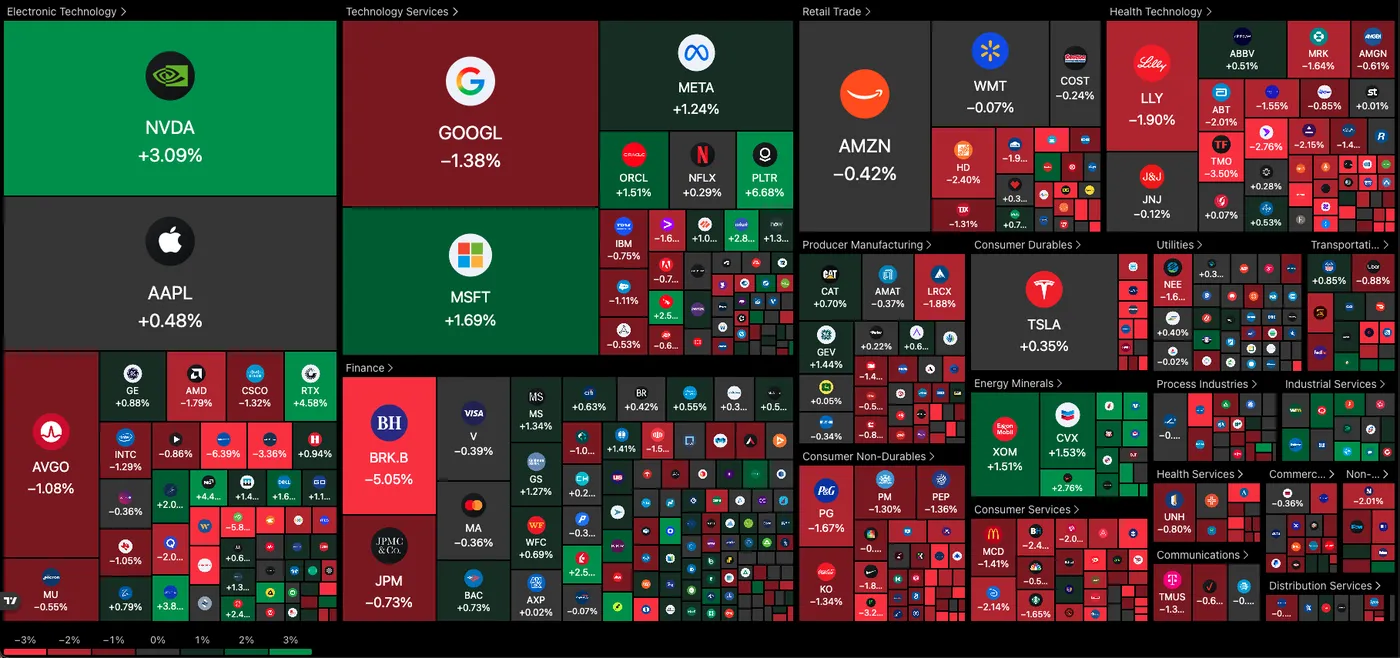
Current picture for the Stock Market (11:56 A.M. ET) – Source: TradingView – March 2, 2026

Despite the rebound around US Benchmarks, individual equities are sending a mixed picture.

Nvidia, Microsoft, Meta and Energy stocks are dominating the action.

Dow Jones 1H Chart and Trading Levels

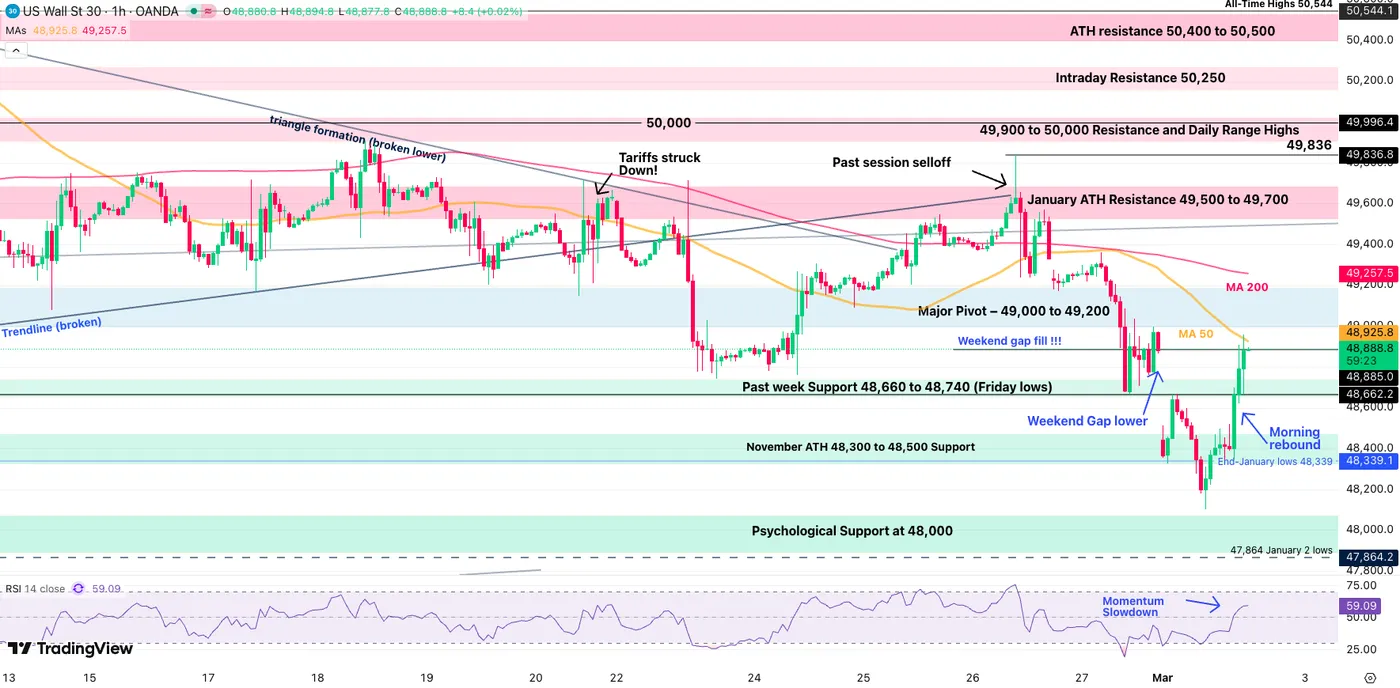
Dow Jones (CFD) 1H Chart – March 2, 2026 – Source: TradingView

Dow Jones rebounded significantly from its 48,103 overnight futures lows, and is now facing a significant test at its Gap-fill level and 50-Hour MA (48,925 – Morning Highs).

  • Closing above on the session would imply a buy-the-dip flows over War flows – Odds for this could be compromised if news worsen.
  • Rejecting the 50-Hour MA (immediate test) could lead to further downside in US Indexes – Doing so could see a test of the overnight lows.

Dow Jones technical levels for trading:

Resistance Levels

  • Key 1H MA 48,925 – Current rejection & Morning highs
  • 200-Hour MA 49,270
  • January ATH Resistance 49,500 to 49,700
  • 49,900 to 50,000 Resistance (Range Highs)
  • Index All-Time highs 50,512

Support Levels

  • Past week Support 48,660 to 48,740 (Friday lows)
  • November ATH 48,300 to 48,500 Minor Support
  • Overnight futures lows 48,103
  • Key Support from 47,500 to 48,000 (Next main Support)
  • 45,000 psychological level (Main Support on higher timeframe)

Nasdaq 1H Chart and Trading Levels

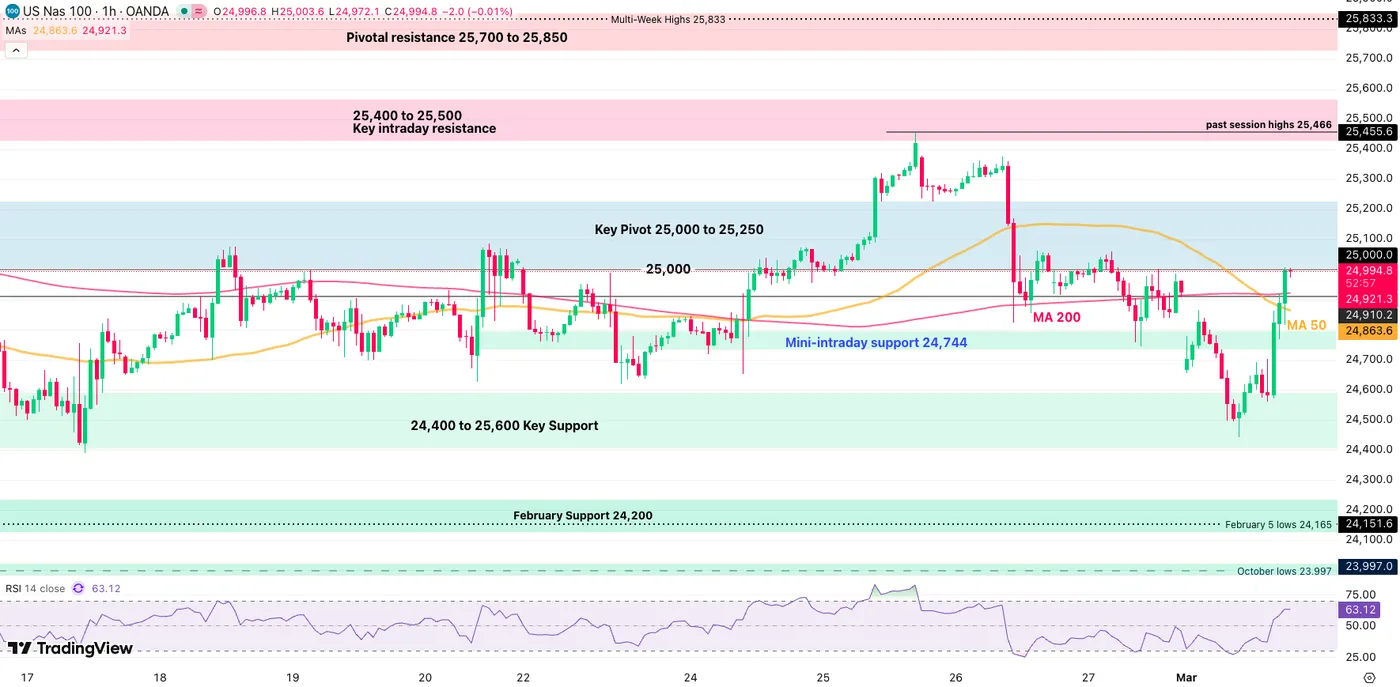
Nasdaq (CFD) 1H Chart – March 2, 2026 – Source: TradingView

Nasdaq breached back above its 50-Hour MA but is less responsive than the DJIA to the indicator.

The level to watch is being tested as we speak: 25,000.

  • Closing above on the session would see further dip-buying, like in the DJIA.
  • Rejecting here however could see a quick test of the 24,441 overnight lows.

Nasdaq technical levels of interest:

Resistance Levels

  • Key Pivot 25,000 to 25,250 (Immediate rejection!)
  • 25,400 to 25,500 Intraday resistance
  • All-time high resistance zone 26,100 to 26,300

Support Levels

  • Mini-intraday support 24,744 (bearish below)
  • 24,400 to 25,600 Key Support (Range Support)
  • 24,441 Overnight lows
  • February Support 24,150 to 24,200
  • October – November Support 23,800 to 24,000
  • Early 2025 ATH at 22,000 to 22,229 Support

S&P 500 1H Chart and Trading Levels

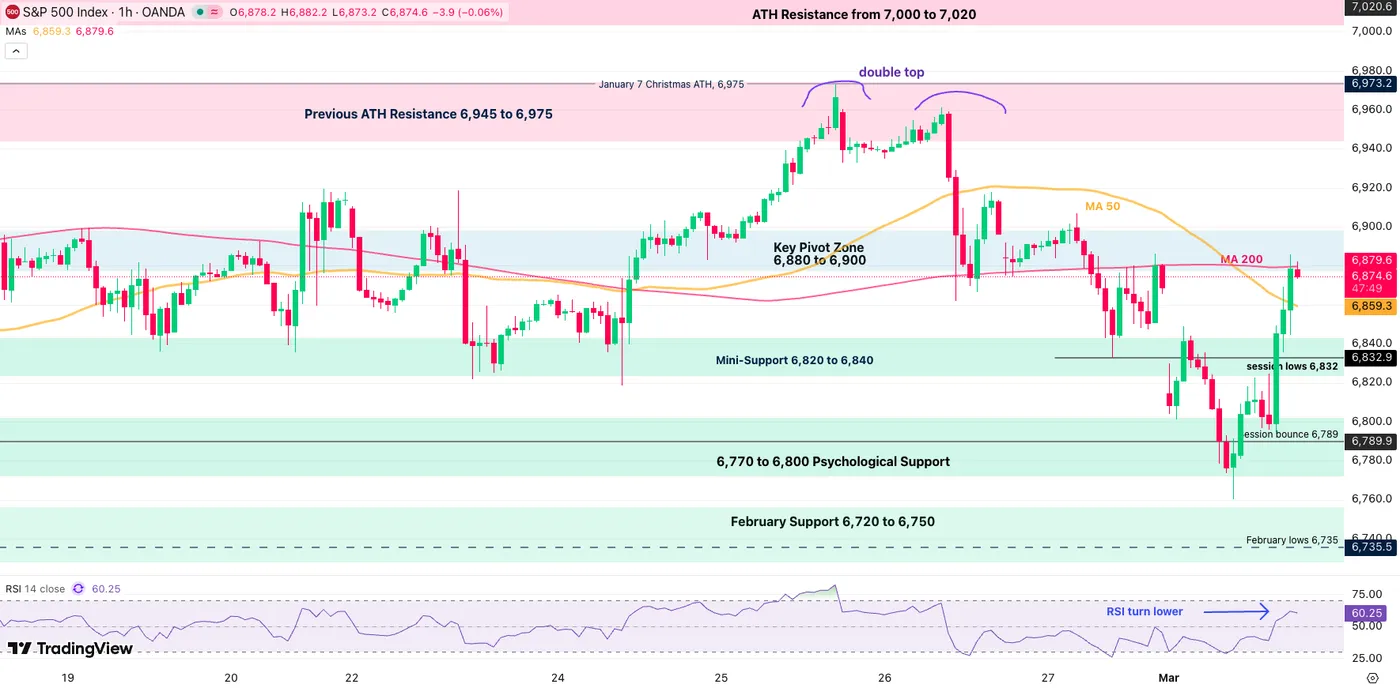
S&P 500 (CFD) 1H Chart – March 2, 2026 – Source: TradingView

The S&P 500 is facing almost similar conditions as the Dow. After running higher in the morning session, bulls will be facing a key test at the 200-Hour MA (6,874).

  • Trading and closing above would point to 7,000.
  • Below would point to a test of the 6,760 overnight lows.

S&P 500 technical levels of interest:

Resistance Levels

  • Morning highs and 200-Hour MA (6,874)
  • Key Pivot Zone 6,880 to 6,900
  • Previous ATH minor Resistance 6,945 to 6,975
  • Current ATH 7,020
  • All-time High Resistance 7,000 to 7,020 (range highs)

Support Levels

  • Mini-Support 6,830 to 6,850
  • 6,800 Psychological Support
  • Overnight lows 6,760
  • February lows 6,730 (Higher timeframe range lows)
  • 6,400 Major psychological support

Safe Trades and keep a close eye on the US-Iran developments!

Source link

Visited 1 times, 1 visit(s) today

Related Article

Institutional FX trading volumes cool 5% in February 2026

Institutional FX trading volumes cool 5% in February 2026

Following a record month of January to start off the year, things cooled somewhat during February 2026 in the institutional FX trading market. Each of FXSpotStream, Cboe FX, EuronextFX and Deutsche Borse’s 360T saw month-over-month trading volume declines of between 1% and 11% during February, as January’s wild currency market volatility gave way to more

A close-up shot of numbers and stock charts by Atlantic Ambience via Pexels

How 24/7 Automated Forex Systems Operate Across Global Markets

A close-up shot of numbers and stock charts by Atlantic Ambience via Pexels This is sponsored content.  Barchart is not endorsing the websites or products set forth below. The forex market is not the most difficult market to understand but it also isn’t the easiest. This might, at first, sound a bit off. How can

Middle East Situation Reshapes Forex Market Landscape

On Monday this week (March 2), influenced by the escalation of the situation in the Middle East, the US dollar opened stronger, with intraday gains expanding at one point. As of now, the increase has narrowed to approximately 0.5%. Compared to the market risk aversion sentiment triggered by the tensions in the Strait of Hormuz,

Retail Trading Enters New Maturity Phase: SpecFX Rebrands

Retail Trading Enters New Maturity Phase: SpecFX Rebrands

Sydney, Australia, March 02, 2026 (GLOBE NEWSWIRE) — The global retail trading industry is entering a more deliberate and regulated phase, marked by stronger oversight, greater operational transparency, and rising expectations from traders. Against this backdrop, SpecFX has officially rebranded as Spec Markets, signaling an expanded offering and a strategic shift toward long-term infrastructure, compliance,

ISM manufacturing beats forecast, prices jump to highest since 2022

ISM manufacturing beats forecast, prices jump to highest since 2022

US ISM Manufacturing PMI edged down from 52.6 in January to 52.4 in February, but the reading remained comfortably above expectations of 51.9 and firmly in expansion territory. The data point to continued resilience in the factory sector, with activity still consistent with moderate economic growth. The most striking development was the sharp surge in

WTI soars above 70 despite OPEC+'s "band aid" production hike

WTI soars above 70 despite OPEC+’s “band aid” production hike

On Sunday, the OPEC+ “V8” coalition took a proactive stance by accelerating production hikes to 206,000 bpd starting in April. This move—surpassing the 137,000 bpd initially anticipated—serves as a strategic pivot to buffer a market shaken by the sudden U.S./Israeli strikes on Iran. While the alliance officially points to “market fundamentals,” the timing is clearly

War premium lifts Silver, violent move possible if 100 gives way

War premium lifts Silver, violent move possible if 100 gives way

Silver edged higher as markets reacted to escalating tensions in Middle East, with US-Israel-Iran conflict driving aggressive safe-haven flows. Prices surged to an intraday high above 96 before easing slightly as traders locked in partial profits. Despite intraday consolidation, underlying bid remains intact as war premium continues to underpin precious metals. For now, further gains

EUR/AUD Daily Outlook - ActionForex

EUR/AUD Daily Outlook – ActionForex

Daily Pivots: (S1) 1.6567; (P) 1.6604; (R1) 1.6647; More… Further decline is expected in EUR/AUD with 1.6830 resistance intact, despite some loss of downside momentum. Current fall should continue to 138.2% projection of 1.8554 to 1.7245 from 1.8160 at 1.6351. However, firm break of 1.6830 resistance will confirm short term bottoming, on bullish convergence condition

Safe-Haven Flows Build But No Panic, Focus Turns to Iranian Succession

Safe-Haven Flows Build But No Panic, Focus Turns to Iranian Succession

Markets opened the week with a clear but measured risk-off tone following dramatic escalation in Middle East tensions over the weekend. While safe-haven flows were evident in Asia, price action so far remains contained rather than disorderly. Investors are reacting, but not capitulating. Equity markets in the region reflected caution rather than panic. Japanese and

Image used for representational purposes only.

Rupee falls 21 paise to 91.29 against U.S. dollar in early trade amid Iran-Israel conflict

Image used for representational purposes only. | Photo Credit: Getty Images/iStockphoto The rupee depreciated 21 paise to 91.29 against the U.S. dollar on Monday (March 2, 2026), amid higher crude oil prices, a strong American currency and intense global volatility due to the escalated West Asia tension. Negative equity market sentiment and massive withdrawal of

EUR/USD Rejected at Resistance, Bears Eye Fresh Decline Ahead

EUR/USD Rejected at Resistance, Bears Eye Fresh Decline Ahead

Key Highlights EUR/USD started another decline and traded below 1.1840. A key bearish trend line is forming with resistance at 1.1800 on the 4-hour chart. GBP/USD extended losses and traded below 1.3460. Crude Oil prices jumped above $74.50 before trimming some gains. EUR/USD Technical Analysis The Euro failed to stay above 1.1900 and declined against

USD/CHF Mid-Day Outlook - ActionForex

USD/CHF Mid-Day Outlook – ActionForex

Daily Pivots: (S1) 0.7716; (P) 0.7735; (R1) 0.7759; More…. USD/CHF falls notably today but remains bounded in established range. Intraday bias remains neutral for now. In case of another rise, upside should be limited by 55 D EMA (now at 0.7824) to complete the pattern. On the downside, below 0.7627 will bring retest of 0.7603.

Price USD/CAD 01/03/2026

Weekly Pairs in Focus 1st to 6th March 2026 (Charts)

By Christopher Lewis Reviewer 24bulls Created on March 01, 2026 The US dollar initially rallied against the Canadian dollar during the week but has since turned around to show signs of hesitation. This is not a huge surprise considering that we have been bouncing around in the same region for 5 weeks now. It is

EUR/AUD Weekly Outlook - ActionForex

EUR/AUD Weekly Outlook – ActionForex

EUR/AUD’s down trend resumed last week but downside momentum has been unconvincing with bullish convergence condition in 4H MACD. Still, there is no clear sign of bottoming yet. Further fall is expected this week to 138.2% projection of 1.8554 to 1.7245 from 1.8160 at 1.6351. However, firm break of 1.6830 resistance will confirm short term

EUR/GBP Weekly Outlook - ActionForex

EUR/GBP Weekly Outlook – ActionForex

EUR/GBP’s solid break of 0.8744 resistance last week suggests that corrective fall from 0.8863 has completed at 0.8611. More importantly, up trend from 0.8221 is not completed. Initial bias stays on the upside this week for retesting 0.8863 first. For now, further rally is expected as long as 0.8705 support holds, in case of retreat.

EUR/JPY Weekly Outlook - ActionForex

EUR/JPY Weekly Outlook – ActionForex

EUR/JPY’s extended rise last suggests that correction from 186.86 has completed with three waves down to 180.78 already. But as a temporary top was formed at 184.75, initial bias remains neutral this week for consolidations first. On the upside, break of 184.75 will target 186.86 high. Firm break there will resume larger up trend to

USD/CAD Weekly Outlook - ActionForex

USD/CAD Weekly Outlook – ActionForex

Despite the late dip in USD/CAD, it’s still holding on to 1.3630 minor support. Initial bias stays neutral this week first. Outlook is unchanged that price actions from 1.3480 are forming a consolidation pattern. Upside should be limited by 55 D EMA (now at 1.3728). On the downside, firm break of 1.3630 will bring retest

0
Would love your thoughts, please comment.x
()
x