Weekly Forex Forecast – USD/JPY, AUD/USD, WTI Crude Oil, S&P 500 Index, Bitcoin, Gold
WTI Crude Oil tested long-term highs as the outbreak of war looms over the Persian Gulf, while the Japanese Yen gave up some of its gains and precious metals continued their recovery.
Fundamental Analysis & Market Sentiment
I wrote on the 15th February that the best trades for the week would be:
-
Long of the S&P 500 Index following a daily (New York) close above 7,025. This did not set up.
-
Long of any JPY currency cross except CHF/JPY. This produced several winning trades:
-
AUD/JPY = +1.73%
-
CAD/JPY = +1.10%
-
CHF/JPY = +0.51%
-
EUR/JPY = +0.83%
-
GBP/JPY = +0.24%
-
The gave a total win of 4.31%, which averages to 0.72% per asset.
A summary of last week’s most important data in the market:
-
US Core PCE Price Index – slightly higher than the expected 0.3% month-on-month increase at 0.4%, suggesting that the Fed will have to remain cautious on the pace of rate cuts, which strengthened the US Dollar.
-
US Advance GDP – this came in much lower than expected at only 1.4%, although the undershoot was largely discounted by analysts as due to the recent government shutdown.
-
US FOMC Meeting Minutes – there were no surprises.
-
UK CPI (inflation) – as expected, the annualized rate fell to 3.0%.
-
Canadian CPI (inflation) – came in just a tick lower than expected, with no month-on-month change in the index.
-
RBNZ Official Cash Rate / Rate Statement / Monetary Policy Statement – the Bank made a dovish rate hold, pushing back expectations for the next rate hike, which weakened the Kiwi.
-
US / German / UK Flash Services & Manufacturing PMI – these were below expectations in the USA but above expectations in Germany and the UK, suggesting that the US economy may be slowing.
-
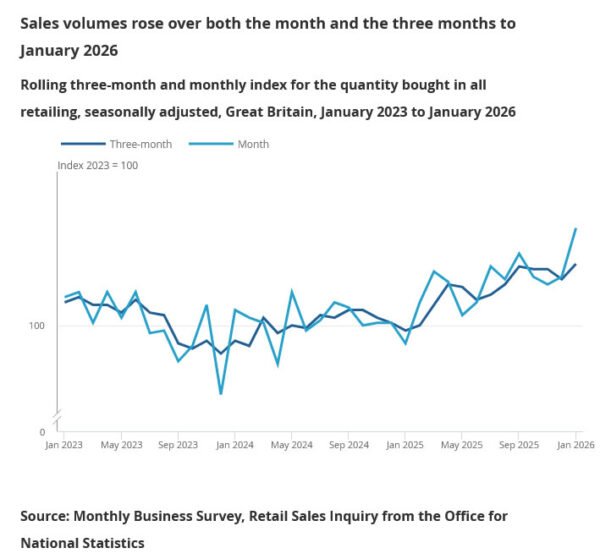
UK Retail Sales – this was considerably stronger than expected, showing a monthly increase of 1.8%, suggesting a more buoyant consumer demand. This helped the British Pound firm a little, but not by much.
-
US Unemployment Claims – this was slightly better than expected.
-
Australian Unemployment Rate – this fell unexpectedly to 4.1%, although the outperformance was very small.
-
UK Claimant Count Change – very slightly worse than expected, but it had no effect.
The only significant effects last week’s economic data had was the stronger USD after the PCE Price Index release which is seen as an inflation indicator by the Fed, and the weaker NZD after the RBNZ’s dovish rate hold. Overall, the CME FedWatch tool has moved firmly in favour of expecting only two rate cuts in 2026 of 0.25% (June and October), which is a hawkish change for the US Dollar.
Prediction markets are indicating an increased possibility of a US attack on Iran after the US administration appears to have been surprised by Iran’s reluctance to offer more substantial concessions on its nuclear weapon program and its refusal to even discuss its ballistic missile program, both of which were attacked by the USA and/or Israel in June 2025. Polymarket is currently indicating a 17% chance of war within one week, a 46% chance of war by mid-March, and a 57% chance of war by the end of March. Comments from US Secretary Witkoff earlier today suggest the US is still indicating it hopes for a deal. In my opinion, war is inevitable within a few weeks, the Islamic Republic of Iran will not decisively mothball its nuclear program under any circumstances, and the comments of Witkoff just show how little even President Trump’s diplomats truly understand the reality of the Iranian regime. Iran’s strongest card is the fact that the American public is far more interested in bread and circuses than it is in dismantling Iran’s nuclear program, let alone in its ballistic missiles or overthrowing the regime, even though a more normal government in Iran would almost certainly bring significant economic benefits to both the Middle East and the USA.
The prospect of imminent war is raising the price of crude oil and may be suppressing US stock markets to some extent. Neither side is likely to attack oil facilities, but if the Iranian regime thinks its survival is seriously threatened, it would probably do so if it could. This could see crude oil prices spike much higher, having already kissed a new 6-month high price last week. President Trump will be extremely reluctant to see oil prices rise further, but he may also feel he will not get a deal without showing he is willing and able to kill very senior Iranian politicians, which creates a risky situation for crude oil.
The Week Ahead: 23rd – 27th February
The coming week’s most important data points, in order of likely importance, are:
-
US PPI
-
US President Trump State of the Union speech
-
Australian CPI (inflation)
-
Canadian GDP
-
US Unemployment Claims
Monday will be a public holiday in Japan and China.
Monthly Forecast February 2025
Currency Price Changes and Interest Rates
For the month of February, I forecasted that the EUR/USD currency pair would rise in value.
Currency Pair |
Forecasted Direction |
Interest Rate Differential |
Performance to Date |
|
EUR/USD |
Long ↑ |
-1.50% (2.15% – 3.75%) |
-0.60% |
February 2026 Monthly Forecast Performance to Date
Weekly Forecast 22nd February 2026
Last week saw no currency crosses with excessive volatility, so I am making no forecast for the coming week.
Last week’s forecast produced several winning trades (see the intro to this item above for details).
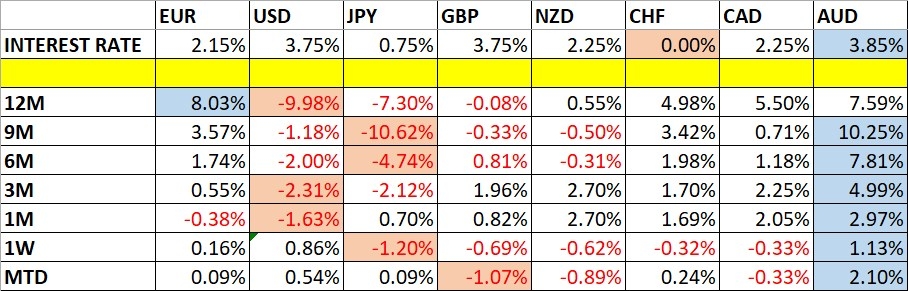
The Australian Dollar was the strongest major currency last week, while the Japanese Yen was the weakest. Directional volatility fell slightly last week, with just one third of all major pairs and crosses changing in value by more than 1%.
Next week’s volatility is likely to be lower unless war breaks out in the Middle East, which might generate volatility in the US Dollar, the Japanese Yen, and the Canadian Dollar.
You can trade these forecasts in a real or demo Forex brokerage account.
Technical Analysis
Key Support/Resistance Levels for Popular Pairs
Currency Pair |
|
|
AUD/USD |
Support: 0.7067, 07004, 0.6991, 0.6947 Resistance: 0.7098, 0.7120, 0.7213, 0.7248 |
|
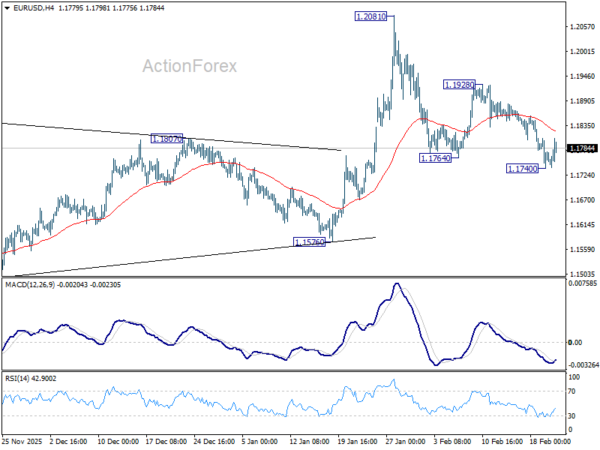
EUR/USD |
Support: 1.1774, 1.1760, 1.1672, 1.1633 Resistance: 1.1805, 1.1828, 1.1856, 1.1887 |
|
GBP/USD |
Support: 1.3432, 1.3402, 1.3332, 1.3307 Resistance: 1.3549, 1.3603, 1.3636, 1.3666 |
|
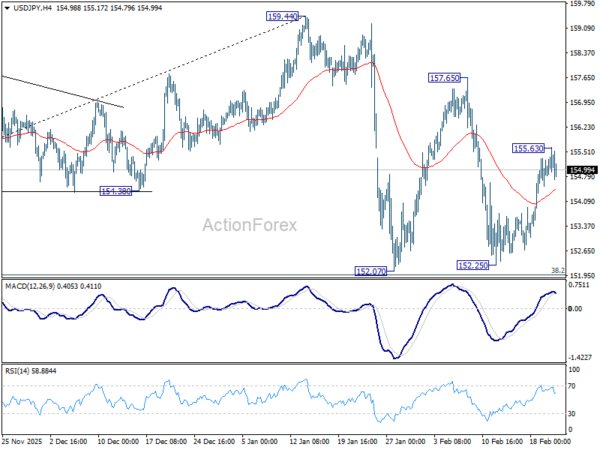
USD/JPY |
Support: 154.44, 153.63, 152.15, 151.61 Resistance: 155.17, 155.60, 156.29, 157.74 |
|
AUD/JPY |
Support: 108.86, 108.62, 108.26, 106.58 Resistance: 110.02, 111.00, 112.00, 113.00 |
|
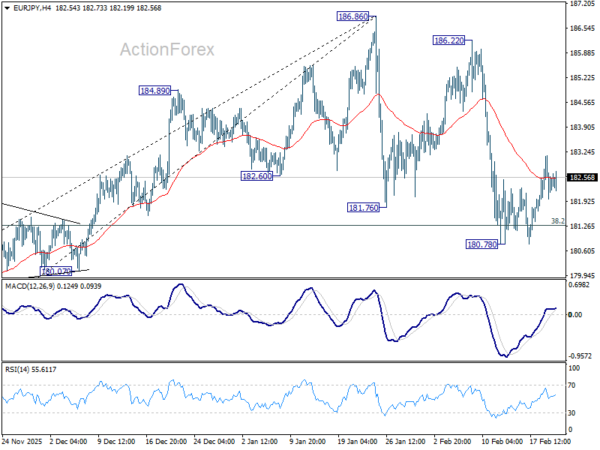
EUR/JPY |
Support: 182.02, 181.72, 181.41, 180.83 Resistance: 183.14, 183.78, 184.85, 185.32 |
|
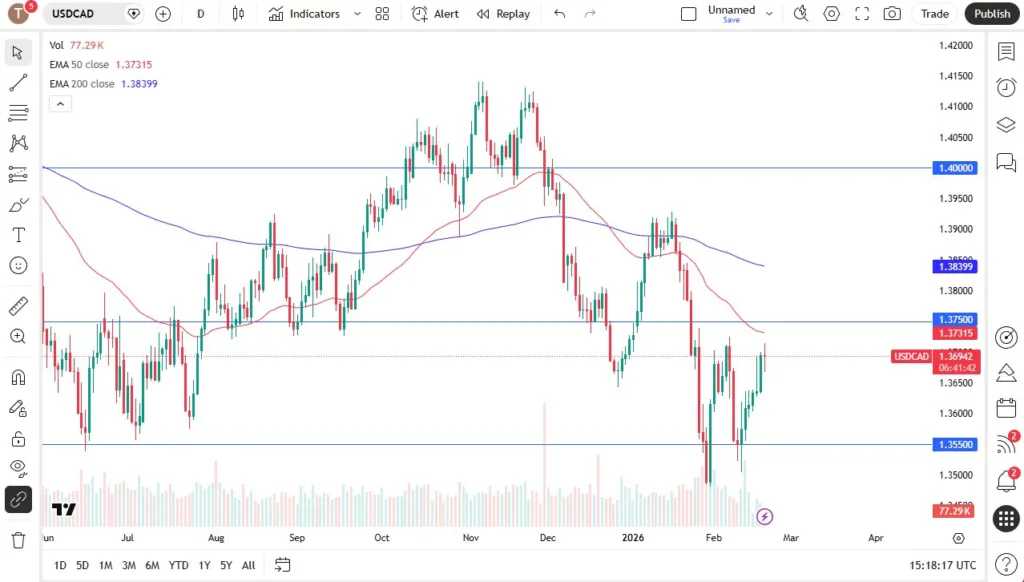
USD/CAD |
Support: 1.3668, 1.3626, 1.3596, 1.3554 Resistance: 1.3724, 1.3748, 1.3797, 1.3815 |
|
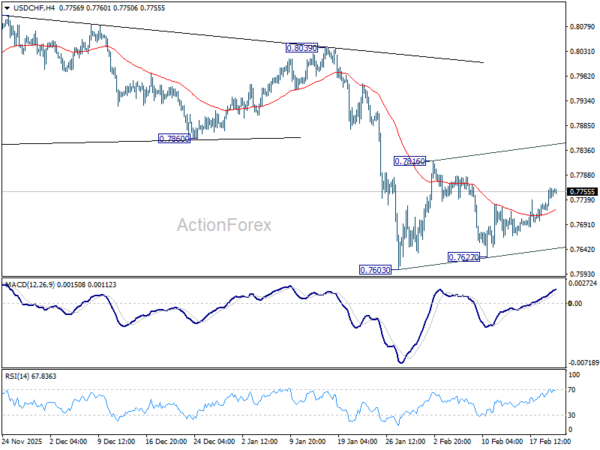
USD/CHF |
Support: 0.7667, 0.7600, 0.7500, 0.7400 Resistance: 0.7730, 0.7741, 0.7793, 0.7869 |
Key Support and Resistance Levels
US Dollar Index
Last week, the US Dollar printed a bullish candlestick which engulfed the real body of the previous candlesticks.
Zooming out, we can see that although the price action of recent months suggests a bearish consolidation pattern, the most recent price action has been bullish over recent weeks. The long-term trend is mixed, with the price below its level of 3 months ago but above its level of 6 months ago.
We certainly saw the interest rate outlook turn more bullish last week on the greenback, with markets now pricing in only two rate cuts of 0.25% over the course of 2026 instead of the three that were expected in the previous week.
All in all, a weakly bullish bias looks sensible, as it is supported by sentiment / fundamental outlook and the most recent price action. However, as it is only weak, there is still a case to be long of especially strong currencies or assets that are priced in greenbacks – just don’t expect any miracles.
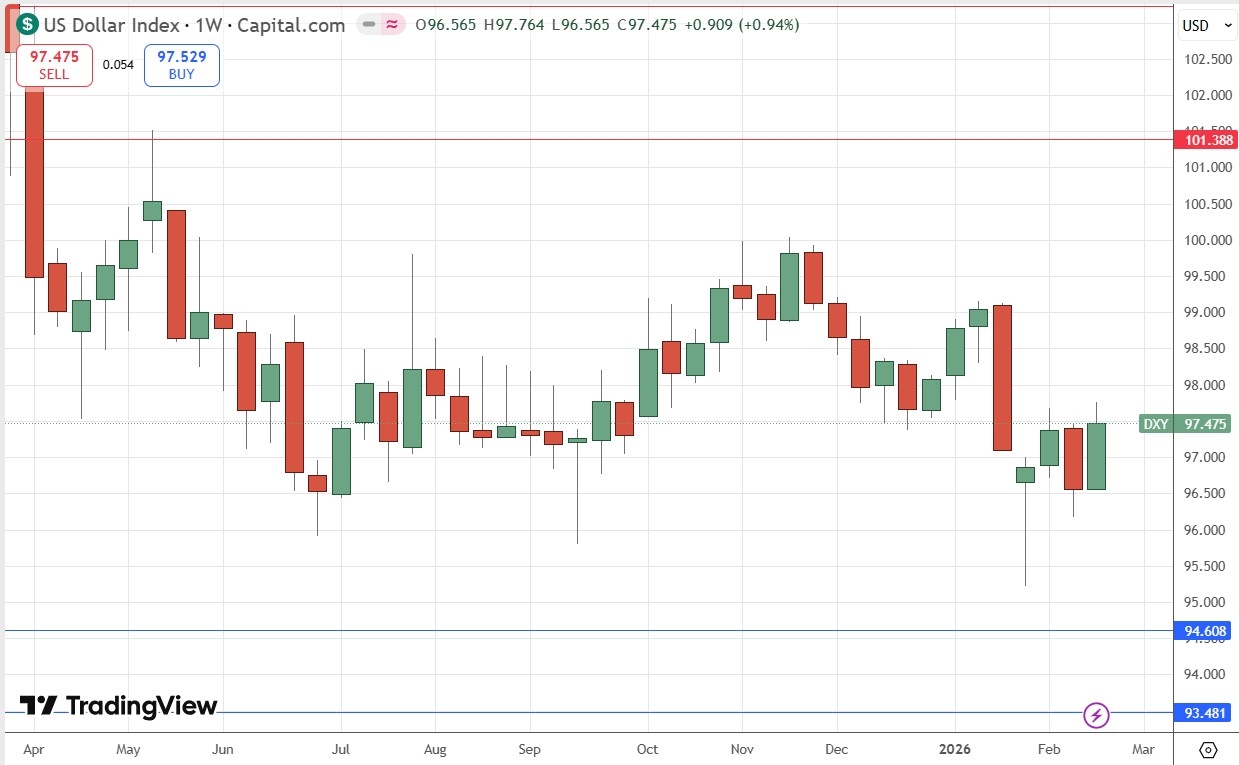
US Dollar Index Weekly Price Chart
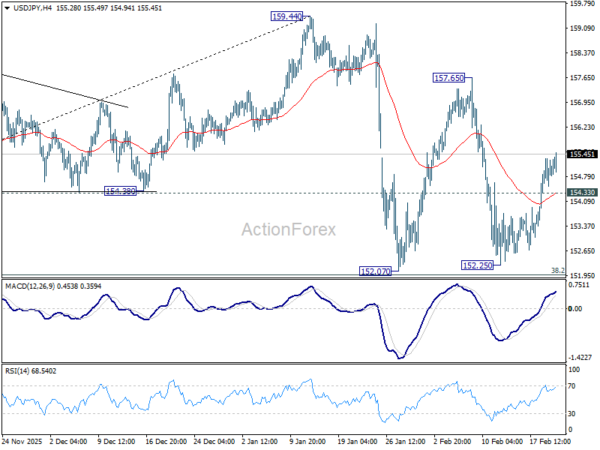
USD/JPY
The USD/JPY currency pair saw a predictable bounce back higher over the past week, after making a huge downwards move the previous week which ended not far from the supportive trend line shown in the price chart below. This behaviour is typical of currencies other than the US Dollar. The Yen fell over the week against every other major currency, and the US Dollar was strengthened as economic data strengthened the case for a more cautious Fed timeline for further rate cuts, with only two cuts now expected over the course of 2026.
Despite the strong bullish move, and the general trend higher, I am far from certain there will be much more upside over the near term, mainly because the prospect of war in the Middle East could cause a market shock which might see the Yen strengthen.
If you do want to be short of the Japanese Yen, it might be wise to do it with a basket of the relatively strong currencies, which might include the Australian as well as the US Dollar.
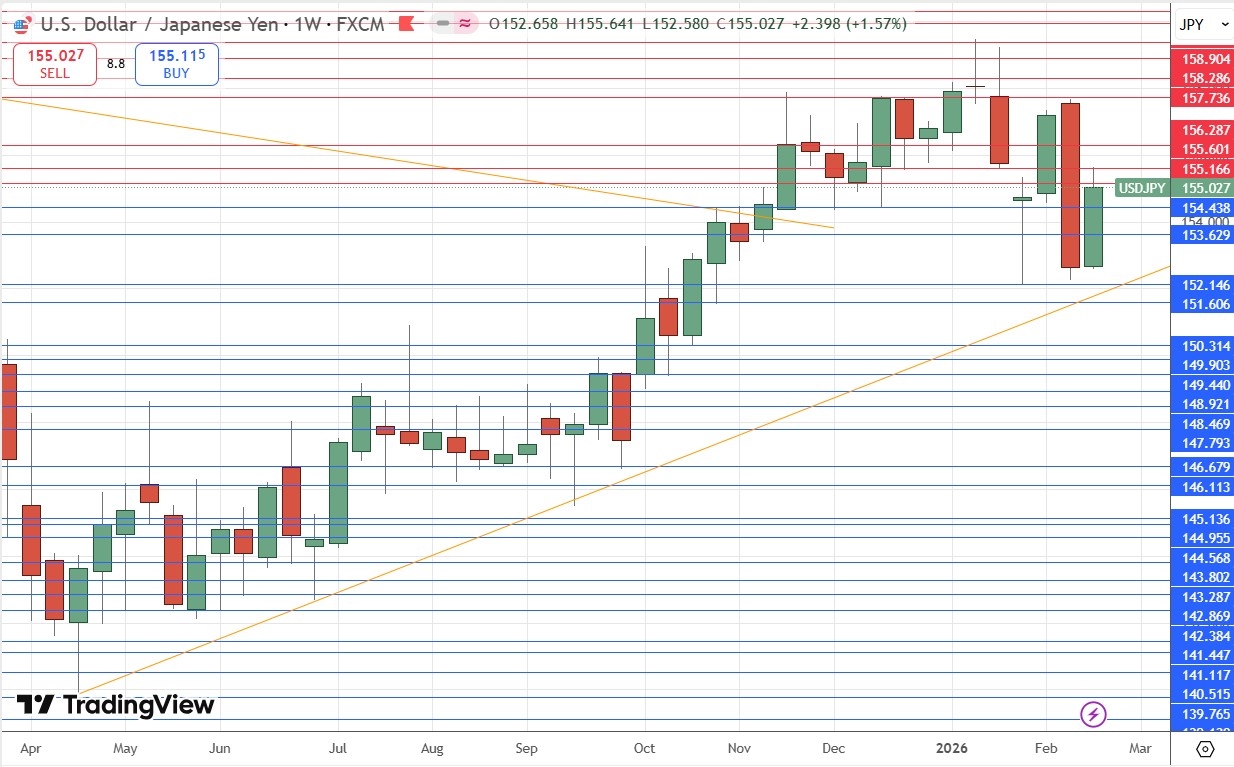
USD/JPY Weekly Price Chart
AUD/USD
The AUD/USD currency pair is very interesting right now, as the Australian Dollar is even stronger than the US Dollar, being one of the few currencies that moved higher against it last week, trading at long-term high prices two weeks ago.
The Australian Dollar is one of three major currencies whose central banks are on a path of rate hikes rather than cuts, and its path is the strongest and most convincing.
I think the Australian Dollar is an excellent long prospect, although it might not gain very much over the near term here. It might be best to trade the Aussie long against a basket of the weaker currencies, like the Euro and the British Pound.
Technically, last week’s candlestick looks bullish as an inside and pin candlestick, so if last week’s high price is broken convincingly, a further rise would look likely. The round number at $0.7100 might be a superior marker.
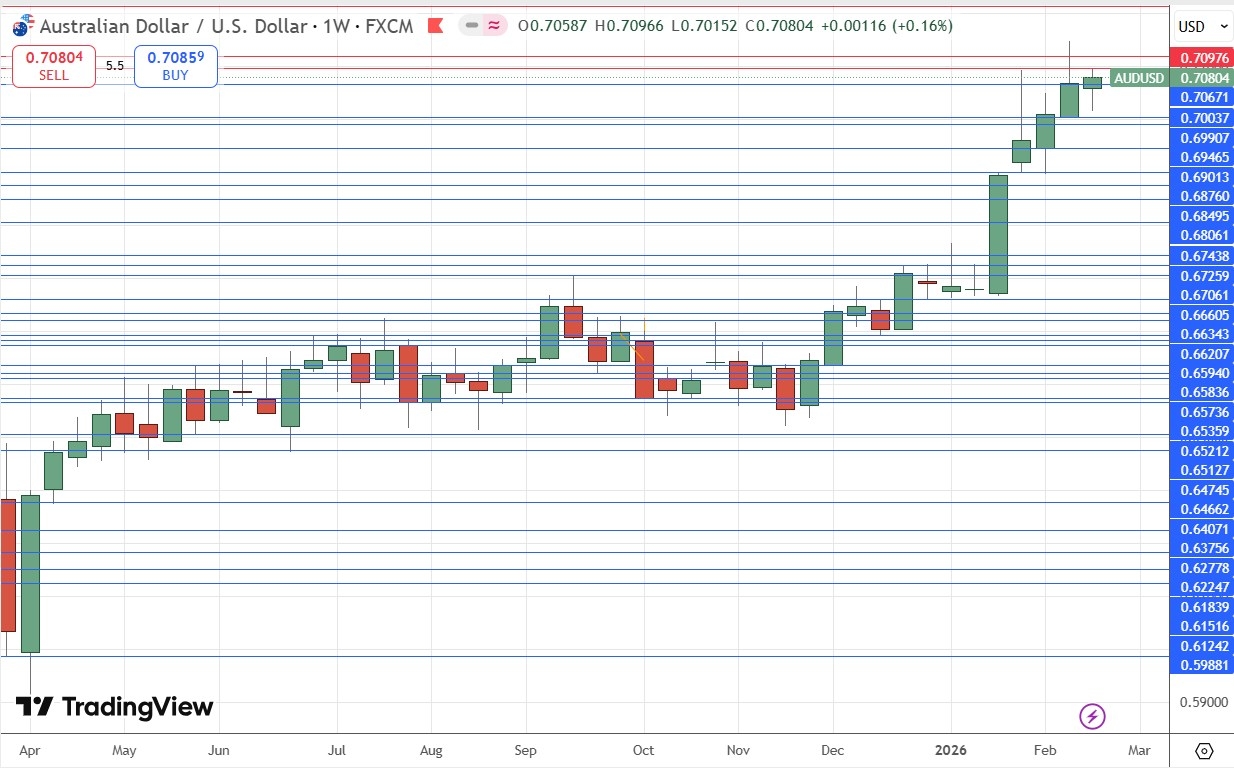
AUD/USD Weekly Price Chart
WTI Crude Oil
WTI Crude Oil rose strongly last week, especially on Thursday when the prospect of an American attack on Iran seemed to grow, giving a rise of almost 5% on the day. The price briefly kissed a new 6-month high before retreating a bit on Friday, but the weekly closing was not very far from the high of the range.
An all-out war between the USA and Iran tends to be seen as a doomsday scenario for crude oil, as about 25% of all petroleum products pass through the strait. Prediction markets see a war as likely to happen by the end of next month, and it seems the USA is prepared sufficiently to attack.
However, both Iran and nearby US allies export oil and the USA has no interest in sending the price of crude oil higher, so there may be a tacit agreement not to attack oil facilities. On the other hand, if the Iranian regime began to crumble it might decide to bring the house down with it. In any case, the outbreak of war will likely see a spike higher, which is likely to be short-lived.
Many trend traders will have gone long of WTI Crude Oil last week but are vulnerable to massive losses if there is a sudden deal averting war, or to a spike higher which quickly dramatically reverses as it becomes clear oil facilities will not be touched. For these reasons, if you must go long here, do it with great caution. Intraday stop losses and closing positions before weekends can help to reduce rise. I personally am long but with only a small position, and I will try to close it out on the first or second day of the war (which I expect to happen) unless the war immediately spins wildly out of control leading to Iranian (possible but unlikely) or Israeli (highly unlikely unless Iran inflicts very serious damage on Israel) attacks on oil facilities.
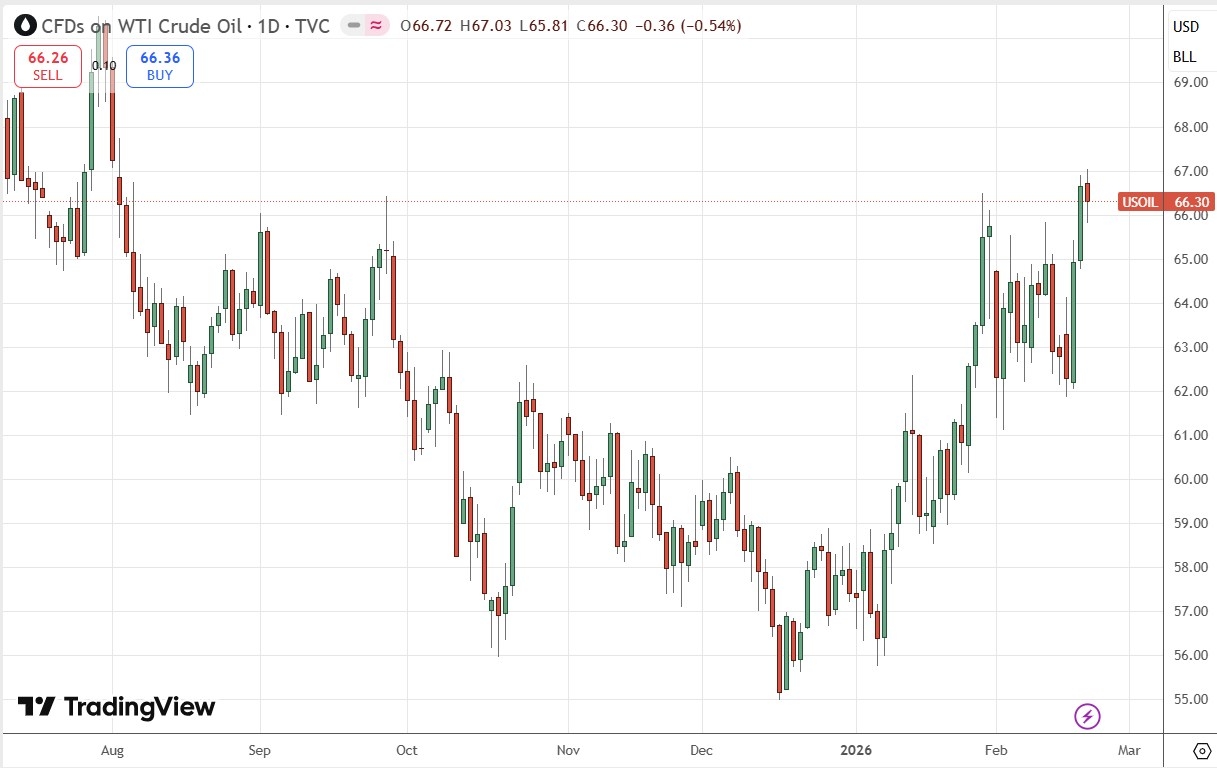
WTI Crude Oil Daily Price Chart
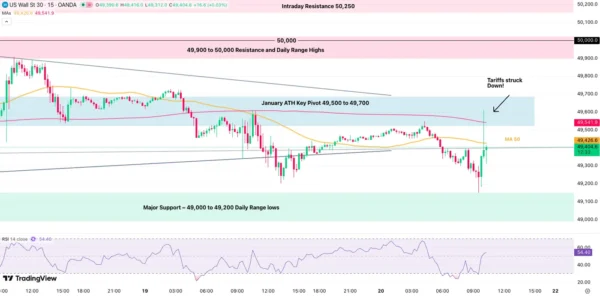
S&P 500 Index
The S&P 500 Index has been in a strong bull market for a long time. However, although we did see a new record high price just three weeks ago, a look at the weekly chart below shows that the price has been consolidating, or topping out, for about the last 10 weeks. The support below at 6737 looks pivotal, and the support below that near 6,500 looks even more so, especially when you consider the 200-day simple moving average is confluent with that major half-number.
It is still technically a bull market, and I would go long if we got a record high daily close above 7,025, but the choppiness and reluctance to make new highs suggests that this might not happen.
If war breaks out between the USA and Iran and it escalates quickly, this could well chill this Index towards the downside.
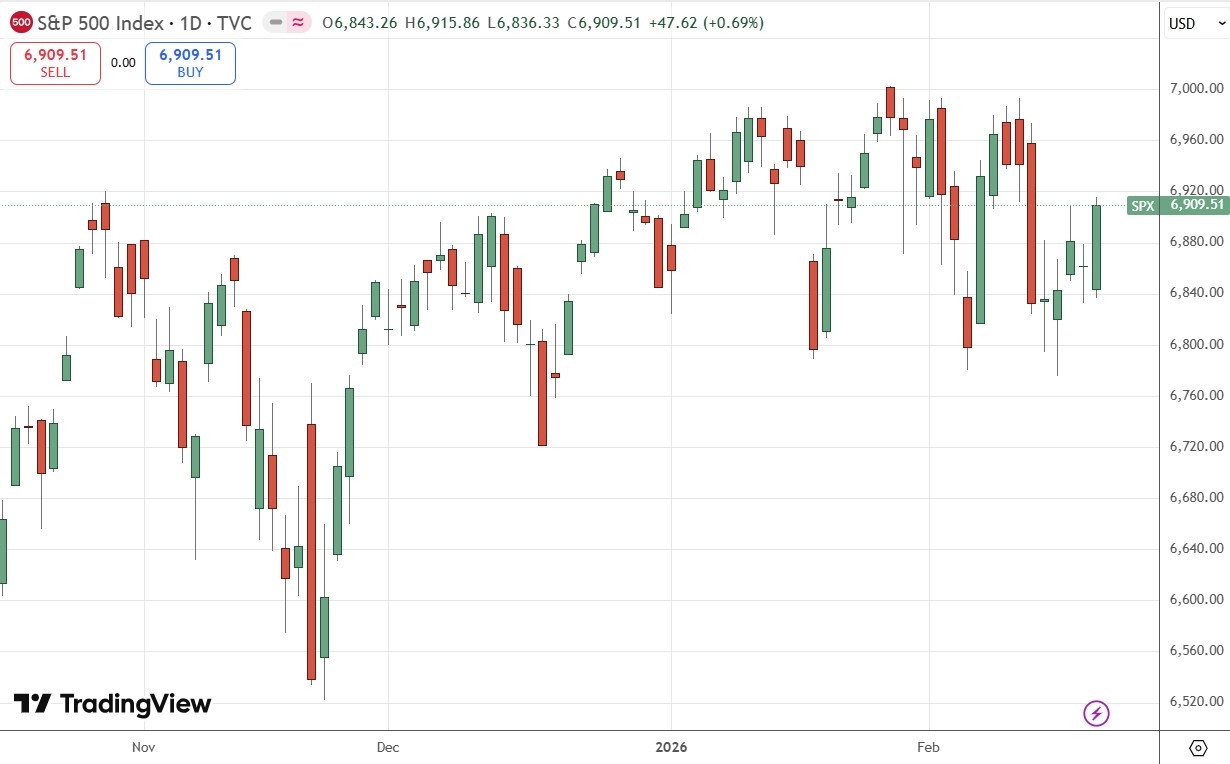
S&P 500 Index Daily Price Chart
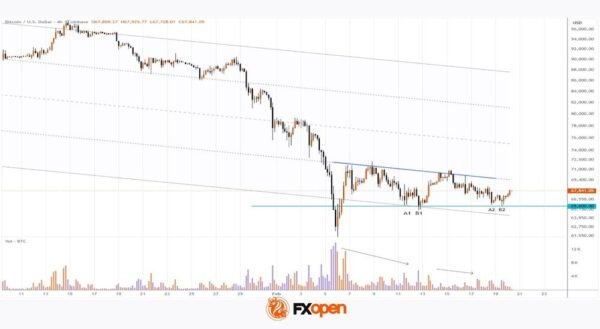
Bitcoin
BTC/USD is starting to show a very textbook range consolidation between $66,773 and $71,762. The rice chart below shows that a break of this range could be very significant technically. Although there has been lots of bearish pressure on Bitcoin, it may be that long-term investors see it as cheap in this range and are buying it. A convincing bullish breakout above $71,762 could trigger a fast rise to $81,203. This feels the more likely scenario.
A bearish breakdown below $66,773 will then face the very pivotal long-term low at $61,229.
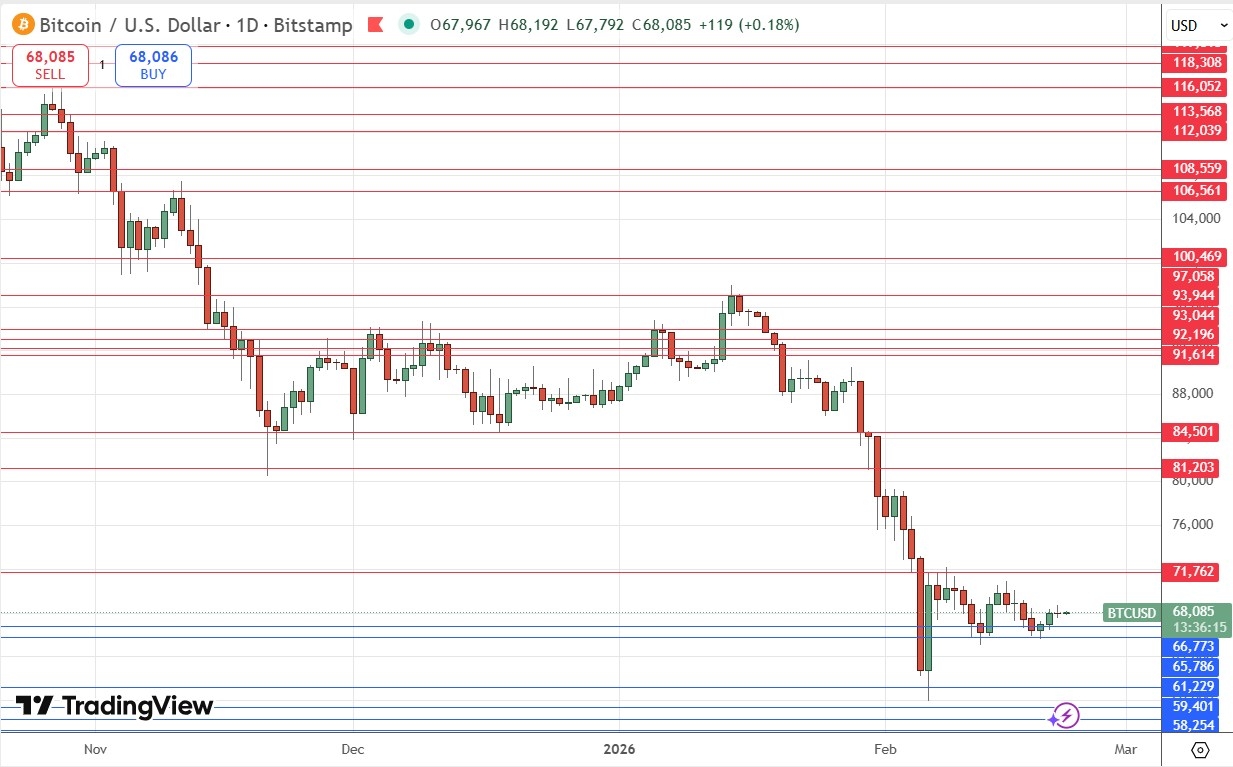
Bitcoin Daily Price Chart
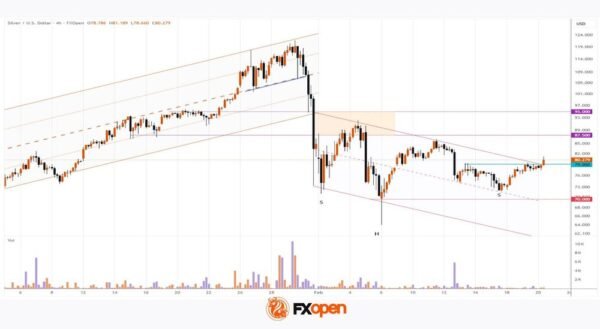
XAU/USD
Gold has started to rise convincingly again, although it is still a meaningful way off its record high which it made a few weeks ago. The daily chart below shows that Friday’s rise was especially impressive, with the price closing right on the high of the day and the week.
It looks as if Gold will continue to go higher, and the rise seems to be changing from a grind higher into a firmer upwards move.
The price is now well above the 50% Fib retracement level of the recent sharp crash in value, which is another bullish sign.
Trend and momentum traders who do not want to wait for long-term breakouts will probably want to be long here already. I prefer to wait for long-term new high prices, so I will wait for a daily close above $5,418.55 before I enter a long trade.
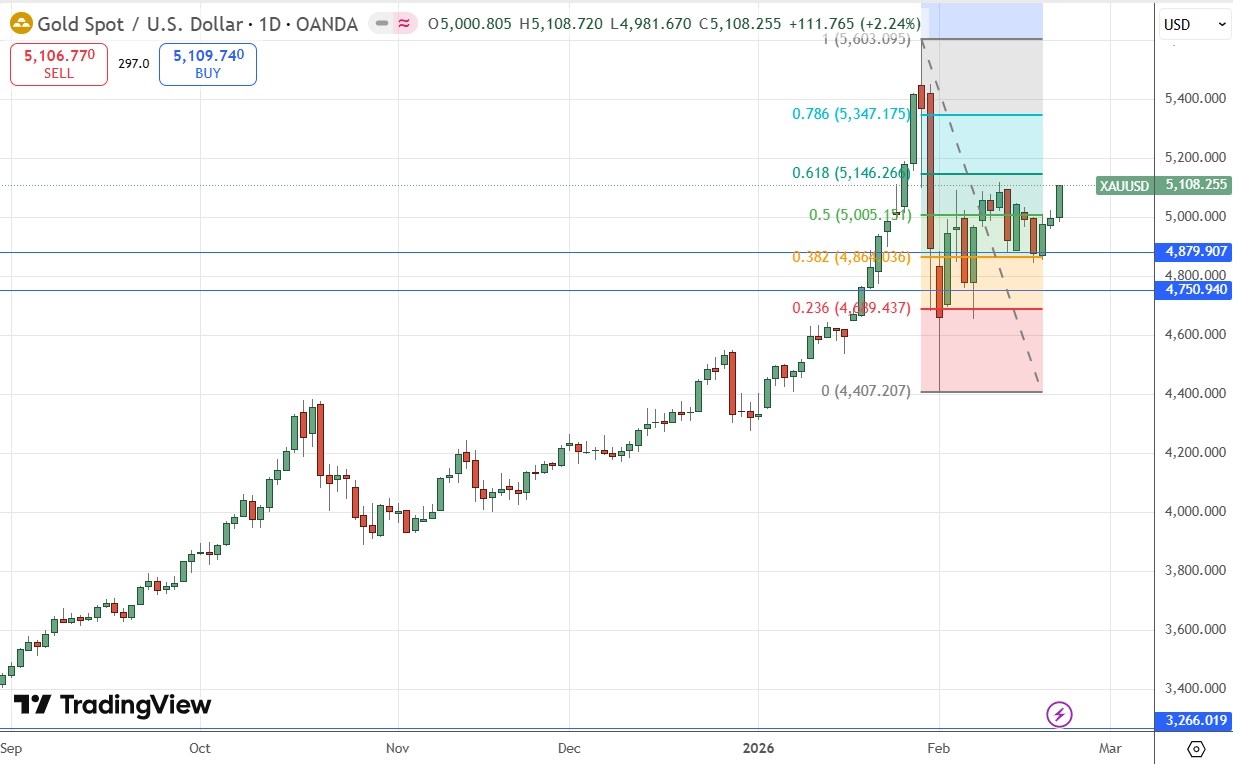
Gold Daily Price Chart
Bottom Line
I see the best trades this week as:
-
Long of the S&P 500 Index following a daily (New York) close above 7,025.
-
Long of Gold following a daily (New York) close above $5,418.55.
-
Long with a small position in WTI Crude Oil on short-term bullish price action while New York is open but be quick to take profits once war breaks out or if an agreement is reached.
Ready to trade our Forex weekly forecast? Check out our list of the best Forex brokers in the world.