US CPI Preview: US Dollar Index (DXY) at a Critical Crossroads Ahead of Looming CPI Spike

  • The US Dollar Index (DXY) is at a critical technical crossroads as CPI spike looms
  • Markets are bracing for a massive 1.0% surge in March Headline CPI
  • While the Headline CPI is forecasted to hit a two-year high of 3.4%, Core CPI is expected to remain stable at 0.2%, though the closure of the Strait of Hormuz presents a significant upside risk to food inflation

Market participants are eyeing the US Dollar Index (DXY) as it hovers above a key confluence area of support around the 98.50 mark.

The index has struggled to gain any traction since the gap down on Tuesday April 7, following the ceasefire announcement between the US and Iran. The optimism around a ceasefire remains fragile though as developments since the announcement hint at further escalation and a resumption of the war.

Thus the risk premium attached to markets remains firmly in play and this is evidenced by the lack of continuation to the moves which occurred just after the ceasefire announcement. Since then many assets have hovered in a tight range with Gold declining to levels prior to the ceasefire announcement overnight.

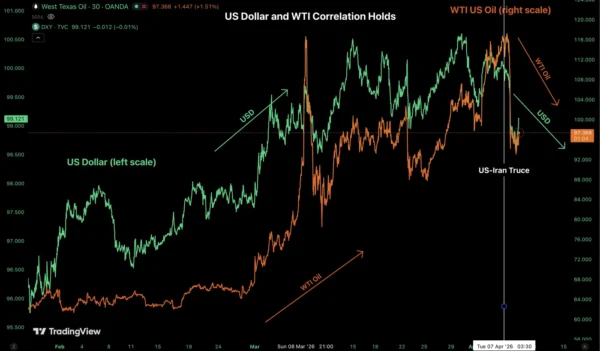
Oil prices on the other hand remain significantly higher than the pre-war levels and are once again breaching the $100/barrel mark.

The US dollar had benefitted from a risk off environment prior to the ceasefire and maybe get a renewed bid if the situation remains tense. For now though, the DXY remains caught in a tight range.

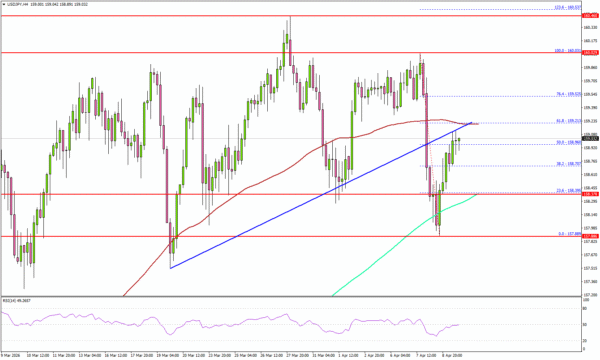
US Dollar Index (DXY) Daily Chart, April 9, 2026

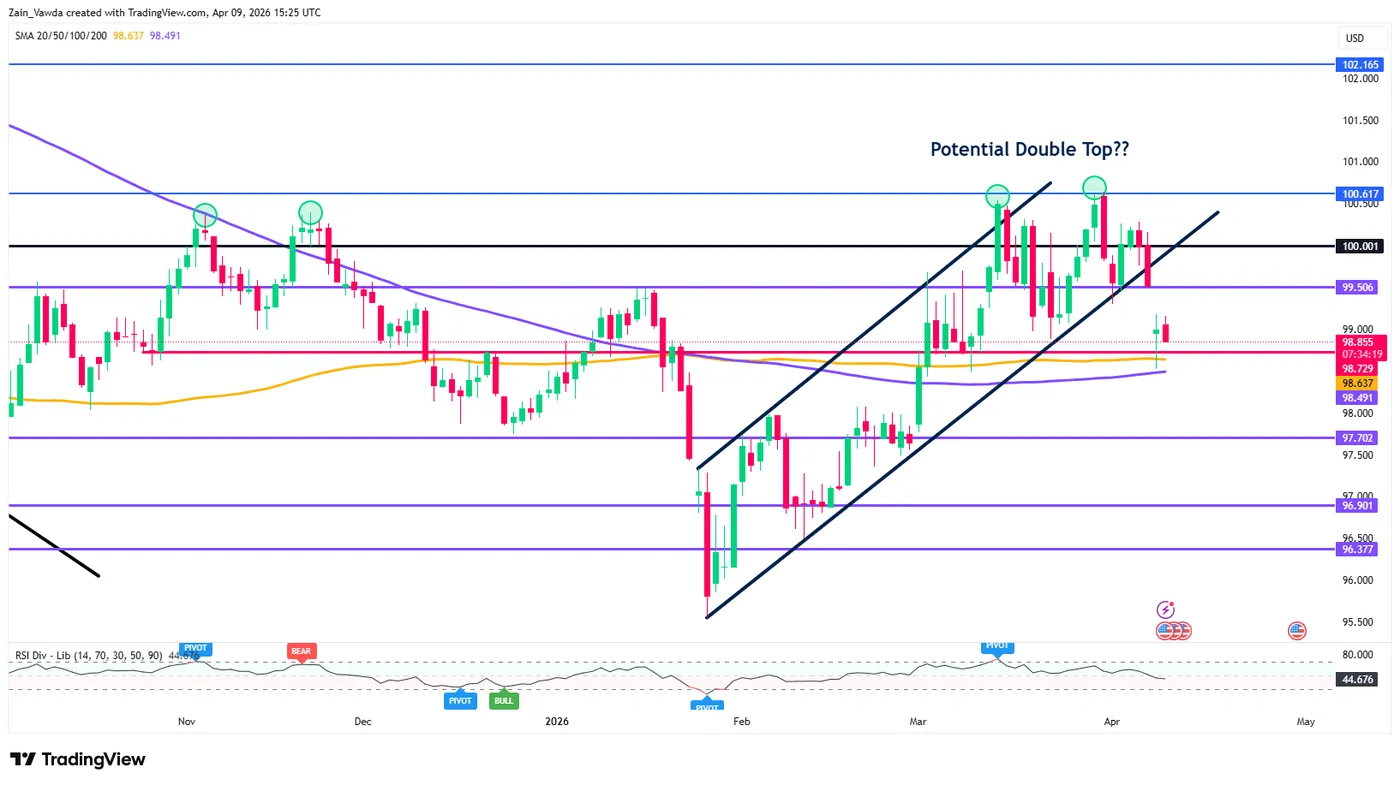
Source: TradingView.com (click to enlarge)

Looking at the technical picture, The US Dollar Index (DXY) is at a critical crossroads.

The index has recently snapped its ascending channel, signaling a shift in market structure. We are now seeing a potential retest of the 99.50 and 100.00 psychological handles from below, which has flipped from support to resistance.

  • Key Support: Immediate focus is on the confluence of the 100-day SMA (98.63) and the 200-day SMA (98.49). A daily close below this “Golden Cross” zone would confirm the trend reversal.
  • Key Resistance: Bulls need a move back above the 100.00 mark and the recent swing high of 100.61 to invalidate the bearish pattern.

With the RSI softening toward the 40 level, the path of least resistance appears to be lower.

Conversely, if the DXY fails to record a daily candle close below the “Golden Cross” zone and 200-day MA then a retest of the 99.50 zone and potentially the psychological 100.00 level will increase in probability.

US GDP, PCE data fail to inspire a move. Will US CPI be the catalyst?

The latest batch of economic data paints a challenging picture for the U.S. economy: a “stagflationary” cocktail of cooling growth, shrinking personal incomes, and an unexpected climb in jobless claims.

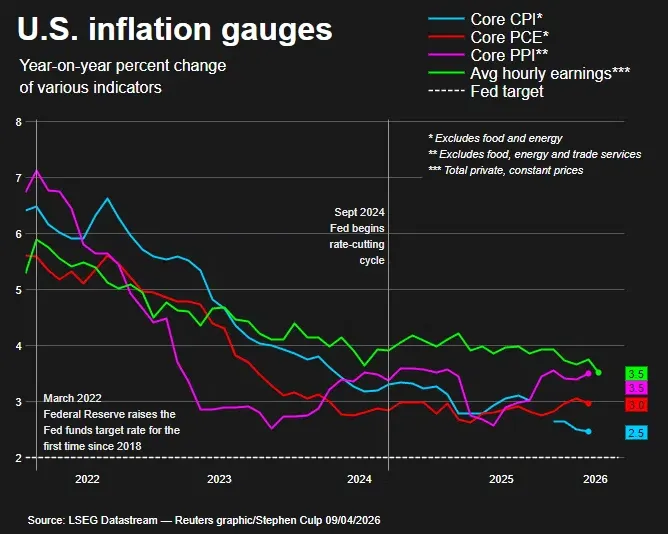
However, it was the inflation data that stole the spotlight. The Commerce Department’s February Personal Consumption Expenditures (PCE) report—the Federal Reserve’s preferred metric—landed exactly on the mark. Headline prices climbed 0.4% for the month, a slight heat-up from January’s 0.3%, while maintaining a 2.8% annual pace.

The Core Reality

Core PCE, which filters out the noise of food and energy, also matched forecasts with a monthly rise of 0.4% and an annual print of 3.0%. While these figures met expectations, two major caveats remain:

  • The Target Gap: Inflation remains stubbornly well above the Fed’s 2% mandate.
  • The Lag Effect: This data captures the pre-war environment. It does not yet account for the massive energy price spike triggered by the conflict with Iran which leaves the March outlook significantly more hawkish.

Source: LSEG

US CPI preview

Heading into tomorrow’s CPI release which would provide a first glance at the potential impact of rising Oil prices, markets are bracing for a massive 1.0% surge in March CPI, the sharpest monthly jump since the 2022 energy crisis following the invasion of Ukraine. This spike is almost entirely a “pain at the pump” story; gasoline prices are projected to drive a staggering 12.5% increase in energy costs.

While the headline figure is set to jump, the underlying trend remains more subdued:

Core CPI (Ex-Food & Energy): Expected at a moderate 0.2%, matching February’s pace.
Annual Headline Inflation: Forecasted to leap from 2.4% to 3.4%, hitting a two-year high.
Annual Core Inflation: Projected to tick up slightly to 2.6%.

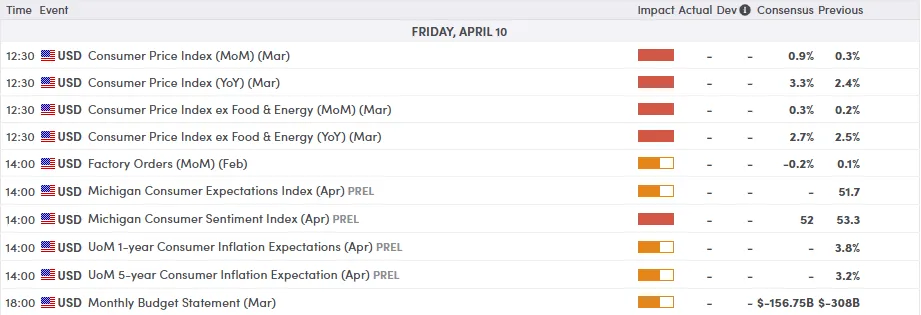
For all market-moving economic releases and events, see the MarketPulse Economic Calendar. (click to enlarge)

The Risk Factor: Although food is expected to rise by a modest 0.3%, the ongoing closure of the Strait of Hormuz poses a significant upside threat. Disruptions to global fertilizer supplies could soon turn “moderate” food inflation into a much larger headache for the Fed.

In short, energy is doing the heavy lifting here, and while core inflation looks stable for now, the geopolitical ripple effects are just beginning to surface.

Such a move in the CPI print should in theory provide support for the US Dollar and could lead to a rebound.

However, the risk off/risk on sentiment dynamics remain the primary at present and thus any developments in the Middle East could still overshadow the CPI release.

Stay nimble.

Source link

Visited 1 times, 1 visit(s) today

Related Article

NZ BNZ Manufacturing Falls to 53.2, Slower Expansion as War Concerns Weigh on Sentiment

NZ BNZ Manufacturing Falls to 53.2, Slower Expansion as War Concerns Weigh on Sentiment

New Zealand’s BusinessNZ Performance of Manufacturing Index eased from 54.8 to 53.2 in March, signaling that manufacturing activity remains in expansion but at a slower pace. The details showed some loss of momentum, with production falling from 56.3 to 53.8 and new orders easing from 57.2 to 55.8, while deliveries slipped to the neutral 50.0

USD/JPY Pressures Resistance, US CPI May Drive Next Surge

USD/JPY Pressures Resistance, US CPI May Drive Next Surge

Key Highlights USD/JPY started a decent upward wave above 158.50. It faces key hurdles near 159.20 and 159.50 on the 4-hour chart. EUR/USD could extend gains if it settles above the 1.1720 resistance. Gold could aim for a fresh increase above $4,850. USD/JPY Technical Analysis The US Dollar found support at 157.85 and started a

Natural Gas, WTI Oil, Brent Oil Forecasts – Oil Retreats From Session Highs As Israel Agrees To Negotiate With Lebanon

Subscribe To Notifications Scan QR code to install app Important DisclaimersFXEmpire is owned and operated by Empire Media Network LTD., Company Registration Number 514641786, registered at 7 Jabotinsky Road, Ramat Gan 5252007, Israel. The content provided on this website includes general news and publications, our personal analysis and opinions, and materials provided by third parties.

iFOREX hires longtime CMC Markets exec Michael Hewson as Senior Financial Strategist

iFOREX hires longtime CMC Markets exec Michael Hewson as Senior Financial Strategist

Newly public Retail FX and CFDs broker iFOREX (LON:IFRX) has announced that the company has hired Michael Hewson as Senior Financial Strategist, with immediate effect. Michael Hewson brings more than 30 years experience across global financial markets, with deep expertise in technical and fundamental analysis. He has held senior analytical roles across leading institutions, including

Brent Oil Reversal Confirmed: Elliott Wave Analysis Signals Deeper Correction

Subscribe To Notifications Scan QR code to install app Important DisclaimersFXEmpire is owned and operated by Empire Media Network LTD., Company Registration Number 514641786, registered at 7 Jabotinsky Road, Ramat Gan 5252007, Israel. The content provided on this website includes general news and publications, our personal analysis and opinions, and materials provided by third parties.

Week Ahead – US PPI Data and ECB Meeting Minutes on Tap

Week Ahead – US PPI Data and ECB Meeting Minutes on Tap

Fed rate cut bets return after ceasefire in Iran war. US PPI figures to test whether the Fed could resume rate reductions. ECB meeting minutes and UK data to test ECB and BoE expectations. Aussie traders await AU employment report and China’s GDP. Dollar pulls back amid ceasefire in the Middle East The US dollar

U.S. Dollar Retreats As GDP Growth Rate Misses Estimates: Analysis For EUR/USD, GBP/USD, USD/CAD, USD/JPY

Subscribe To Notifications Scan QR code to install app Important DisclaimersFXEmpire is owned and operated by Empire Media Network LTD., Company Registration Number 514641786, registered at 7 Jabotinsky Road, Ramat Gan 5252007, Israel. The content provided on this website includes general news and publications, our personal analysis and opinions, and materials provided by third parties.

EUR/JPY Mid-Day Outlook - ActionForex

EUR/JPY Mid-Day Outlook – ActionForex

Daily Pivots: (S1) 184.63; (P) 185.10; (R1) 185.38; More… EUR/JPY’s rally continues today and intraday bias stays on the upside. Rise from 180.78 should target a retest on 186.86 high. Firm break there will confirm larger up trend resumption. On the downside, below 184.77 minor support will turn intraday bias neutral first. But rise will

Elliott Wave Outlook S&P 500 (SPX) Eyeing New All Time High

Elliott Wave Outlook S&P 500 (SPX) Eyeing New All Time High

The S&P 500 (SPX) completed its cycle from the April 2025 low on February 2, 2026, when it reached 6991.92. This level is identified as wave (1). Since that peak, the Index has been correcting the entire cycle from April 2025 through a double‑three Elliott Wave structure. From the February high, wave W declined to

Prop firm FundingRock adds cTrader

Prop firm FundingRock adds cTrader

Trading technology provider Spotware has announced that it has partnered with FundingRock, an innovative proprietary trading firm known for its transparency, robust educational resources and dedicated trader support. Through this collaboration, FundingRock introduces cTrader, used by over 11 million active traders worldwide, delivering a premium trading environment designed to empower traders of all levels. FundingRock’s

US 10-Year Yield "V" Shaped Rebound Signals Rejection of Iran Ceasefire Optimism

US 10-Year Yield “V” Shaped Rebound Signals Rejection of Iran Ceasefire Optimism

The market reaction to the two-week US-Iran ceasefire is already turning, with signs of rejection of ceasefire optimism emerging across key asset classes. What initially appeared as a decisive de-escalation could be reassessed as a fragile truce, not peace, with markets are pricing risk re-entry as early doubts take hold. The most telling signal lies

GBP/USD Picks Up Pace, Is a Breakout Now Imminent?

GBP/USD Picks Up Pace, Is a Breakout Now Imminent?

Key Highlights GBP/USD started a fresh surge above 1.3350 and 1.3440. It cleared a key bearish trend line with resistance at 1.3280 on the 4-hour chart. EUR/USD also climbed higher above the 1.1650 resistance. WTI Crude Oil prices trimmed most gains and traded below $95. GBP/USD Technical Analysis The British Pound found support at 1.3150

U.S. Dollar Dives On Middle East Ceasefire: Analysis For EUR/USD, GBP/USD, USD/CAD, USD/JPY

Subscribe To Notifications Scan QR code to install app Important DisclaimersFXEmpire is owned and operated by Empire Media Network LTD., Company Registration Number 514641786, registered at 7 Jabotinsky Road, Ramat Gan 5252007, Israel. The content provided on this website includes general news and publications, our personal analysis and opinions, and materials provided by third parties.

DB Investing partners with MBME Pay on UAE deposits to trading accounts

DB Investing partners with MBME Pay on UAE deposits to trading accounts

Dubai based Retail FX and CFDs broker DB Investing has announced that the company has signed a service provider agreement with MBME Pay, to enable clients across the UAE to fund their trading accounts through MBME Pay’s kiosk network, marking a new step in broadening access to investment services for a wider range of retail

Gold (XAUUSD), Silver, Platinum Forecasts – Gold Gains Ground Amid Rising Appetite For Risk

Subscribe To Notifications Scan QR code to install app Important DisclaimersFXEmpire is owned and operated by Empire Media Network LTD., Company Registration Number 514641786, registered at 7 Jabotinsky Road, Ramat Gan 5252007, Israel. The content provided on this website includes general news and publications, our personal analysis and opinions, and materials provided by third parties.

Silver Price Analysis – Silver Continues to Move with Rates

Subscribe To Notifications Scan QR code to install app Important DisclaimersFXEmpire is owned and operated by Empire Media Network LTD., Company Registration Number 514641786, registered at 7 Jabotinsky Road, Ramat Gan 5252007, Israel. The content provided on this website includes general news and publications, our personal analysis and opinions, and materials provided by third parties.

Wall Street in Ecstasy! It's Almost Like Nothing Happened

Wall Street in Ecstasy! It’s Almost Like Nothing Happened

Mid-Week review where we dive into the major developments for North American and global Markets Yesterday evening, a two-week ceasefire was reached and Markets have exploded, easing their war premiums and discounts Crude Oil has now broken $100 and allowing Stocks and other assets to rally, at the cost of the Petrodollar Log in to

GBP/USD Mid-Day Outlook - ActionForex

GBP/USD Mid-Day Outlook – ActionForex

Daily Pivots: (S1) 1.3236; (P) 1.3268; (R1) 1.3327; More… GBP/USD’s break of 1.3479 resistance argues that fall from 1.3867 has completed as a correction at 1.3158. Intraday bias is back on the upside. Further rally should be seen to retest 1.3867 high. On the downside, below 1.3385 will turn intraday bias neutral and bring consolidations

0
Would love your thoughts, please comment.x
()
x