The Stock Market Is Doing Something for Only the 6th Time in 156 Years, and History Says It’s Clear What Comes Next for Stocks

Despite a few periods of short-lived volatility, 2026 has shaped up as another banner year for the stock market. The ageless Dow Jones Industrial Average (^DJI +0.10%), benchmark S&P 500 (^GSPC -0.40%), and innovation-powered Nasdaq Composite (^IXIC -0.91%) have reached several record highs, courtesy of the artificial intelligence (AI) infrastructure build-out.

While history decisively shows that Wall Street’s major stock indexes rise over long periods, it also tells us that bull markets aren’t indefinite and that when things look too good to be true, they typically are.

Currently, we’re witnessing the stock market do something for just the sixth time since January 1871 — and if history has its say, it’s pretty clear what comes next for stocks.

Image source: Getty Images.

The stock market is in nearly uncharted territory

At any given time, several headwinds are waiting in the wings to knock the Dow Jones Industrial Average, S&P 500, and Nasdaq Composite off their respective pedestals. Current examples include the parabolic increase in outstanding margin debt, persistently elevated inflation, and the potential for an AI bubble-bursting event.

But among this laundry list of headwinds, none stands out more than premium stock valuations.

Given that there’s no one-size-fits-all blueprint to evaluate and value individual companies or the broader market, discussing value can be incredibly tricky. The subjectivity and emotion that come into play when valuing stocks or the broader market are what make accurately predicting short-term movements so challenging.

Most investors rely on the price-to-earnings (P/E) ratio to quickly evaluate the relative cheapness or priciness of a public company or the broader market. Unfortunately, the traditional P/E ratio isn’t perfect. For instance, it loses its utility if corporate earnings turn negative during a recession.

This is where the stock market’s most time-tested valuation tool comes in handy: the S&P 500’s Shiller P/E Ratio, also known as the Cyclically Adjusted P/E Ratio (CAPE Ratio). Since the Shiller P/E Ratio is based on average inflation-adjusted earnings over the trailing 10 years, a recession won’t make this valuation tool useless.

When backtested to January 1871, the S&P 500’s Shiller P/E Ratio has averaged 17.45. As of the closing bell on Nov. 10, it clocked in at 39.70, or 128% above the long-term average.

While value is a tricky subject to tackle, history has consistently shown that bad things happen when the CAPE Ratio surpasses 30. The stock market has exceeded this arbitrary line in the sand six times over the last 156 years, including the present, and the previous five all ended poorly for equities:

  • August to September 1929: A parabolic increase in valuations occurred immediately before the Great Depression took shape and eventually wiped out 89% of the Dow Jones Industrial Average’s value.
  • June 1997 to August 2001: The CAPE Ratio registered its all-time high of 44.19 in December 1999, mere months before the dot-com bubble burst. The S&P 500 and Nasdaq Composite lost 49% and 78% of their respective values after the internet bubble burst.
  • September 2017 to November 2018: The third time the CAPE Ratio exceeded 30 ended with the S&P 500 sinking by roughly 20% during the fourth quarter of 2018.
  • December 2019 to February 2020: The Shiller P/E Ratio topped 30 just before the COVID-19 pandemic struck, wiping away 34% of the broad-based S&P 500’s value in only 33 calendar days.
  • August 2020 to May 2022: Fiscal stimulus checks fueled risk-taking during the pandemic, pushing the CAPE Ratio briefly above 40 during the first week of January 2022. The ensuing 2022 bear market lopped approximately one-fifth, one-quarter, and one-third off the Dow, S&P 500, and Nasdaq Composite, respectively.
  • November 2023 to present: The AI revolution pushed the CAPE Ratio as high as 42.84 in early June 2026.

History makes it abundantly clear that premium valuations lack staying power. Although the Shiller P/E Ratio offers no help in determining when the stock market will top or which catalysts will send stocks over the edge, it has a flawless, 156-year backtested track record of foreshadowing significant downside in the Dow, S&P 500, and Nasdaq Composite.

A smiling person reads a financial newspaper while seated at a kitchen table.

Image source: Getty Images.

Historical precedent is entirely based on investors’ perspectives

Though history offers a relatively dire outlook for investors, the silver lining is that the outcome can change based on investors’ perspectives. While the coming quarters may prove bleak, the long-term outlook for equities has arguably never been brighter.

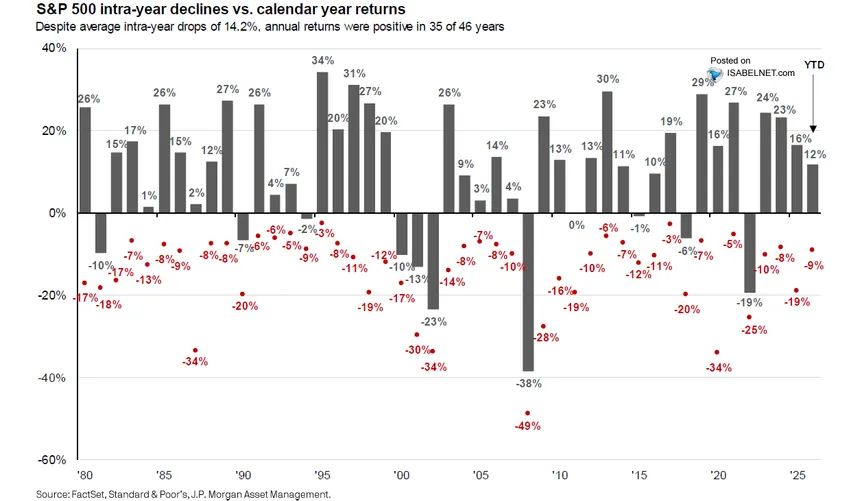
For example, history shows that stock market corrections and bear markets are inevitable aspects of the investing cycle. No amount of well-wishing can prevent these often emotion-driven double-digit downturns.

But history also shows that stock market corrections and bear markets tend to be short-lived.

In late May, the analysts at independent research firm Bespoke Investment Group published a data set on X (formerly Twitter) that calculated and compared the length of 27 separate S&P 500 bull and bear markets since the start of the Great Depression in September 1929. This data set offered tangible evidence of the milewide gap between optimism and pessimism on Wall Street.

According to Bespoke Investment Group, the average S&P 500 bear market has lasted 286 calendar days (about 9.5 months) over the previous 97 years. Furthermore, none of the 27 bear markets surpassed 630 calendar days.

By comparison, the typical S&P 500 bull market has persisted for 1,023 calendar days — roughly 3.6 times as long as the average S&P 500 bear market — with 14 of 27 bull markets lasting longer than 630 calendar days.

Although there’s no magic predictive tool that can consistently tell us when stock market downturns will begin, history has repeatedly shown that staying the course and buying into substantive dips is a winning strategy for long-term-minded, optimistic investors. Even if history repeats and the Dow Jones Industrial Average, S&P 500, and Nasdaq Composite plunge by at least 20% in the not-too-distant future, patient investors will be well positioned for success.

Where to invest $1,000 right now

When our analyst team has a stock tip, it can pay to listen. After all, Stock Advisor’s total average return is 823%* — a market-crushing outperformance compared to 209% for the S&P 500.

They just revealed what they believe are the 10 best stocks for investors to buy right now, available when you join Stock Advisor.

See the stocks ›

*Stock Advisor returns as of November 15, 2026.
Source link

Visited 1 times, 1 visit(s) today

Related Article

Want to Invest in Top Growth Stocks Like Amazon, Apple, and Microsoft but Avoid Nvidia? Consider This Low-Cost Vanguard ETF That’s Up 24.8% This Year.

Investors who want to avoid Nvidia (NASDAQ:NVDA) but put capital to work in growth-focused, exchange-traded funds (ETFs) face a difficult challenge. Nvidia is an integral part of index funds and exchange-traded funds (ETFs) — as the second-largest S&P 500 (SNPINDEX:^GSPC) and Nasdaq Composite (NASDAQINDEX:^IXIC) holding behind Apple (NASDAQ:AAPL). Nvidia also joined the Dow Jones Industrial

The Evidence Is Piling Up: AMD Could Be the Best Artificial Intelligence (AI) Stock to Buy Amid the Sell-Off

The past few months haven’t been pretty for semiconductor stocks, as evidenced by the 12% decline in the PHLX Semiconductor Sector index over the past three months. Even Advanced Micro Devices (AMD -8.75%) has been caught up in this vortex, experiencing significant volatility amid concerns about the sustainability of artificial intelligence (AI) infrastructure spending, which

These 5 International ETFs Add Stocks From Outside the U.S.

The Vanguard FTSE Developed Markets ETF (VEA +0.01%), Vanguard FTSE Emerging Markets ETF (VWO -0.09%), iShares Core MSCI EAFE ETF (IEFA +0.13%), iShares MSCI Emerging Markets ETF (EEM -0.36%), and Vanguard Total International Stock ETF (VXUS -0.02%) all enable investors to add some international exposure to their portfolio. However, that doesn’t mean these funds are

These 3 Dividend Stocks Just Reported Strong Earnings. Here’s the One I’m Buying Now.

Three real estate investment trusts, or REITs, reported third-quarter results recently, and the results looked strong across the board. Realty Income (O -0.74%), Empire State Realty Trust (ESRT +1.53%) and Ryman Hospitality Properties (RHP -1.04%) own very different kinds of real estate, and all three raised their full-year guidance. I own all three of these

The Stock Market’s Election Day Rally Just Taught Investors a Crucial Lesson

Mr. Market was a fictional character created by Benjamin Graham, the man who helped to train Warren Buffett. The stock market’s response to the mid-term election results is almost the perfect example of how Mr. Market works in the real world. And all you need to see to understand is two days of performance of

Elon Musk’s Tesla and SpaceX Lost More Than $420 Billion in Combined Market Value in Two Days After Democrats Swept the Midterms, With Investors Fearing New Congressional Probes. Here’s Why That Political Risk Matters for Shareholders

Elon Musk-led publicly traded corporations, Tesla (NASDAQ:TSLA) and Space Exploration Technologies (NASDAQ:SPCX), remain volatile. In the days following the U.S. midterm election, they shed a combined $420 billion in market value. Both companies recovered most of these losses and are now back around their pre-election levels, but this recent episode highlighted the extent to which

This beaten-down income stock now yields over 7%, after decades of dividend growth

Image source: Getty Images Not many UK income stocks have grown their dividend per share every year for half a century. But some have – and one member of that elite group is James Halstead (LSE: JHD), a long-established manufacturer and distributor of floor coverings. A clear guide to Anthropic’s IPO (without the hype) A

Think Nvidia Stock Is a Bargain? 6 Reasons the Face of the AI Build-Out Can Plunge Another 50% Following Jensen Huang’s Resignation.

For the better part of the last four years, no trend has captured the attention and capital of investors quite like the evolution of artificial intelligence (AI). Empowering software and systems with the tools to make split-second, autonomous decisions is a $22.5 trillion global addressable opportunity through 2031, according to IDC. Nvidia (NVDA -2.01%) is

Market Musings 141126: Improving returns at lower risk with simple timing models

Market Musings 141126: Improving returns at lower risk with simple timing models Even for long-term, patient stock market investors, there comes a point when the stock market falls by a certain percentage, let’s say 5% or 10%, where the question of reducing risk or staying fully invested should be asked. In this latest September-October stock

Samsung Electronics, SK hynix account for 27% of Korea stock credit loans

With investors in the two chipmakers holding nearly 7 trillion won in outstanding credit loans, or 27.2 percent of the total across the Kospi and Kosdaq, concerns have grown over broader market volatility. SK hynix headquarters in Icheon, Gyeonggi, on Oct. 28NEWS1 More than one-fourth of credit loans in Korea’s stock market are concentrated in just

Michael Burry sees 2 chip winners in Nvidia’s shake-up

Just over a week ago, “The Big Short” investor Michael Burry pulled most of his chips off a winning Caterpillar bet. He cut those puts by 75% after they roughly quadrupled. Then Nvidia’s leadership turmoil gave him reason to press his other bearish bets. In a Substack post on Thursday, Burry said he doubled his

Alibaba vs. Uber Technologies: Which Tech Platform Stock Is a Better Buy for 2027?

Global platforms like Alibaba Group (BABA +0.02%) and Uber Technologies (UBER +0.83%) dominate their respective markets through massive scale. Choosing between these giants requires weighing deep value in Asia against high-growth mobility services. Collapse BABA & UBER: Performance Comparison Key Financial Metrics BABA – Alibaba Group $94.38 +0.02% (+$0.02) UBER – Uber Technologies $69.69 +0.83%

George Soros’ firm builds $340 million stake in a resurgent tech stock

Another round of 13Fs has landed, and I figured Jim Simons’ old firm would be a tough act to follow. Renaissance Technologies nearly dumped its entire Nvidia (NVDA) stake while disclosing $2.24 billion in combined Micron Technologies (MU) and SpaceX holdings (SPCX).  Then I opened George Soros’ firm’s filing. One share count made me go

AMD Just Had Its Biggest Run Against Nvidia Since 1999. Can It Survive Earnings?

AMD outperformed Nvidia by 53.2 percentage points over five trading days, according to The Kobeissi Letter. That is the widest gap between the two chipmakers since Nvidia went public in January 1999. That lead met its first test on Friday, when AMD stock fell 8.75%. Nvidia’s November 17 earnings report now sets up the next

US MARKETS CALL: Below The Calm Deep Blue Sea

The major stock market indexes have gone nowhere since early August. On the surface, the seas have been calm. Underneath, plenty of turbulence has been occurring. Most of the volatility has been within sectors. In mid-September, we warned our readers to proceed with caution through the midterm elections. We expected and are now seeing buying

Is CoreWeave Stock a Buy After Its Latest Earnings?

CoreWeave (CRWV -6.13%) just delivered another impressive quarter. Revenue surged 168% year over year to $3.7 billion, its customer backlog reached $132.5 billion, and management raised its full-year guidance. Yet the company still reported a net loss of $709 million. For investors, this creates an interesting dilemma. CoreWeave is becoming an increasingly important player in

0
Would love your thoughts, please comment.x
()
x