If things seem too perfect for investors, they often are.
By Sean Williams –
Key Points
-
It’s been a stellar year for the Dow Jones Industrial Average, S&P 500, and Nasdaq Composite, which vaulted to several record highs on the heels of the artificial intelligence (AI) infrastructure build-out.
-
Stock market valuations have entered rarefied (and unsustainable) territory.
-
Optimism and patience repeatedly trump pessimism and short-term thinking.
With less than six weeks left in 2026, investors have little to complain about. The mature-stock-driven Dow Jones Industrial Average (^DJI -1.93%), broad-based S&P 500 (^GSPC -3.70%), and tech-focused Nasdaq Composite (^IXIC -5.28%) have all catapulted to several record highs this year, driven by the artificial intelligence (AI) infrastructure build-out, better-than-expected corporate earnings, and initial public offering euphoria.
While Wall Street’s major stock indexes have made a habit of climbing the proverbial wall of worry and rising over the long term, history also makes clear that bull markets don’t last forever. If things seem too perfect for investors, they often are.
Though any number of headwinds can knock the Dow, S&P 500, and Nasdaq Composite off their respective pedestals, one stands out. We’re currently witnessing the stock market do something for only the fifth time this century, and history doesn’t mince its words about what comes next for stocks.
Image source: Getty Images.
Stock valuations have entered rarefied (and unsustainable) territory
Despite a parabolic move in outstanding margin debt sending all the wrong signals, the biggest worry for Wall Street and investors is premium stock valuations.
To be clear, past events can’t guarantee what the future holds. Nevertheless, history has shown a tendency to rhyme on Wall Street more often than not, making it an excellent teaching tool for those investors willing to listen.
Most investors rely on the time-tested price-to-earnings (P/E) ratio when evaluating individual companies or the broader market. While the P/E ratio, which is derived using trailing 12-month earnings per share (EPS), is incredibly useful for quickly sizing up mature businesses, it can lose its utility entirely when recessions occur and EPS turns negative.
For Wall Street’s broad-market stock indexes, the S&P 500’s Shiller P/E Ratio, also known as the Cyclically Adjusted P/E Ratio (CAPE Ratio), is a far superior valuation tool. The Shiller P/E is based on average inflation-adjusted EPS over the trailing 10 years, meaning recessions won’t render it useless.
Though economists introduced the S&P 500’s Shiller P/E Ratio less than four decades ago, it’s been backtested to January 1871. Over these 156 years, the average reading is a relatively modest 17.45. As of the closing bell on Nov. 17, it was 38.76, or 122% above this long-term average.
Stock Market Shiller PE Ratio on the verge of taking out its Dot Com Bubble all-time high 🚨 🤯 👀 https://t.co/CtCmSgWnLt
— Barchart (@Barchart) July 11, 2026
What’s particularly interesting is how the Dow, S&P 500, and Nasdaq Composite have behaved once the CAPE Ratio surpasses 30, which has happened six times since January 1871, and five times this century, including the present:
- June 1997 to August 2001: The CAPE Ratio reached its highest-ever multiple in December 1999 (44.19), just a few months before the dot-com bubble burst. Valuations were so aggressive during the internet era that it took until the second half of 2001 for the Shiller P/E to fall below 30. Eventually, the S&P 500 and Nasdaq Composite lost 49% and 78% of their respective values.
- September 2017 to November 2018: The Shiller P/E again surpassed 30 as blockchain technology hype took over Wall Street. A fourth-quarter swoon in 2018 wiped away 20% of the S&P 500’s value.
- December 2019 to February 2020: In the months leading up to the COVID-19 crash, the Shiller P/E poked its head above 30 for the third time this century. The COVID-19 crash lopped 34% off the benchmark S&P 500 in just 33 calendar days.
- August 2020 to May 2022: For only the second time in history, the CAPE Ratio exceeded 40 (albeit for just a few days) in early January 2022. However, the ensuing 2022 bear market slashed one-fifth, one-quarter, and one-third off the Dow Jones Industrial Average, S&P 500, and Nasdaq Composite by October 2022.
- November 2023 to present: The CAPE Ratio peaked at its second-highest multiple (42.84) in early June 2026, driven by AI-related excitement.
On the one hand, the S&P 500’s Shiller P/E can’t pinpoint when the major stock indexes will peak or which catalyst(s) will send stocks tumbling. But this arbitrary line in the sand has an impeccable track record of foreshadowing significant downturns (20% or greater) in the stock market’s major indexes.
History makes it crystal clear that premium valuations aren’t sustainable on Wall Street.

Image source: Getty Images.
Optimism and patience repeatedly trump pessimism and short-term thinking
Sometimes, history doesn’t offer the most glowing forecast for the stock market. But altering your perspective can vastly change the projected outcome.
To state what can be an unpleasant truth, stock market corrections, bear markets, and even occasional crashes are normal and healthy events. Given that most of these events are driven by investor emotions, there’s not much that can be done from a fiscal or monetary policy perspective to prevent them. Consider these events the cost of admission to take part in one of the world’s greatest wealth creators.
But stock market corrections, bear markets, and crashes share an important trait: they’re historically short-lived.
The analysts at Bespoke Investment Group examined every S&P 500 bull and bear market since the start of the Great Depression in September 1929, finding a sizable gap between optimism and pessimism on Wall Street.
According to Bespoke’s data set, released in late May, the average S&P 500 bear market finds its trough in 286 calendar days (about 9.5 months), while the typical bull market persists for 1,023 calendar days, or nearly 3.6 times as long.
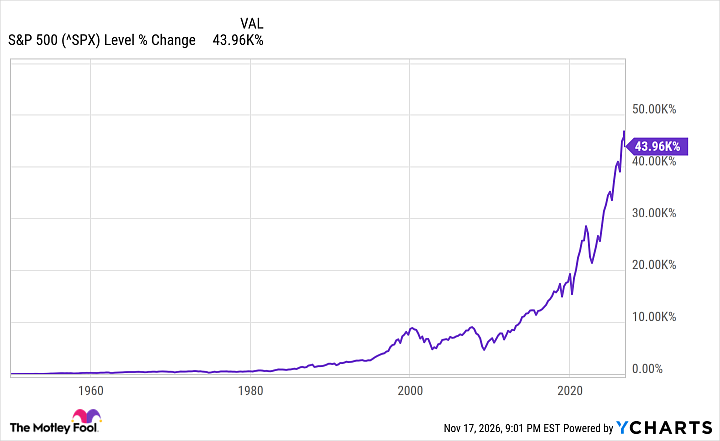
The analysts at Crestmont Research took things even further by examining the rolling 20-year total returns of the benchmark S&P 500 since 1900. Since the S&P wasn’t incepted until 1923, this meant tracking the total return of its components in other major indexes back to 1900.
Crestmont’s data yielded 107 separate rolling 20-year periods (1900-1919, 1901-1920, and so on, through 2006-2025), all of which generated a positive average annual return.
Hypothetically speaking, since S&P 500-tracking funds didn’t exist on U.S. exchanges until January 1993, if an investor had purchased an S&P 500 index fund at any point between 1900 and 2006 and simply held it for 20 years, they would have generated a profit every single time, including dividends. It didn’t matter if they bought near a top, before a recession, depression, war, pandemic, or high inflation… the result was always the same.
Even when the stock market gives investors lemons, history says make some lemonade and be patient.
Where to invest $1,000 right now
When our analyst team has a stock tip, it can pay to listen. After all, Stock Advisor’s total average return is 719%* — a market-crushing outperformance compared to 192% for the S&P 500.
They just revealed what they believe are the 10 best stocks for investors to buy right now, available when you join Stock Advisor.
*Stock Advisor returns as of November 22, 2026.