Over the long term, there’s no greater wealth creator than the stock market. Average annual returns for the benchmark S&P 500 (^GSPC +0.72%), iconic Dow Jones Industrial Average (^DJI +0.48%), and innovation-inspired Nasdaq Composite (^IXIC +1.16%) have trumped all other asset classes over multiple decades.
But this doesn’t mean equities rise in an orderly fashion. As of the closing bell on March 27, the Dow and Nasdaq Composite were already in correction territory with respective declines of 10% and 12.6%, while the S&P 500 was knocking on the door of a correction with an 8.7% pullback.
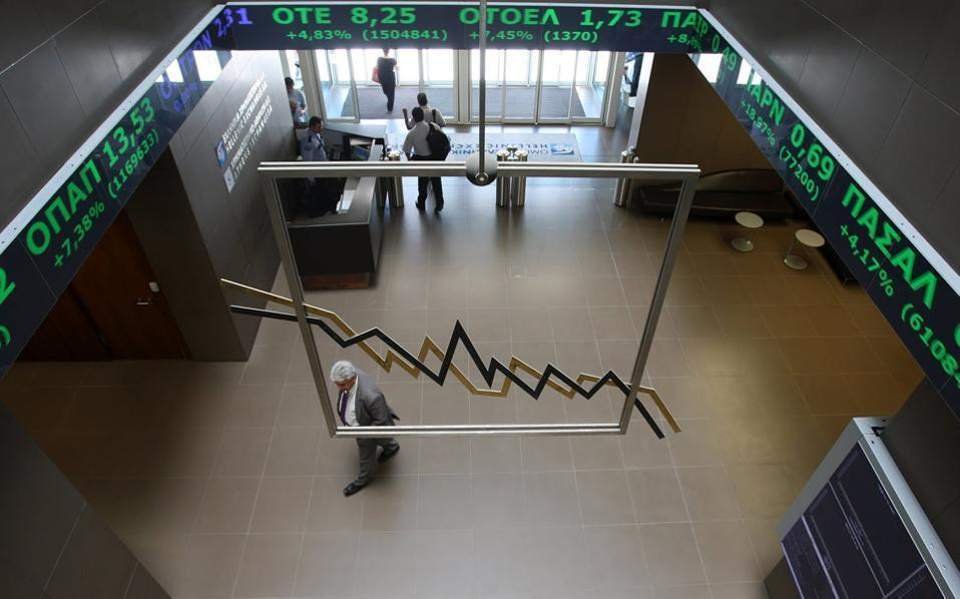
Image source: Getty Images.
While pullbacks and stock market corrections are normal and inevitable aspects of the investing cycle, history suggests this one may be just getting started for Wall Street’s benchmark index.
The S&P 500 just crossed the point of no return, yet again
Before moving ahead, a quick note about historical precedent: it can’t guarantee what comes next for stocks. If past events could 100% predict short-term directional moves in Wall Street’s major stock indexes, every investor would be relying on them.
Nevertheless, one historical marker has a 100% success rate of foreshadowing additional downside in the S&P 500 over the last eight years: the 20-week moving average (MA).
As the name implies, the 20-week MA is a trendline based on the average price for a security or index over the trailing 20 weeks. If the S&P 500 is above its 20-week MA, it indicates an uptrend. If it falls below this level, it signals a potential reversal.
S&P 500 $SPX on track for its 4th consecutive weekly close below the 20-week average 🚨 Historically, when you get four, there are typically more 📉😱👀 pic.twitter.com/tAoT9j8ZWY
— Barchart (@Barchart) March 26, 2026
According to financial technology company Barchart, last week marked the S&P 500’s fourth consecutive weekly close below the 20-week MA. Wall Street’s benchmark index has had seven occurrences since the start of 2018 where it initially closed below its 20-week MA for four consecutive weeks, including the present, and the previous six were all followed by additional downside.
While there’s no guarantee that the S&P 500, Dow, and Nasdaq Composite will head lower, Wall Street certainly isn’t short of headwinds. For instance, the Iran war has sent energy commodities soaring and is expected to have an adverse impact on U.S. inflation.
The stock market also entered 2026 at its second-priciest valuation in 155 years, according to the Shiller Price-to-Earnings (P/E) Ratio. History shows that the S&P 500 tumbles by at least 20% when the Shiller P/E exceeds 30.

Image source: Getty Images.
History is a two-sided coin
Although historical precedent bodes poorly for the widely followed S&P 500 in the weeks and months to come, things demonstrably change when investors broaden their perspective.
History has made clear that stock market corrections, bear markets, and crashes are short-lived events. If investors had purchased an S&P 500-tracking index following a four-week breach of the 20-week MA since 2018 and simply held this position for several years, they would have generated a positive total return, including dividends, every time.
A recently published data set from wealth management firm Bespoke Investment Group corroborates the disproportionate nature of investing cycles.
The current bull market — the “AI Bull” — has eclipsed the 1,200-day mark. This is the 10th bull market to last 1,000+ days based on the 20% rally/decline threshold.
Bear markets, on average, are much shorter, at just 286 days, with the longest being 630 days back in… pic.twitter.com/ds7lqWWHFh
— Bespoke (@bespokeinvest) February 10, 2026
Whereas the average S&P 500 bear market since the start of the Great Depression (September 1929) has resolved in 286 calendar days (approximately 9.5 months), the typical S&P 500 bull market has endured roughly 3.5 times longer, or 1,011 calendar days.
Despite the S&P 500 triggering alarm bells, the time for opportunistic long-term investors to pounce has arrived.