You might not realize it, but investors have enjoyed history-making gains since 2019. The benchmark S&P 500 (^GSPC +0.35%) has rallied at least 16% over three consecutive years three times since its inception. Two of these three occurrences have been since 2019 (2019-2021 and 2023-2025).
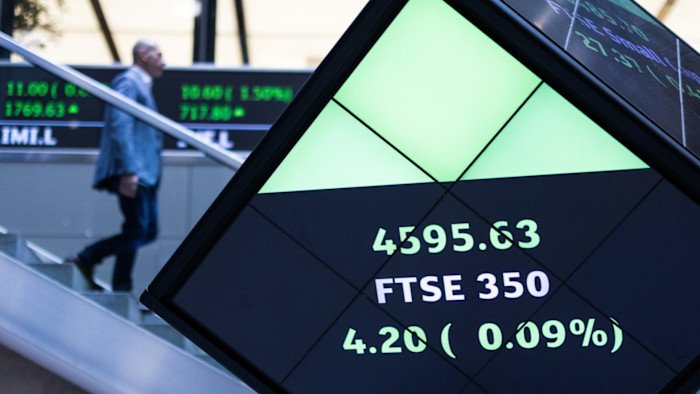
On top of the S&P 500’s success, the mature-stock-driven Dow Jones Industrial Average (^DJI +0.24%) hit 50,000, and the growth-focused Nasdaq Composite (^IXIC +0.40%) briefly touched 24,000. You could almost say that investors have been desensitized to Wall Street’s major stock indexes hitting all-time highs because it’s been such a common occurrence.
Image source: Getty Images.
But the stock market may not be as impenetrable as the gains in the Dow, S&P 500, and Nasdaq Composite have made it seem. According to one historically accurate signal, Wall Street’s benchmark index just sounded an alarm. The question is: Will investors heed this warning?
From “magnificent” to “meh”
Before digging any deeper, it’s important to preface any discussion about historical correlations with a reminder that nothing on Wall Street is guaranteed. If there were a data point or correlated metric that foretold the future with 100% accuracy, you can be assured that every investor would be using it.
With the above being said, there are data points and events that have strongly correlated with significant directional moves for the Dow Jones Industrial Average, S&P 500, and Nasdaq Composite throughout history. It’s these data points and events that are most interesting.
The newest signal that’s raising eyebrows has been brought to light by Carson Group’s Chief Market Strategist, Ryan Detrick.
On social media platform X (formerly Twitter), Detrick published a data set that compared the full-year return of the S&P 500 over 76 years (1950-2025) based on one variable: Did the index break below its December low during the subsequent first quarter (Jan. 1 – March 31)?
The S&P 500 just closed beneath the December low in the Q1.
38 times this happened and 38 times it didn’t.
When it breaks (like this year) the avg full yr return is 0.2% and up only 50% of time versus 18.9% and 94.7%.
File this under potential caution, of course, we saw this… pic.twitter.com/lPVlMkyneU
— Ryan Detrick, CMT (@RyanDetrick) March 12, 2026
Detrick found 38 instances in which the S&P 500 broke below its December low since 1950 and an even 38 instances where it didn’t. In the latter scenario, Wall Street’s benchmark index finished higher 94.7% of the time and gained an average of 18.9%. In comparison, if the S&P 500 fell below its December low, which it did last week, it was only higher 50% of the time by year’s end, with a paltry average annual gain of 0.2%.
In other words, history tells us that breaking the December low during the first quarter lowers projected full-year returns from “magnificent” to “meh.”
Several headwinds are mounting for a historically expensive stock market
The S&P 500 decisively falling below its December low comes at a time when headwinds are mounting for the stock market.
To begin with, there are concerns that an artificial intelligence (AI) bubble is forming and will subsequently burst. Although demand for AI infrastructure is off the charts, every game-changing technology spanning more than three decades has endured an early stage bubble-bursting event. Put another way, investors consistently overestimate the adoption and/or optimization of next-big-thing trends, leading to eventual disappointment. Thus far, nothing suggests AI will escape this fate.
The stock market also entered 2026 at its second-priciest valuation in history. Keeping in mind that valuation is inherently subjective, the S&P 500’s Shiller Price-to-Earnings (P/E) Ratio, also known as the Cyclically Adjusted P/E Ratio (CAPE Ratio), has made clear how outside of the norm the stock market currently is.
S&P 500 Shiller PE Ratio hits 2nd highest level in history 🚨 The highest was the Dot Com Bubble 🤯 pic.twitter.com/Lx634H7xKa
— Barchart (@Barchart) December 28, 2025
Whereas the Shiller P/E has averaged 17.35 over the last 155 years, it’s spent much of the last five months bouncing between 39 and 41. The only time the stock market was pricier was in the months leading up to the bursting of the dot-com bubble.
The five previous times the CAPE Ratio exceeded 30 during a continuous bull market led to eventual declines in the Dow, S&P 500, and/or Nasdaq ranging from 20% to 89%.
Wall Street is preparing for a shake-up at the Federal Reserve, as well. We’re less than two months away from Jerome Powell’s last day as Fed chair. President Donald Trump’s nominee to replace Powell, Kevin Warsh, has a historically hawkish voting track record and favors balance-sheet deleveraging at the nation’s central bank that could ultimately increase borrowing costs — mortgages included. Whereas investors are counting on future rate cuts, Warsh may have other plans.

Image source: Getty Images.
Take note: Stock market cycles aren’t linear
Based solely on what one data point has told us since 1950, Wall Street’s major stock indexes may be in for a challenging year. But this doesn’t mean investors should head for the hills, either.
Arguably, the most important takeaway when examining historical return data is that stock market cycles aren’t linear.
Stock market corrections, bear markets, and elevator-down moves in Wall Street’s major indexes may be feared events. But in the grand scheme of things, they’re the inevitable price of admission to a phenomenal wealth-creating machine and historically short-lived.
Recently, analysts at wealth management firm Bespoke Investment Group posted a data set on X that compared the calendar-day length of every S&P 500 bull and bear market since the start of the Great Depression (September 1929). Over more than 96 years, there was a night-and-day difference between bull and bear markets.
The current bull market — the “AI Bull” — has eclipsed the 1,200-day mark. This is the 10th bull market to last 1,000+ days based on the 20% rally/decline threshold.
Bear markets, on average, are much shorter, at just 286 days, with the longest being 630 days back in… pic.twitter.com/ds7lqWWHFh
— Bespoke (@bespokeinvest) February 10, 2026
On the one hand, the 27 S&P 500 bear markets have lasted an average of 286 calendar days, which works out to about 9.5 months. What’s more, the longest bear market on record is just 630 calendar days.
In comparison, the average S&P 500 bull market has endured for 1,011 calendar days, with 10 of these 27 bull markets surpassing 1,200 calendar days. Historically, every correction or “meh” performance in Wall Street’s major stock indexes has represented an opportunity for long-term-minded investors to pounce and position themselves for future gains.