DXY:
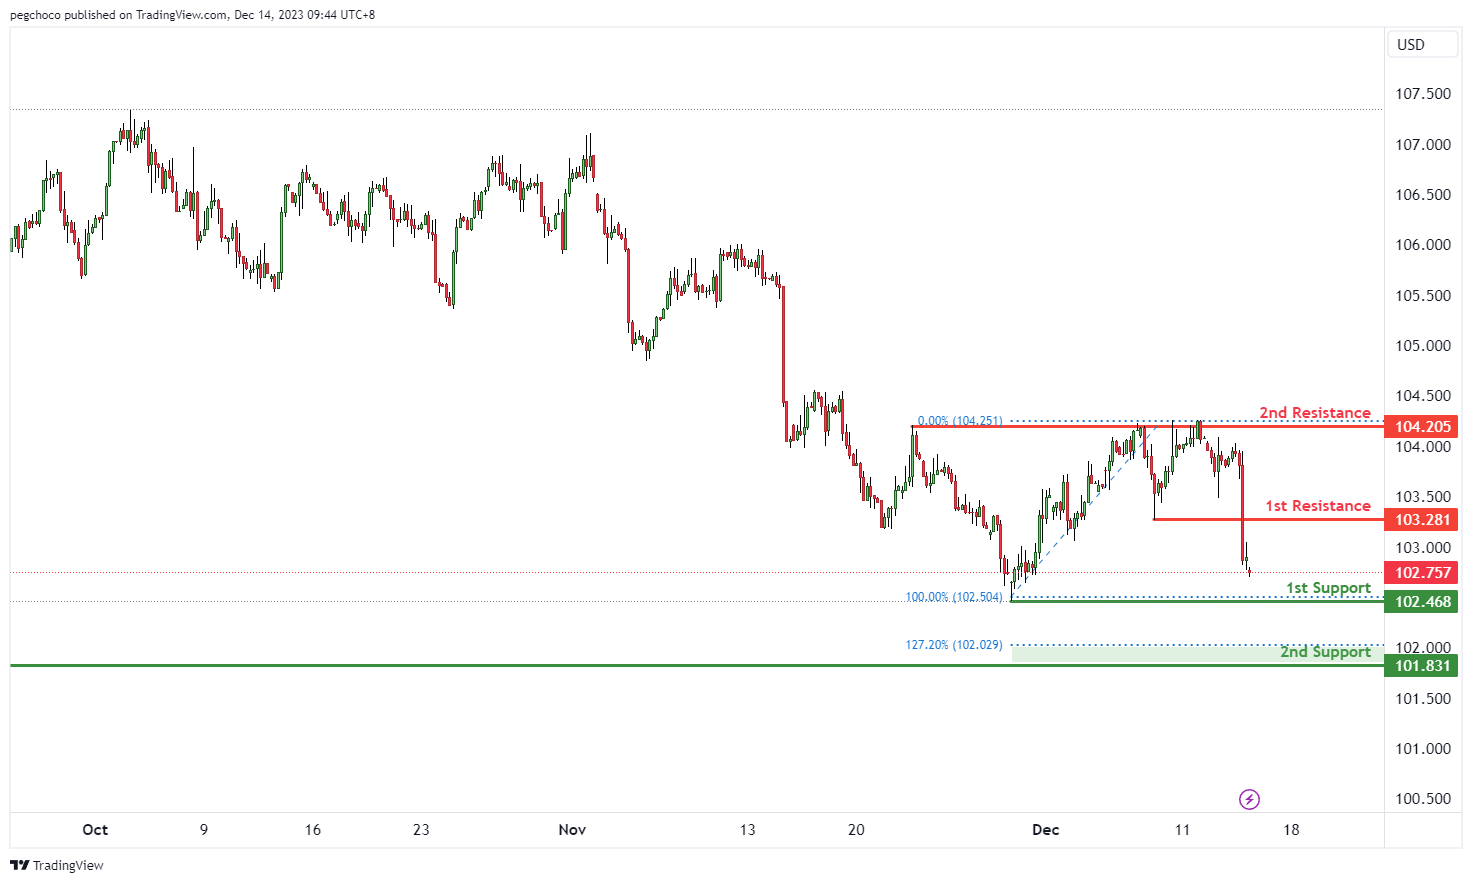
The DXY (US Dollar Index) chart currently shows a bearish overall momentum, indicating a downward trend in the US dollar. Price could potentially continue this bearish movement towards the 1st support level.
The 1st support at 102.46 is categorized as a swing low support, and it has historical significance as a level where buying interest emerged in the past. Traders should watch this level for potential signs of a temporary pause or reversal in the bearish movement.
The 2nd support at 101.83 is identified as an overlap support and coincides with the 127.20% Fibonacci Extension level. This suggests that it could be a stronger support level, but it’s still essential to monitor price action around this level carefully.
On the resistance side, the 1st resistance at 103.28 is considered a pullback resistance. This level may act as a barrier where selling interest could intensify, potentially causing a continuation of the bearish trend.
Further up, the 2nd resistance at 104.20 is categorized as a multi-swing high resistance, indicating another level where selling pressure may increase.
EUR/USD:
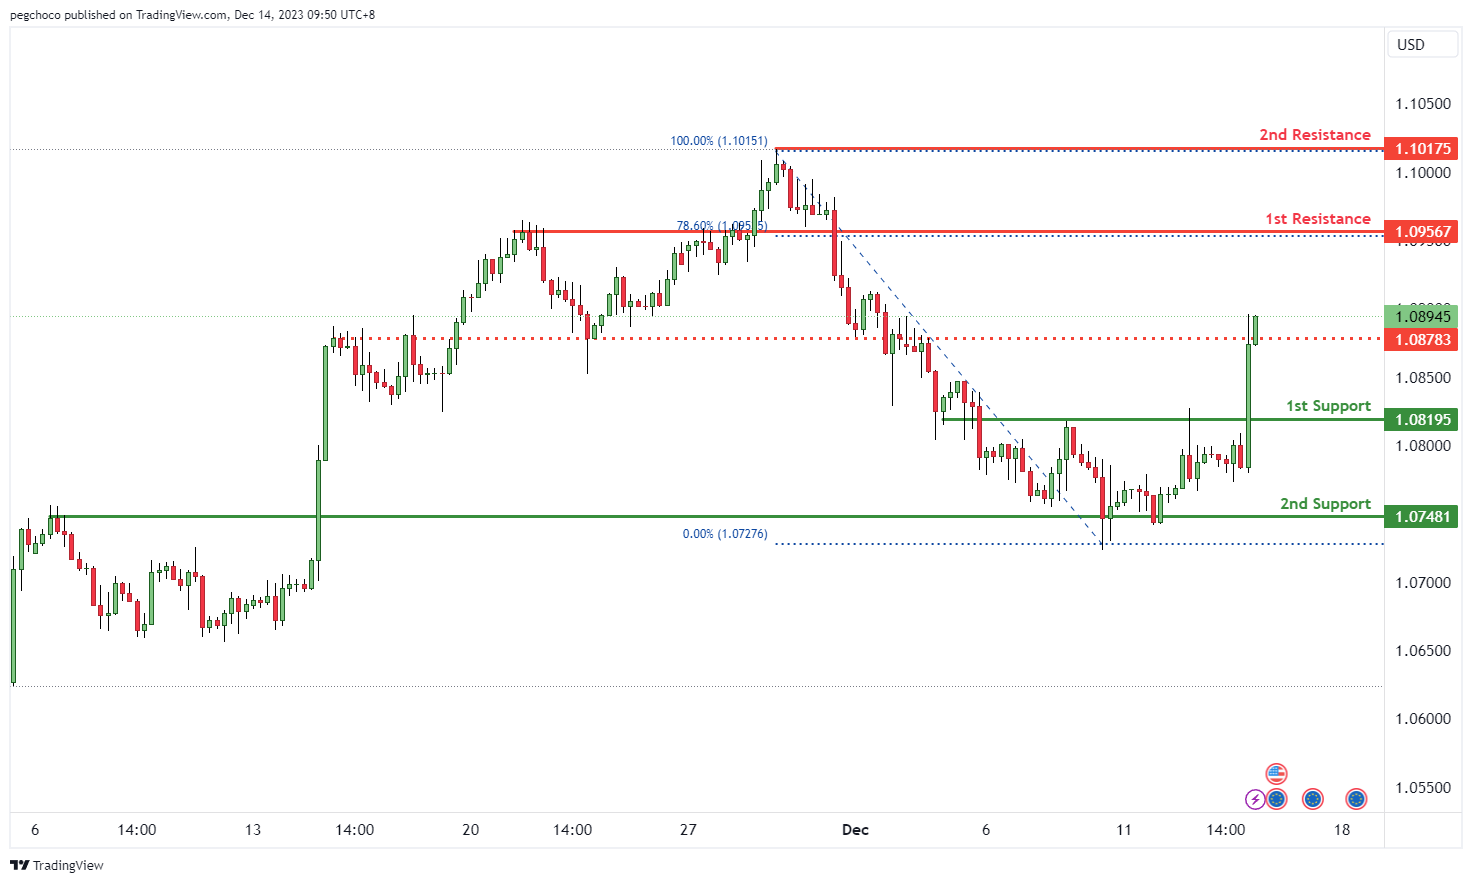
The EUR/USD chart currently has a bullish overall momentum, indicating an upward trend in the Euro against the US Dollar. Price could potentially continue this bullish movement towards the 1st resistance level.
The 1st support at 1.0819 is categorized as a pullback support. This level is significant as it suggests a potential area where buying interest may emerge, providing temporary support for the EUR/USD pair.
The 2nd support at 1.0748 is identified as an overlap support and coincides with the 78.60% Fibonacci Retracement level. This suggests that it could be a stronger support level, but it’s still essential to monitor price action around this level carefully.
On the resistance side, the 1st resistance at 1.0956 is considered a pullback resistance and coincides with the 78.60% Fibonacci Retracement level. This level may act as a barrier where selling interest could intensify, potentially causing a temporary pause or reversal in the bullish trend.
Further up, the 2nd resistance at 1.1017 is categorized as a swing high resistance, indicating another level where selling pressure may increase.
Intermediate resistance at 1.0878 also provides an important level to watch for potential price reactions.
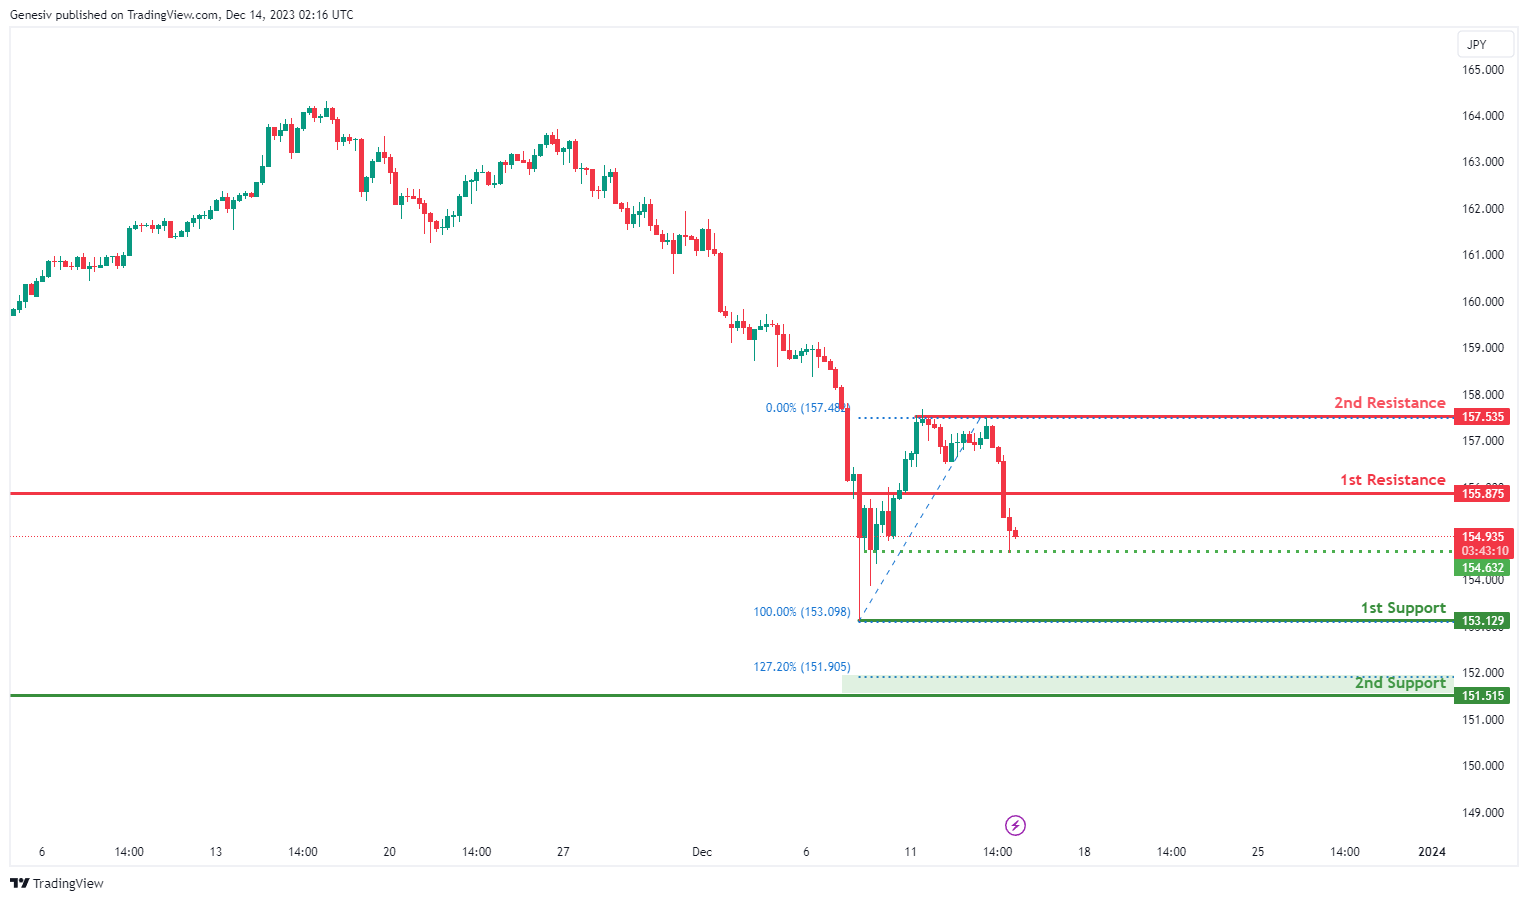
EUR/JPY:
The EUR/JPY chart currently demonstrates a bearish overall momentum, and there is a potential for a bearish continuation towards the 1st support.
The 1st support at 153.13 is considered significant for several reasons. Firstly, it is identified as a pullback support, indicating a potential area where buying interest may emerge after a pullback, providing support for the currency pair. Additionally, this level aligns with the 100% Fibonacci Retracement, further reinforcing its significance as a potential reversal or bounce point.
Similarly, the 2nd support at 151.52 is characterized as a swing low support and is associated with the 127.20% Fibonacci Extension. This confluence strengthens the support level, suggesting that it could act as a crucial zone where buying interest may be present, providing additional support for a potential reversal or bounce.
On the resistance side, the 1st resistance at 155.88 is identified as a pullback resistance. This level is likely to act as a barrier where selling interest could intensify, potentially causing a pause or reversal in the bearish trend.
Furthermore, the 2nd resistance at 157.54 is associated with multi-swing high resistance. This level adds an extra layer of significance to the resistance, indicating a potential area where selling pressure may increase, especially considering its alignment with multiple historical swing highs.
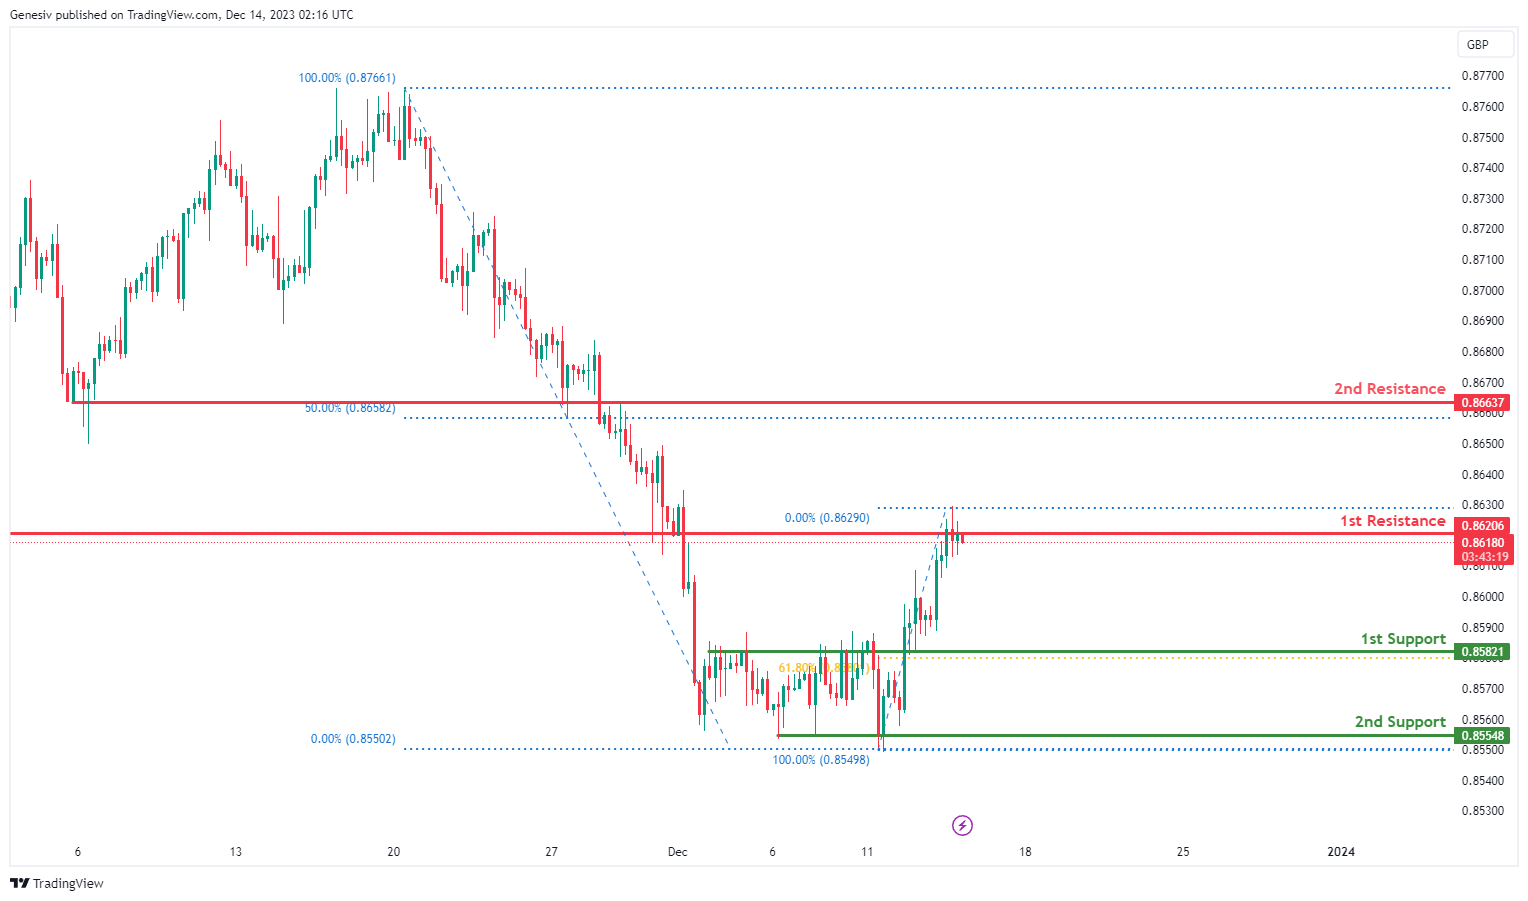
EUR/GBP:
The EUR/GBP chart currently indicates a bearish overall momentum, and there is a potential scenario where the price may experience a short-term rise towards the 1st resistance before reversing and dropping towards the 1st support.
The 1st support at 0.8582 is considered significant for multiple reasons. Firstly, it is identified as an overlap support, suggesting a convergence of historical price points and reinforcing its potential as a crucial area where buying interest may emerge. Additionally, this support level aligns with the 61.80% Fibonacci Retracement, further enhancing its importance as a potential reversal or bounce point.
Similarly, the 2nd support at 0.8555 is characterized as a multi-swing low support and is associated with the 100% Fibonacci Retracement. This confluence strengthens the support level, suggesting that it could act as a significant zone where buying interest may be present, providing additional support for a potential reversal or bounce.
On the resistance side, the 1st resistance at 0.8621 is identified as a pullback resistance. This level is likely to act as a barrier where selling interest could intensify, potentially causing a pause or reversal in the short-term rise before a drop.
Furthermore, the 2nd resistance at 0.8664 is associated with both an overlap support and the 50% Fibonacci Retracement. This adds an extra layer of significance to the resistance, indicating a potential area where selling pressure may increase, especially considering the alignment with both technical and Fibonacci-based resistance.
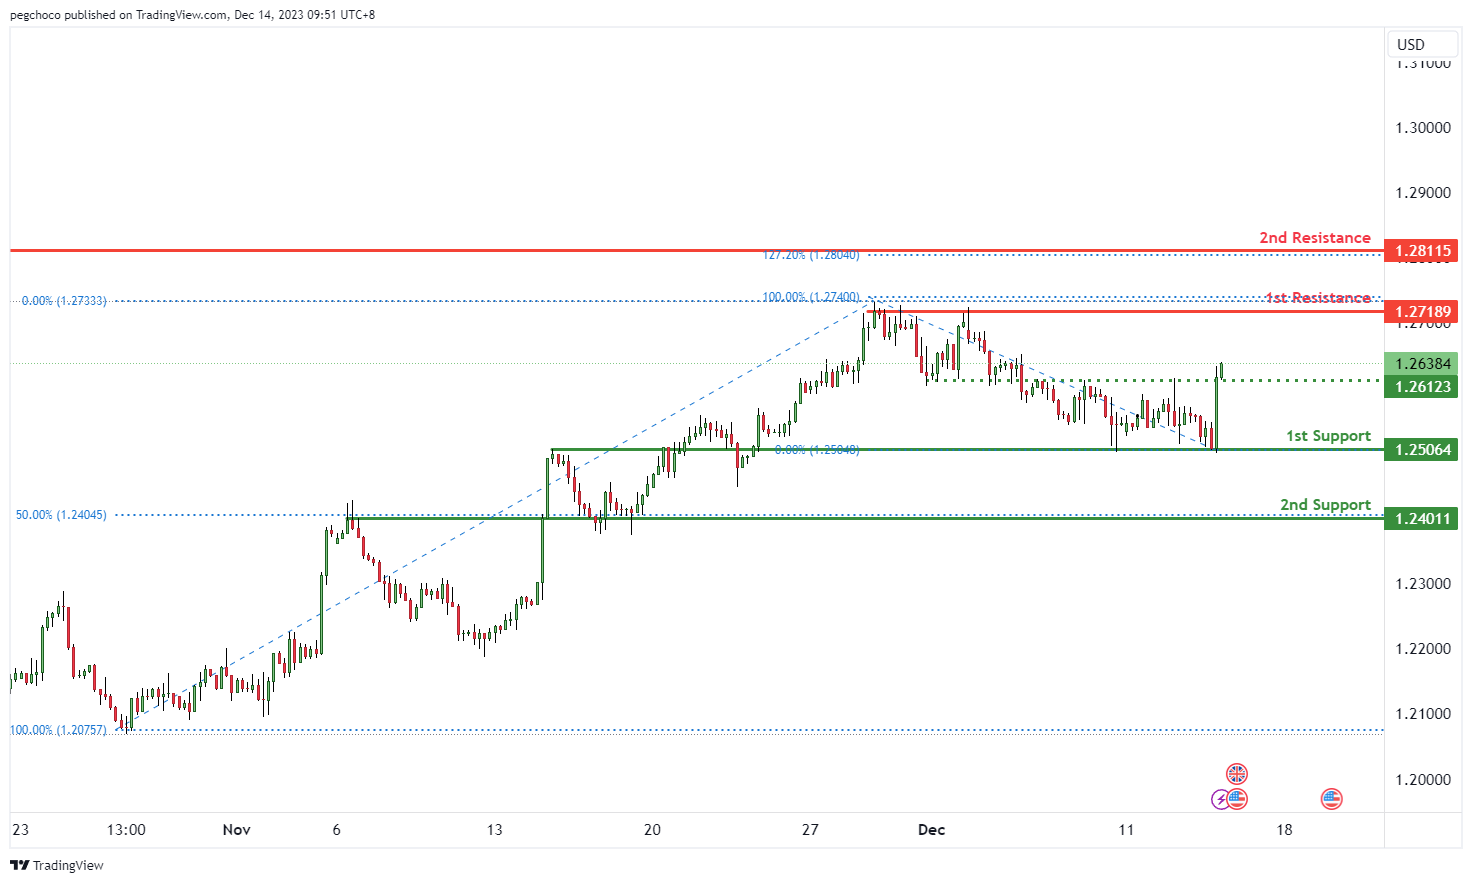
GBP/USD:
The GBP/USD chart currently exhibits a bullish overall momentum, indicating an upward trend in the British Pound against the US Dollar. Price could potentially continue this bullish movement towards the 1st resistance level.
The 1st support at 1.2506 is identified as an overlap support, which suggests that it has historical significance as a level where buying interest has emerged. This support level could provide temporary stability for the GBP/USD pair.
The 2nd support at 1.2401 coincides with the 50% Fibonacci Retracement level, further reinforcing its importance as a potential support level.
On the resistance side, the 1st resistance at 1.2718 is considered a multi-swing high resistance, indicating that it has historically acted as a significant barrier where selling interest intensified. This level is a key point to watch for potential price reactions.
The 2nd resistance at 1.2811 is also noteworthy as it coincides with the 127.20% Fibonacci Retracement level, indicating potential resistance based on Fibonacci analysis.
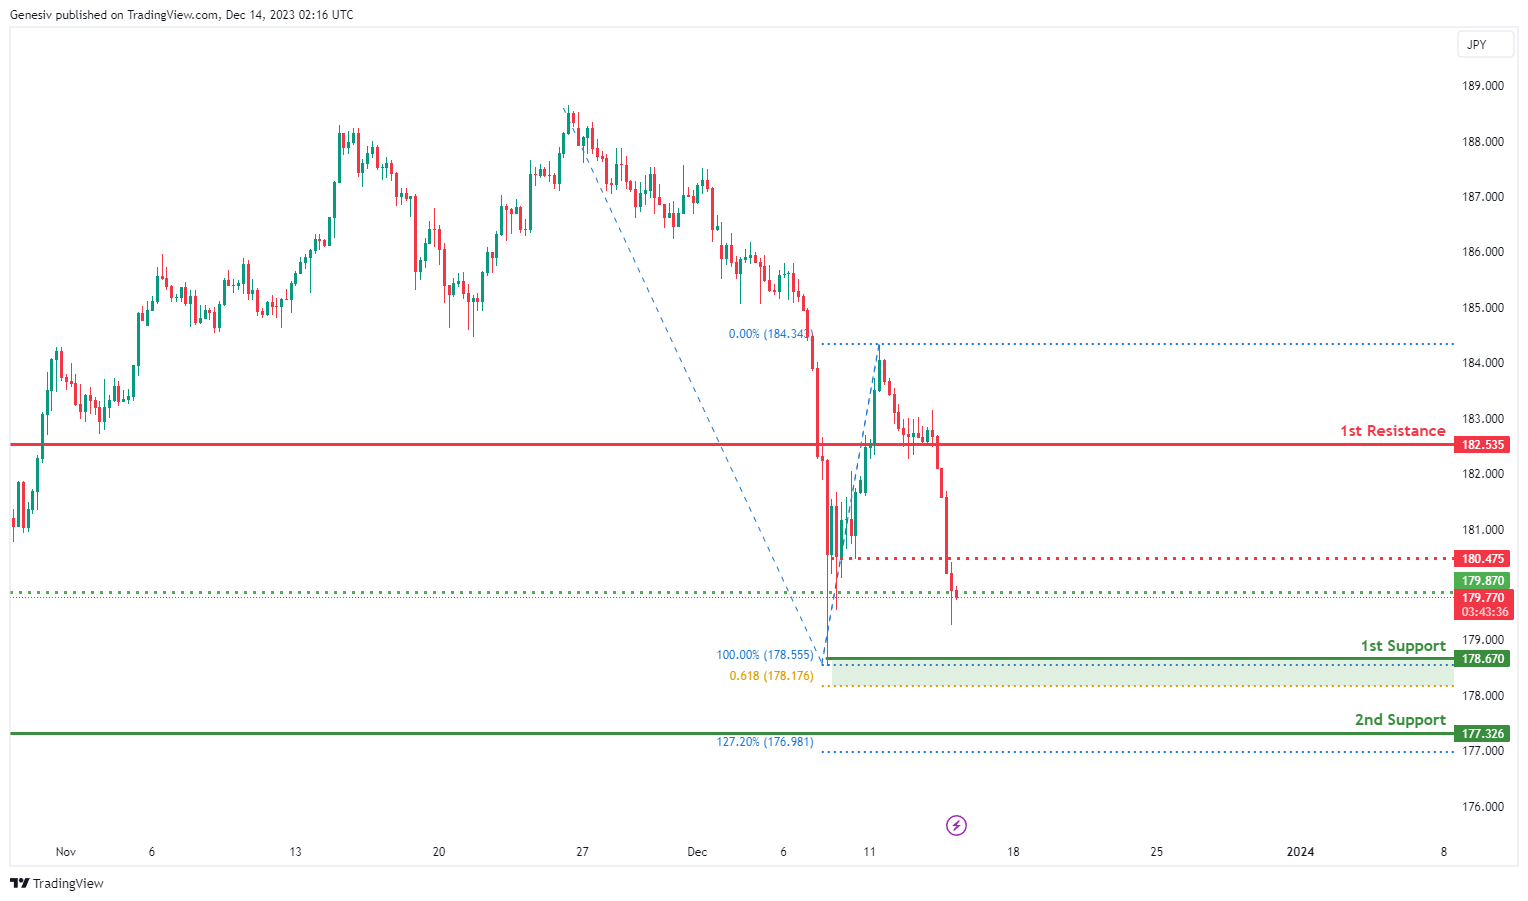
GBP/JPY:
The GBP/JPY chart currently indicates a bearish overall momentum, and there is a potential for a bearish continuation towards the 1st support.
The 1st support at 178.67 is considered significant for several reasons. Firstly, it is identified as a pullback support, suggesting a potential area where buying interest may emerge after a pullback, providing support for the currency pair. Additionally, this support level aligns with both the 100% Fibonacci Retracement and the 61.80% Fibonacci Projection, further reinforcing its importance as a potential reversal or bounce point.
Similarly, the 2nd support at 177.33 is characterized as a pullback support. This level adds to the support structure, indicating another potential zone where buying interest may be present, further supporting the potential for a bearish continuation.
On the resistance side, the intermediate resistance at 180.48 is identified as a pullback resistance. This level may act as a barrier where selling interest could intensify, potentially causing a temporary pause or reversal in the bearish trend.
Furthermore, the 1st resistance at 182.54 is associated with both a pullback resistance and an additional factor. This adds extra significance to the resistance, suggesting a potential area where selling pressure may increase, especially considering the presence of both pullback resistance and another technical factor.
Additionally, there is an intermediate support at 179.87 identified as a pullback support. This level may act as an interim support, providing a potential area for buyers before the price continues its bearish trend.
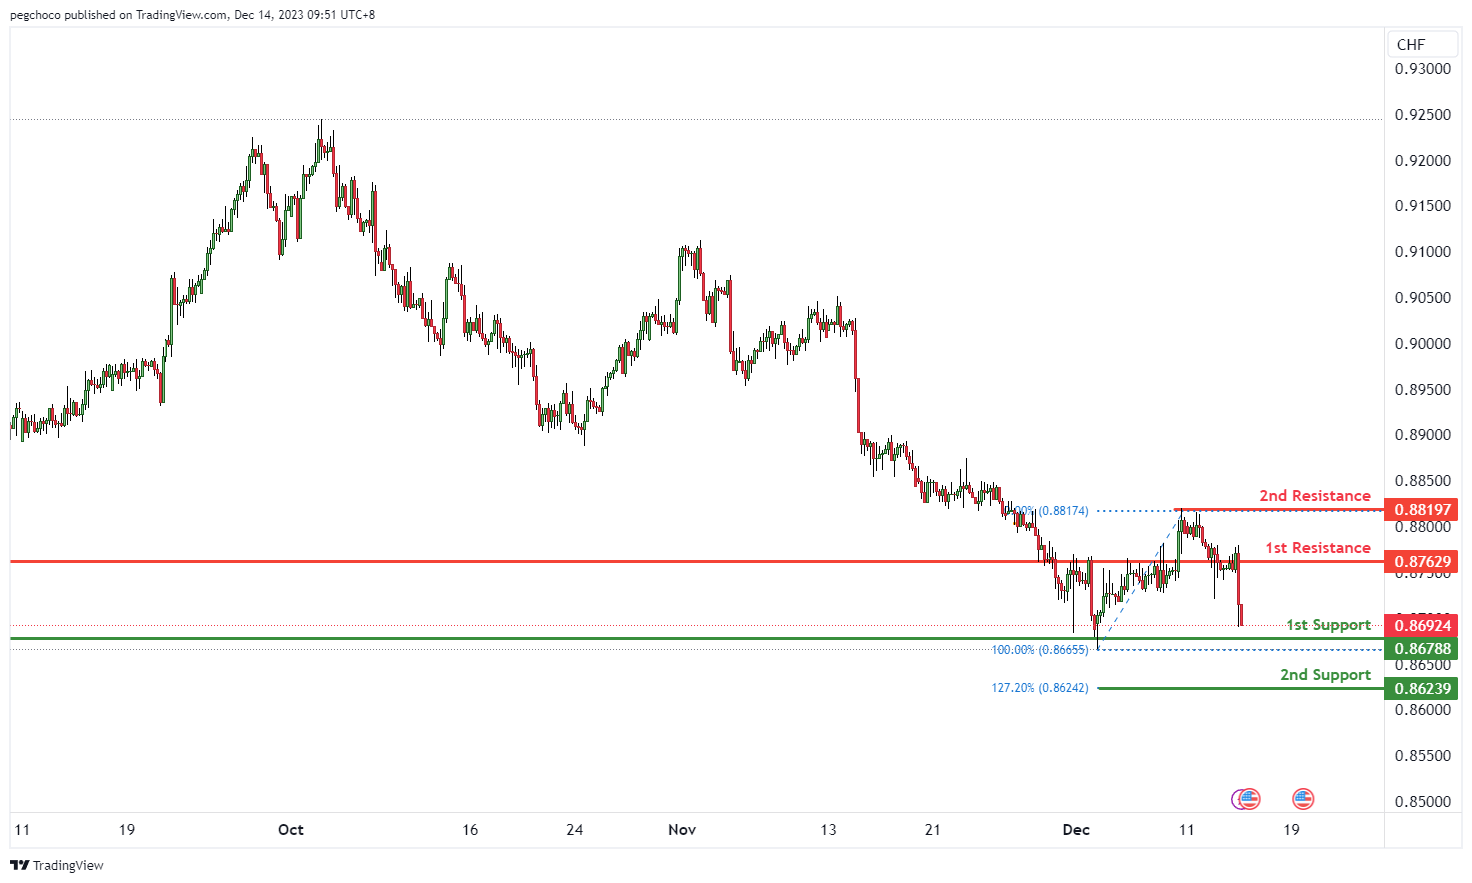
USD/CHF:
The USD/CHF chart currently exhibits a bearish overall momentum, indicating a downtrend in the US Dollar against the Swiss Franc. Price could potentially continue this bearish movement towards the 1st support level.
The 1st support at 0.8678 is identified as a pullback support, suggesting that it has historical significance as a level where buying interest has emerged temporarily. This support level could serve as a potential target for bearish traders.
The 2nd support at 0.8623 is noteworthy as it coincides with the 127.20% Fibonacci Extension level, indicating potential support based on Fibonacci analysis.
On the resistance side, the 1st resistance at 0.8762 is considered a pullback resistance, suggesting that it has historically acted as a significant barrier where selling interest intensified. This level is a key point to watch for potential price reactions.
The 2nd resistance at 0.8817 is identified as a multi-swing high resistance, indicating that it has historical significance as a level where selling pressure increased.
USD/JPY:
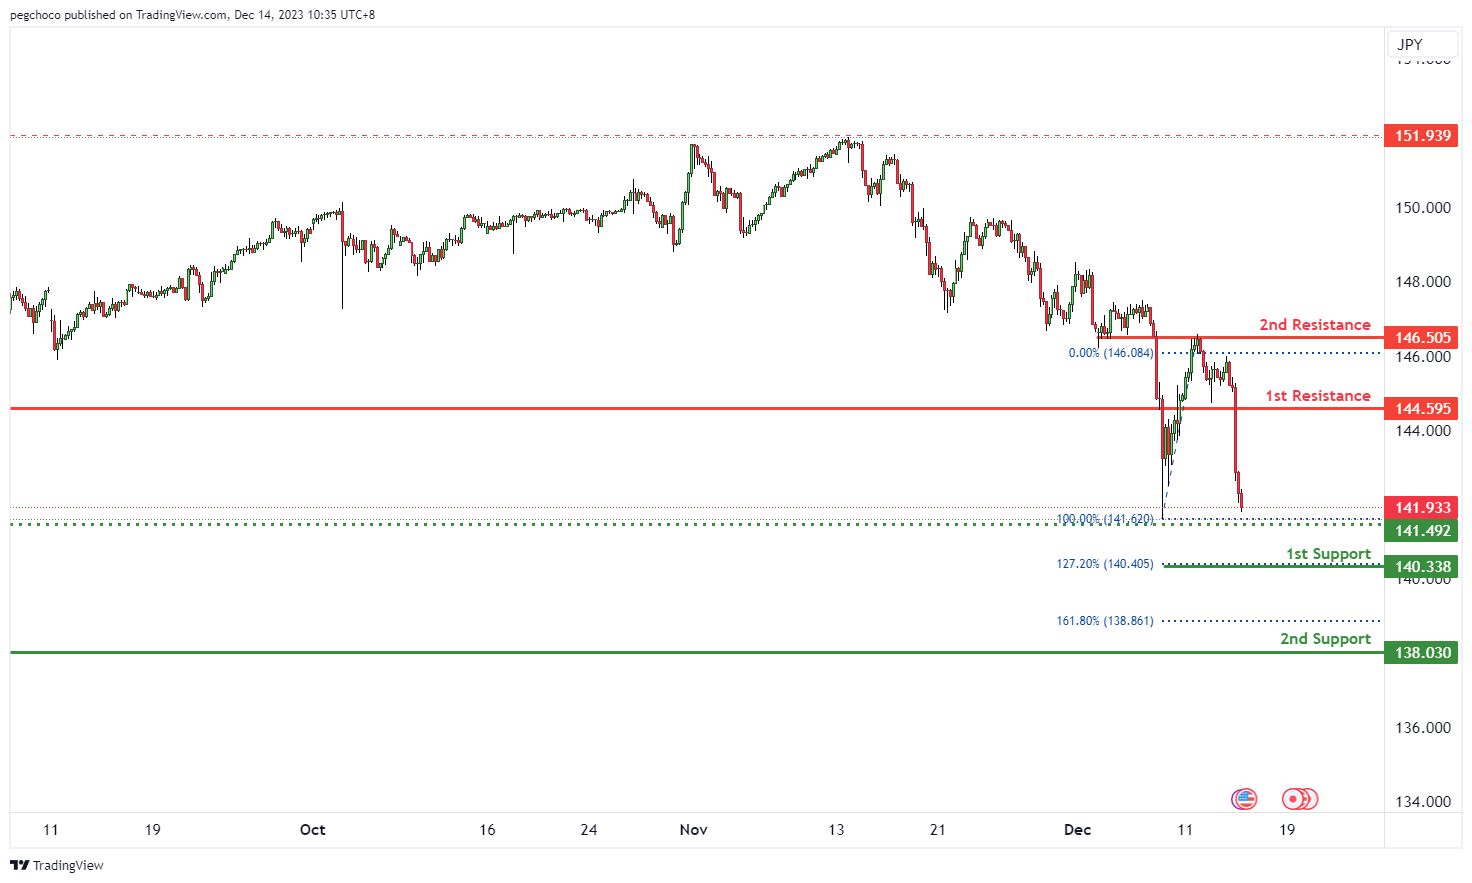
The USD/JPY chart currently exhibits a bearish overall momentum, indicating a downtrend in the US Dollar against the Japanese Yen. Price could potentially continue this bearish movement towards the 1st support level.
The 1st support at 140.33 is identified as a significant level based on the 127.20% Fibonacci Extension, suggesting potential support at this level.
The 2nd support at 138.83 is notable as it coincides with multi-swing low support, indicating historical significance as a level where buying interest has previously emerged.
On the resistance side, the 1st resistance at 144.59 is considered a pullback resistance, suggesting that it has historically acted as a substantial barrier where selling interest intensified. This level is a key point to watch for potential price reactions.
The 2nd resistance at 146.50 is identified as an overlap resistance, indicating that it has historical significance as a level where selling pressure increased.
USD/CAD:
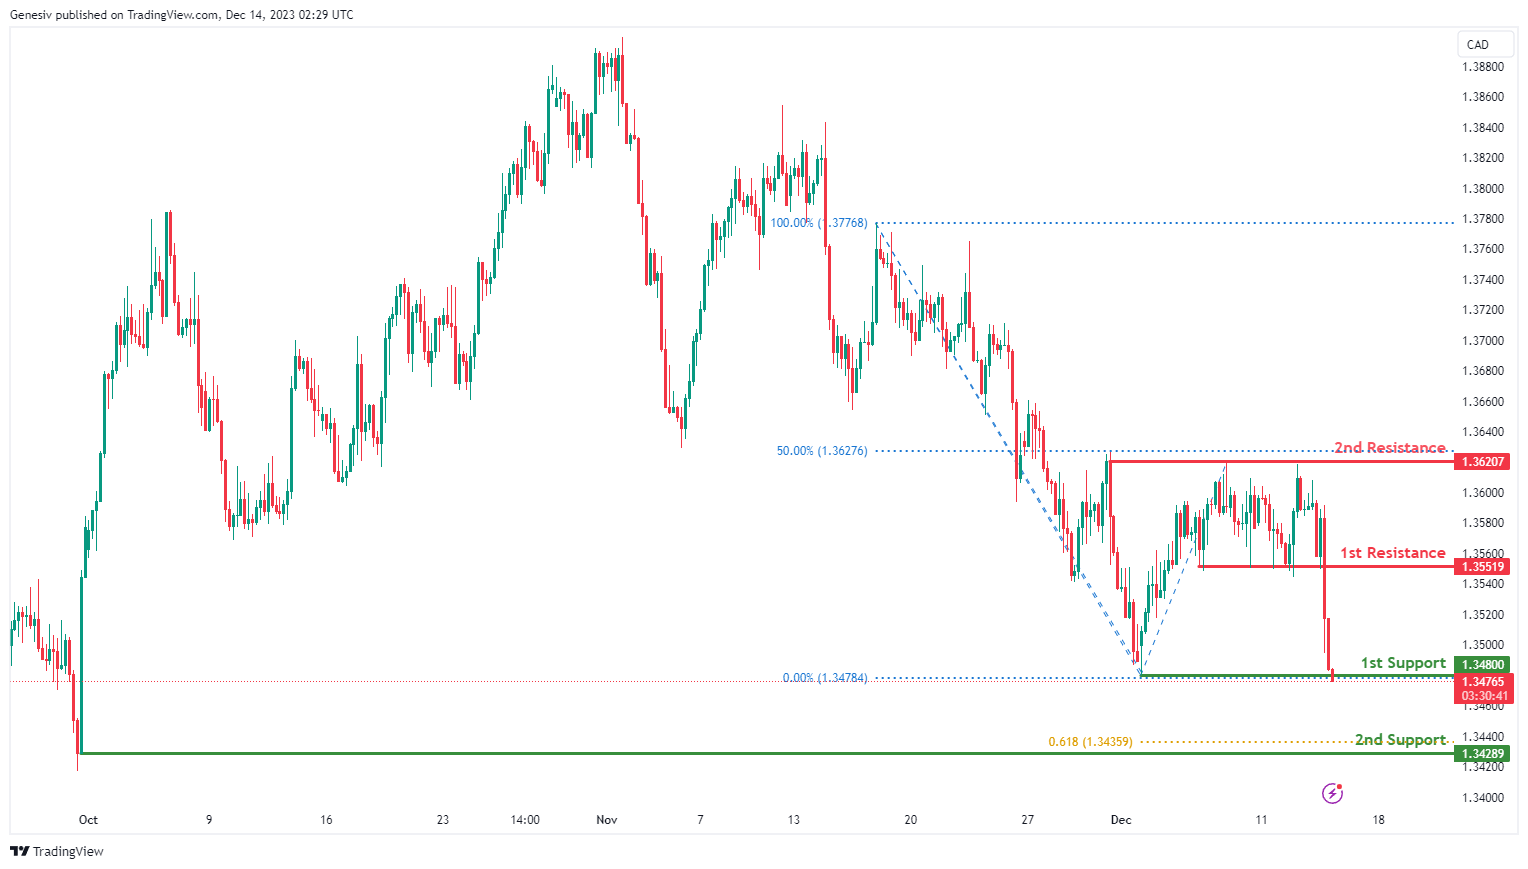
The USD/CAD chart currently exhibits an overall bearish momentum, indicating a new downward trend. In this context, there is a potential scenario for price to break under the 1st support and make a bearish continuation towards the 2nd support.
The 1st support level at 1.3480 is identified as a swing-low support. Further below, the 2nd support level at 1.3428 is also marked as a swing-low support that aligns with the 61.80% Fibonacci projection level, further reinforcing its importance as a key support level.
To the upside, the 1st resistance level at 1.3551 is identified as a pullback resistance while the 2nd resistance level at 1.3620 is also noted as a pullback resistance, suggesting a potential barrier for further upside movement.
AUD/USD:
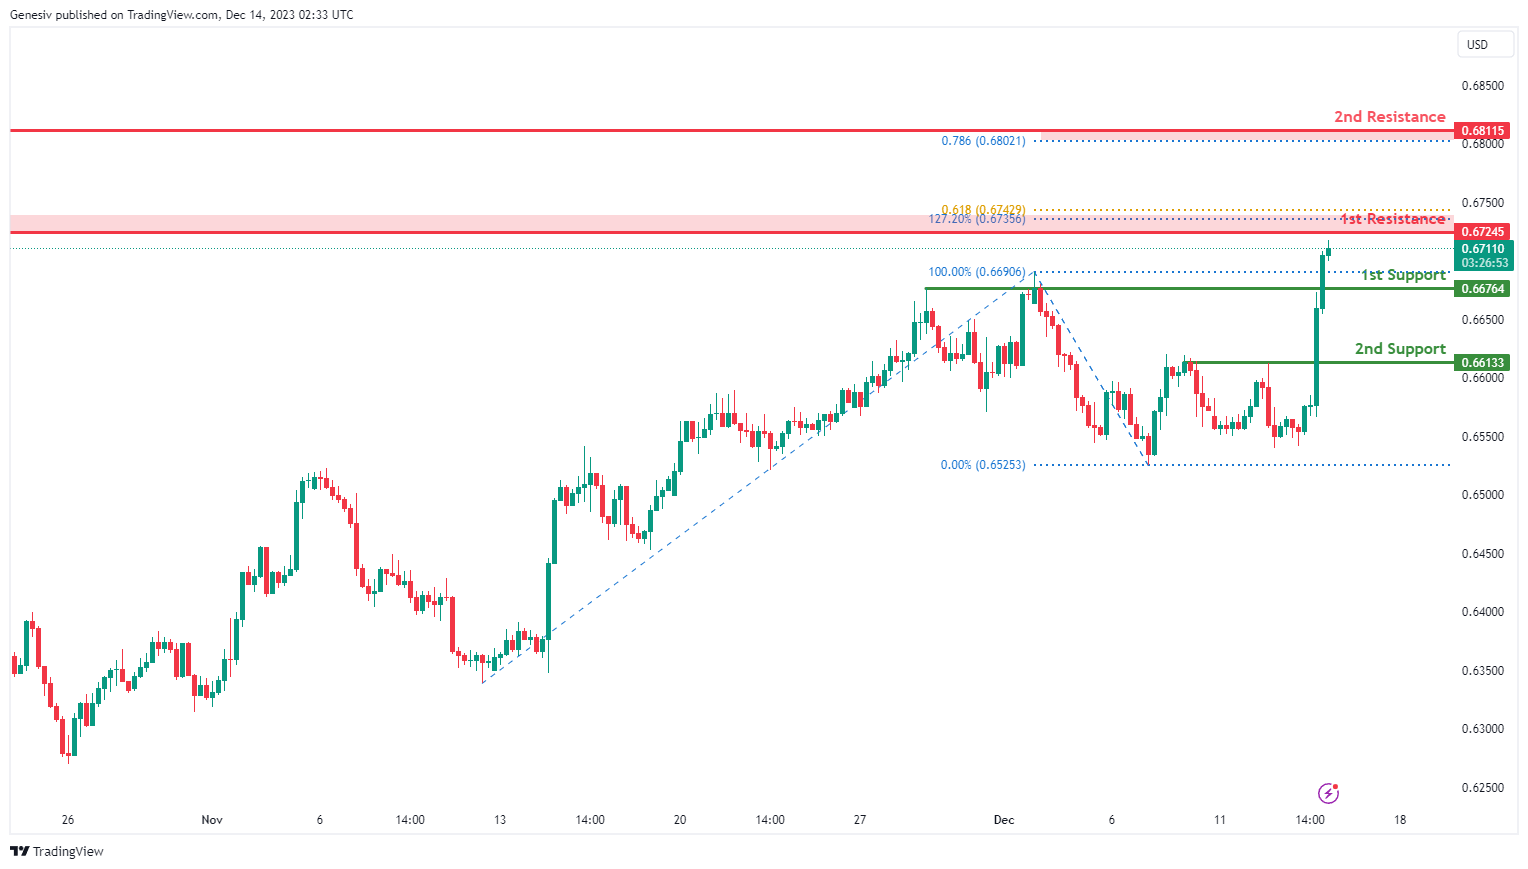
The AUD/USD chart currently exhibits an overall bullish momentum, indicating a new upward trend. In this context, there is a potential scenario for price to make a bullish continuation towards the 1st resistance.
The 1st resistance level at 0.6724 is identified as a swing-high resistance that aligns with a confluence of Fibonacci levels i.e. the 127.20% extension and the 61.80% projection levels. Higher up, the 2nd resistance level at 0.6811 is also marked as a swing-high resistance that aligns with the 78.60% Fibonacci projection level, indicating its potential significance as a barrier for further upward movement.
To the downside, the 1st support level at 0.6676 is identified as a pullback support while the 2nd support level at 0.6613 is also noted as a pullback support, further reinforcing its importance as a key support level.
NZD/USD
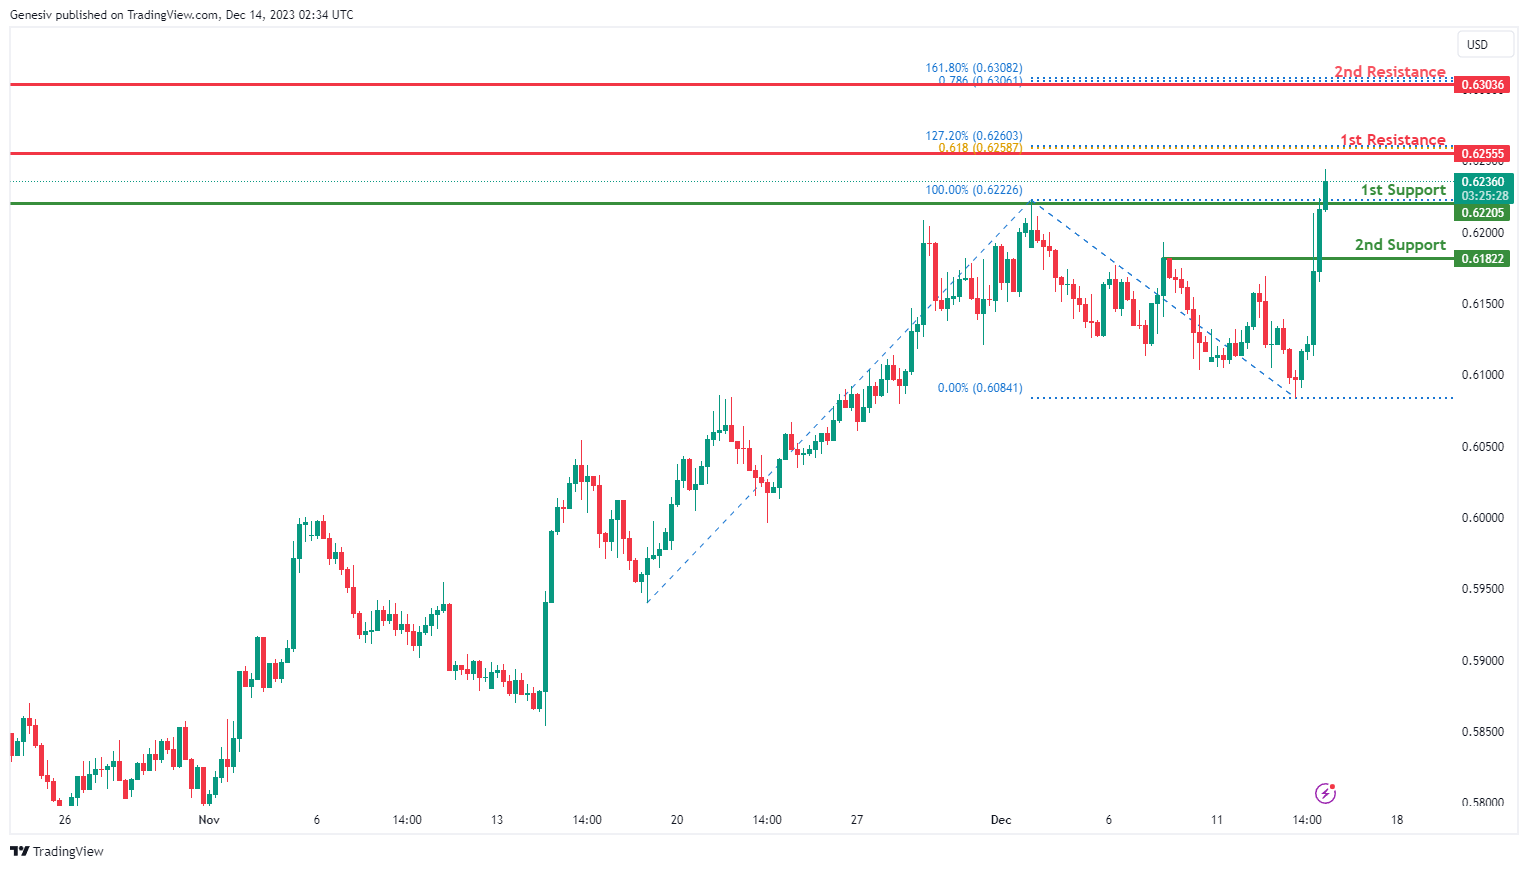
The NZD/USD chart currently exhibits an overall bullish momentum, indicating a new upward trend. In this context, there is a potential scenario for price to make a bullish continuation towards the 1st resistance.
The 1st resistance level at 0.6255 is identified as a swing-high resistance that aligns with a confluence of Fibonacci levels i.e. the 127.20% extension and the 61.80% projection levels. Higher up, the 2nd resistance level at 0.6303 is also marked as a swing-high resistance that aligns with a confluence of Fibonacci levels i.e. the 161.80% extension and the 78.60% projection levels, indicating its potential significance as a barrier for further upward movement.
To the downside, the 1st support level at 0.6220 is identified as a pullback support while the 2nd support level at 0.6182 is also noted as a pullback support, further reinforcing its importance as a key support level.
DJ30:
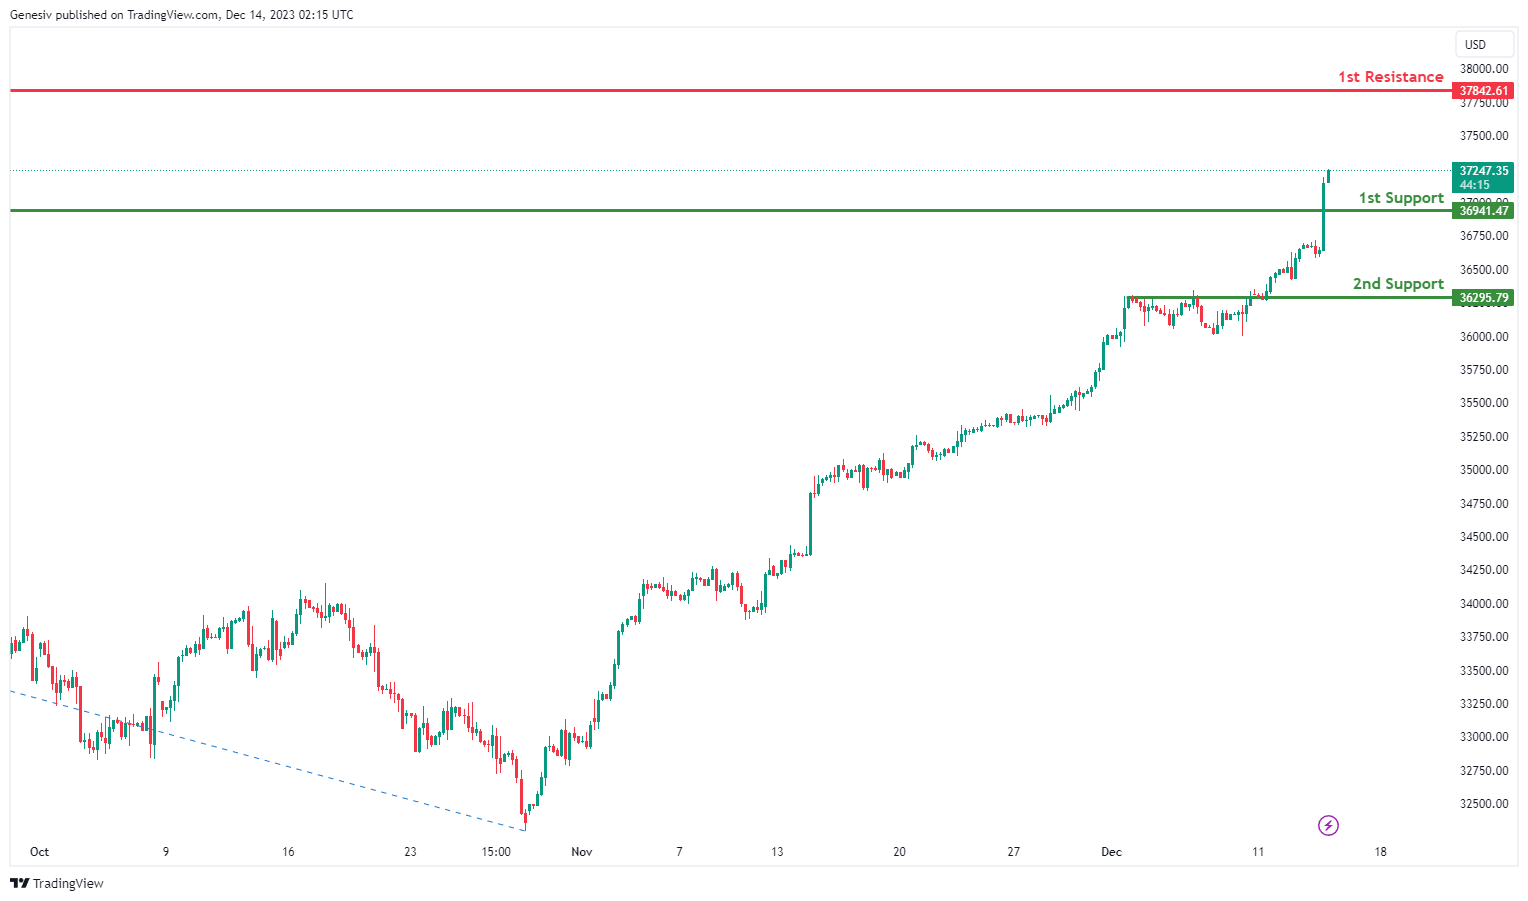
The DJ30 chart currently suggests a bullish overall momentum, indicating a potential for a bullish continuation towards the 1st resistance.
The 1st support at 36941.47 is considered significant as it represents a pullback support. This level indicates a potential area where buying interest may emerge after a pullback, providing support for the index and potentially leading to a continuation of the bullish trend.
Similarly, the 2nd support at 36295.79 is identified as an overlap support. This suggests a convergence of historical price points, reinforcing its potential as a crucial area where buying interest may emerge, providing additional support for the potential bullish continuation.
On the resistance side, the 1st resistance at 37842.61 is associated with a swing high resistance. This level is likely to act as a barrier where selling interest could intensify, potentially causing a temporary pause or reversal in the bullish trend.
GER40:
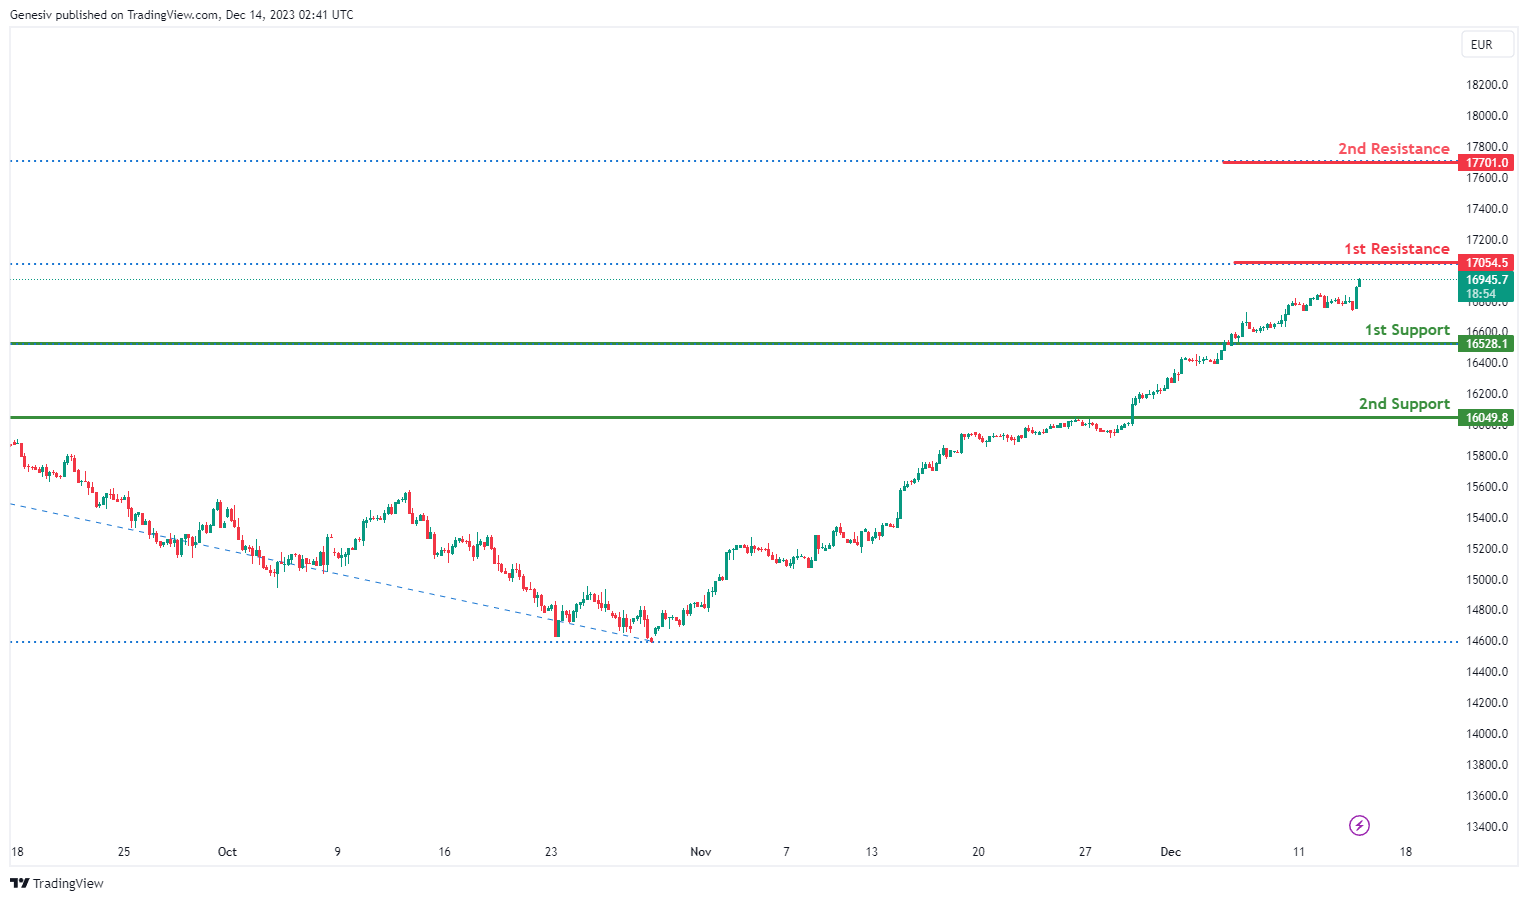
The GER40 chart currently exhibits a bullish overall momentum, and there is potential for a bullish continuation towards the 1st resistance.
The 1st support at 16528.10 is considered significant as it represents a pullback support. This level indicates a potential area where buying interest may emerge after a pullback, providing support for the index and contributing to the potential for a bullish continuation.
Similarly, the 2nd support at 16049.80 is also identified as a pullback support. This adds an additional layer of support, indicating another potential zone where buying interest may be present, further reinforcing the potential for a bullish continuation.
On the resistance side, the 1st resistance at 17054.00 is associated with the 127.20% Fibonacci Extension. This level adds significance to the resistance, suggesting a potential area where selling interest may intensify, potentially causing a temporary pause or reversal in the bullish trend.
Furthermore, the 2nd resistance at 17701.00 is linked to the 161.80% Fibonacci Extension. This adds another layer of significance to the resistance, indicating another potential area where selling pressure may increase, especially considering the alignment with the Fibonacci-based extension levels.
US500:
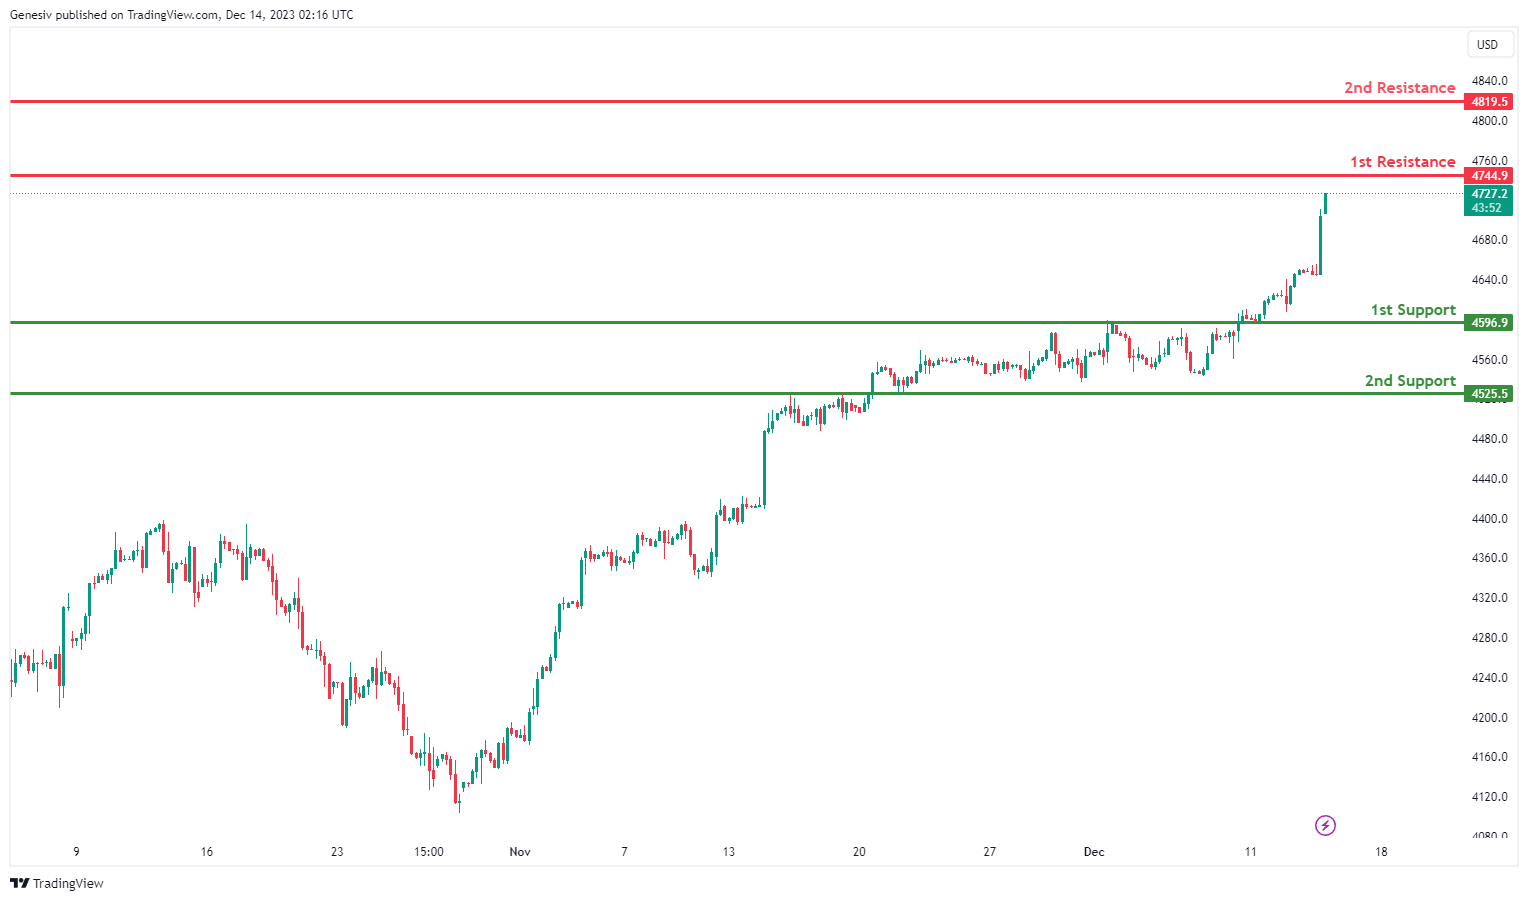
The US500 chart currently indicates a bullish overall momentum, suggesting a potential for a bullish continuation towards the 1st resistance.
The 1st support at 4596.9 is considered significant as it represents an overlap support. This level suggests a convergence of historical price points, reinforcing its potential as a crucial area where buying interest may emerge. This overlap support provides a strong foundation for a potential bounce or continuation of the bullish trend.
Similarly, the 2nd support at 5425.5 is identified as an overlap support. This adds an additional layer of significance to the support level, indicating a zone where historical price action aligns, and buyers may find significant interest.
On the resistance side, the 1st resistance at 4744.9 is associated with a pullback resistance. This level may act as a barrier where selling interest could intensify, potentially causing a temporary pause or reversal in the bullish trend.
Furthermore, the 2nd resistance at 4819.5 is characterized as a swing high resistance. This level adds further significance to the resistance, suggesting a potential area where selling pressure may increase, especially considering its alignment with a previous swing high.
BTC/USD:
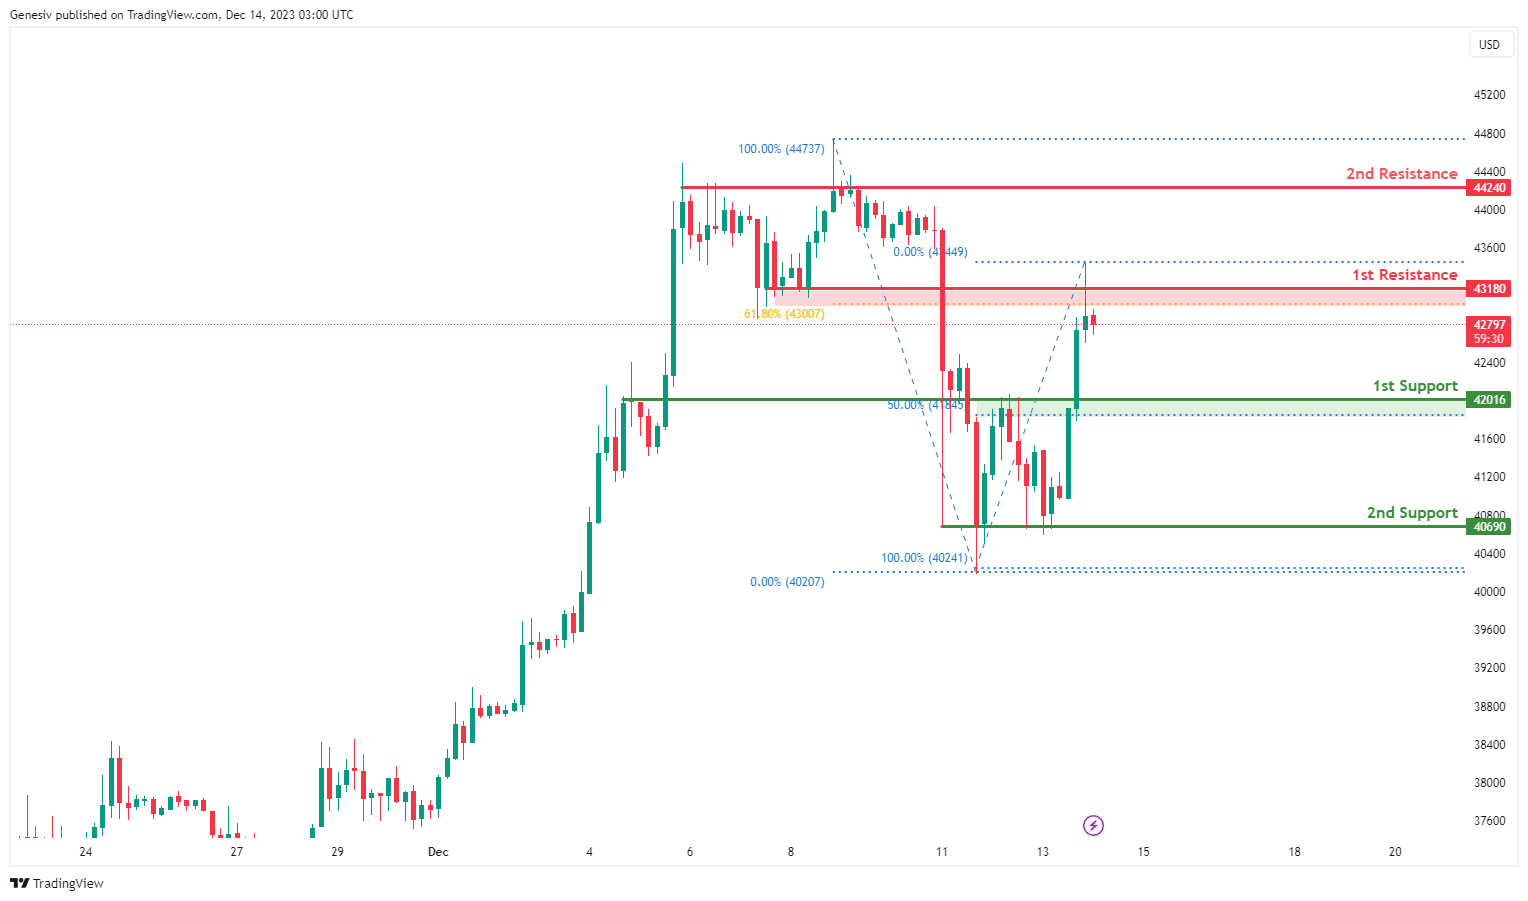
The BTC/USD chart currently indicates a neutral overall momentum, suggesting a potential scenario where the price may fluctuate between the 1st resistance and the 1st support level.
The 1st support at 42016 is considered significant for several reasons. Firstly, it is identified as an overlap support, suggesting a convergence of historical price points and reinforcing its potential as a crucial area where buying interest may emerge. Additionally, this support level aligns with the 50% Fibonacci Retracement, further enhancing its importance as a potential reversal or bounce point.
Similarly, the 2nd support at 40690 is characterized as a multi-swing low support. This adds to the support structure, indicating another potential zone where buying interest may be present, further supporting the potential for price fluctuation.
On the resistance side, the 1st resistance at 43180 is associated with both a pullback resistance and the 61.80% Fibonacci Retracement. This confluence adds weight to the resistance, suggesting a potential area where selling interest may intensify, causing a temporary pause or reversal in the neutral trend.
Furthermore, the 2nd resistance at 44240 is identified as a pullback resistance. This level may act as a barrier where selling interest could intensify, contributing to the potential price fluctuation within the established range.
ETH/USD:
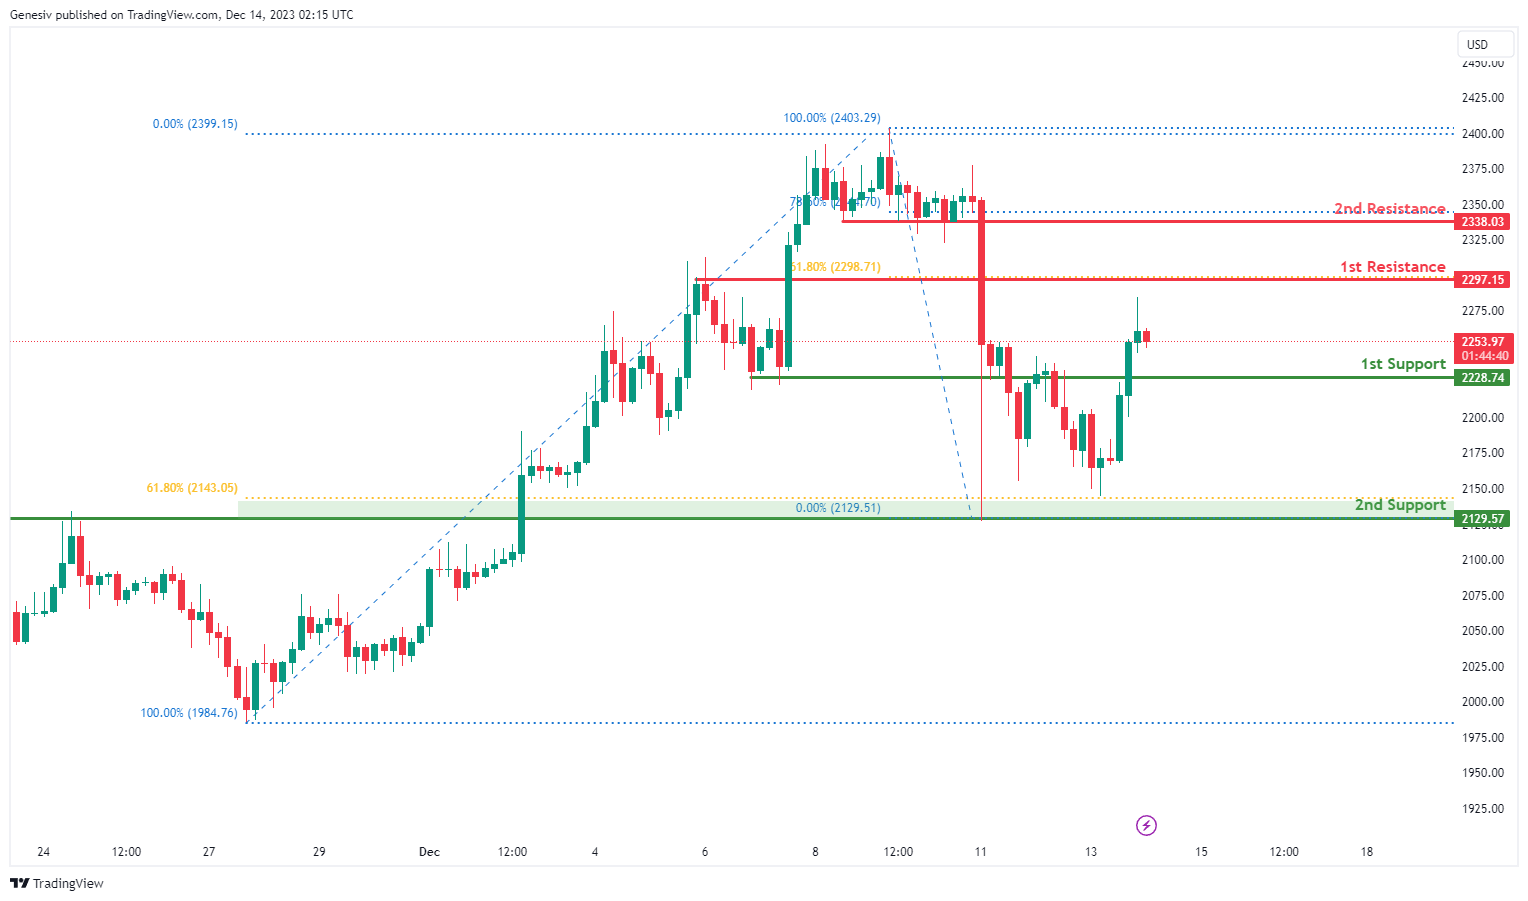
The ETH/USD chart currently indicates a bullish overall momentum, suggesting a potential for a bullish continuation towards the 1st resistance.
The 1st support at 2228.74 is considered significant as it represents an overlap support. This level indicates a convergence of historical price points, reinforcing its potential as a crucial area where buying interest may emerge. The overlap support provides a strong foundation for a potential bounce or continuation of the bullish trend.
Similarly, the 2nd support at 2129.57 is characterized as an overlap support and is associated with the 61.80% Fibonacci Retracement. This confluence strengthens the support level, indicating a zone where historical price action aligns and buyers may find significant interest, further supporting the potential for a bullish continuation.
On the resistance side, the 1st resistance at 2297.15 is identified as both a swing high resistance and the 61.80% Fibonacci Retracement. This confluence adds significance to the resistance, suggesting a potential area where selling interest may intensify, causing a temporary pause or reversal in the bullish trend.
Furthermore, the 2nd resistance at 2338.03 is associated with both swing high resistance and the 78.60% Fibonacci Retracement. This further strengthens the resistance, indicating another potential area where selling pressure may increase, especially considering the alignment with both technical and Fibonacci-based resistance.
WTI/USD:
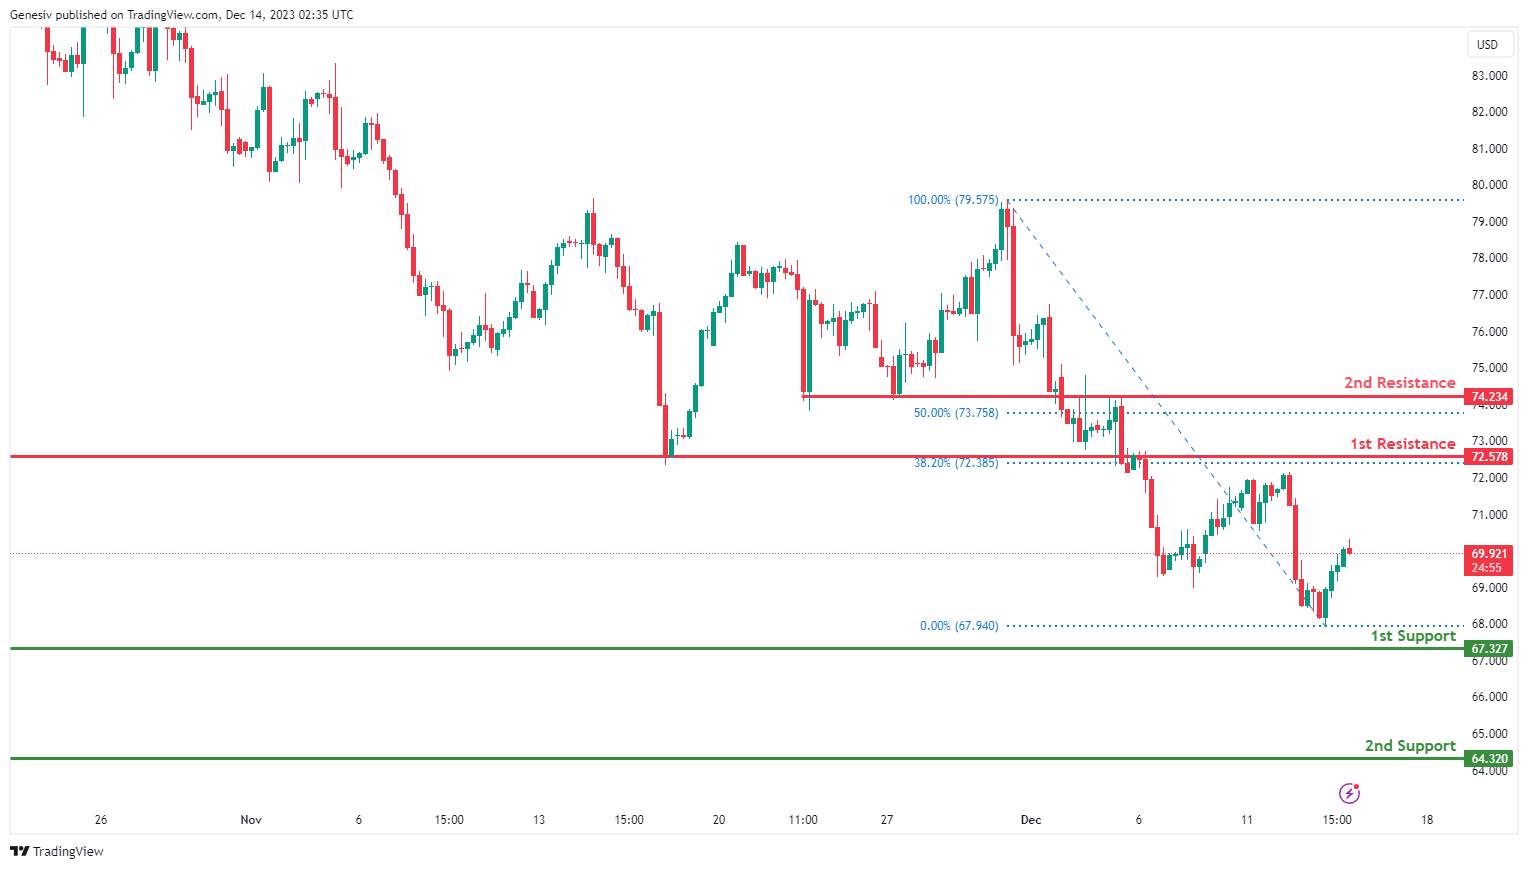
The WTI chart currently exhibits an overall bearish momentum, suggesting a prevailing downward trend. However, there is a potential for price to make a bullish movement towards the 1st resistance before resuming the downtrend and fall towards the 1st support.
The 1st resistance level at 72.57 is identified as an overlap resistance that aligns with the 38.20% Fibonacci retracement level. Higher up, the 2nd resistance level at 74.23 is also marked as an overlap resistance that aligns close to the 50.00% Fibonacci retracement level, further indicating its potential significance as a barrier for further upward movement.
To the downside, the 1st support level at 67.32 is identified as a pullback support. Further below, the 2nd support level at 64.32 is noted as multi-swing-low support, reinforcing its importance as a key support level.
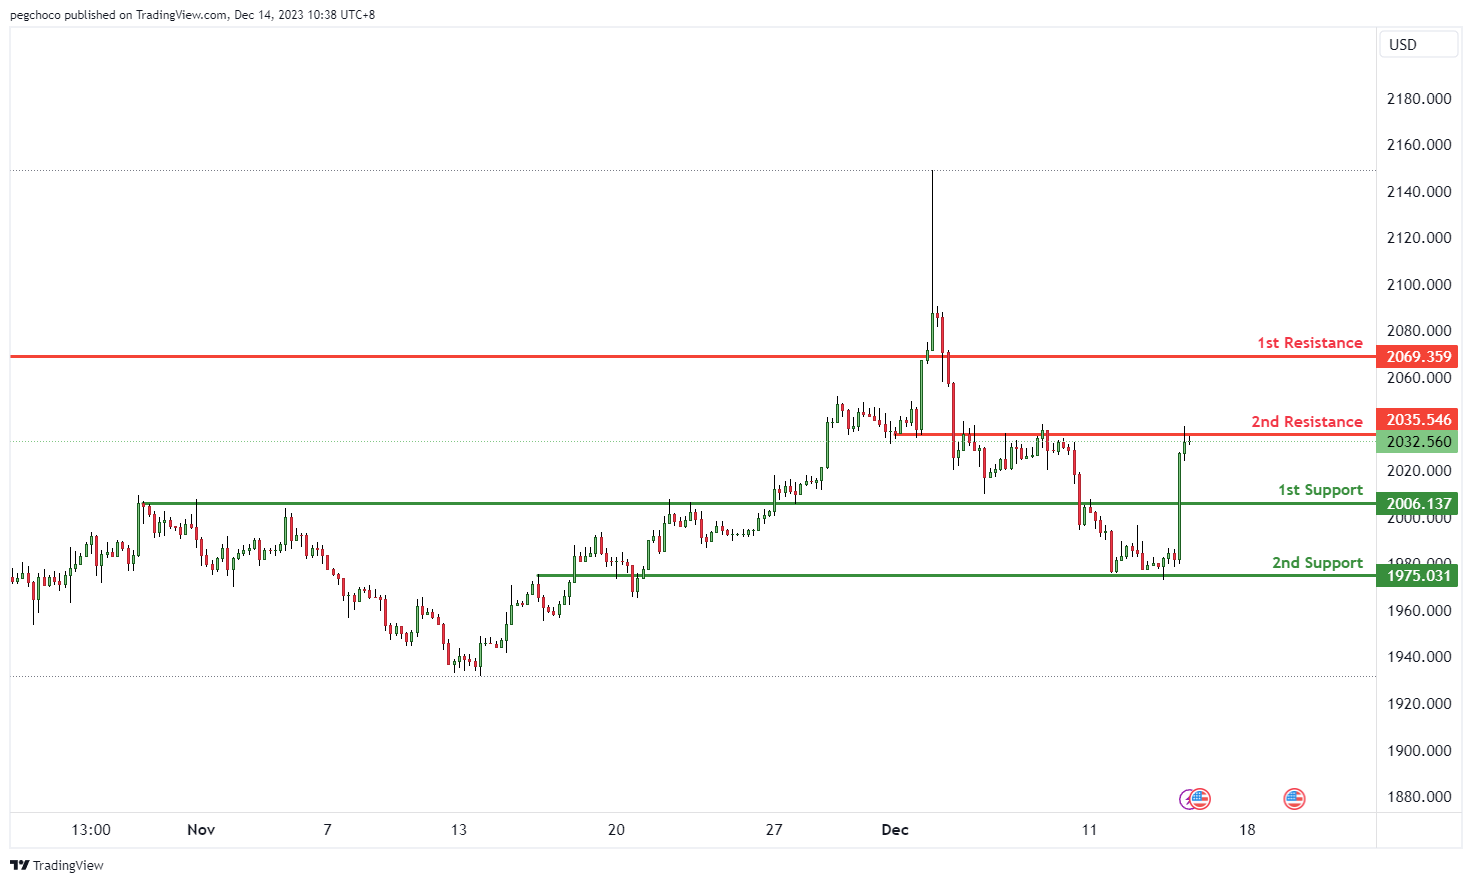
XAU/USD (GOLD):
The XAU/USD chart currently demonstrates a bearish overall momentum, indicating a downward trend in the price of gold against the US Dollar. Price could potentially continue this bearish movement towards the 1st support level.
The 1st support at 2006.13 is identified as a significant level, categorized as pullback support. This suggests that it has the potential to act as a level where buying interest may emerge temporarily, providing support for the price of gold.
The 2nd support at 1975.03 is also noteworthy as it is an overlap support. Overlap supports typically indicate areas where historical price action has found support, making this level another potential area for buying interest.
On the resistance side, the 1st resistance at 2035.54 is categorized as an overlap resistance, indicating historical significance as a level where selling pressure may intensify. This level should be closely monitored for potential price reactions.
The 2nd resistance at 2069.35 is identified as a pullback resistance, suggesting it may act as a barrier where selling interest could increase.