Silver Price Forecast: $70.70 in Sight After $68.98 Breakout Shakes Bears

Silver prices are ending the week on firm footing, with XAG/USD trading near $68.98 after decisively breaking above a long-watched…


Register now to be able to add articles to your reading list.

” aria-hidden=”true”>

Quick overview

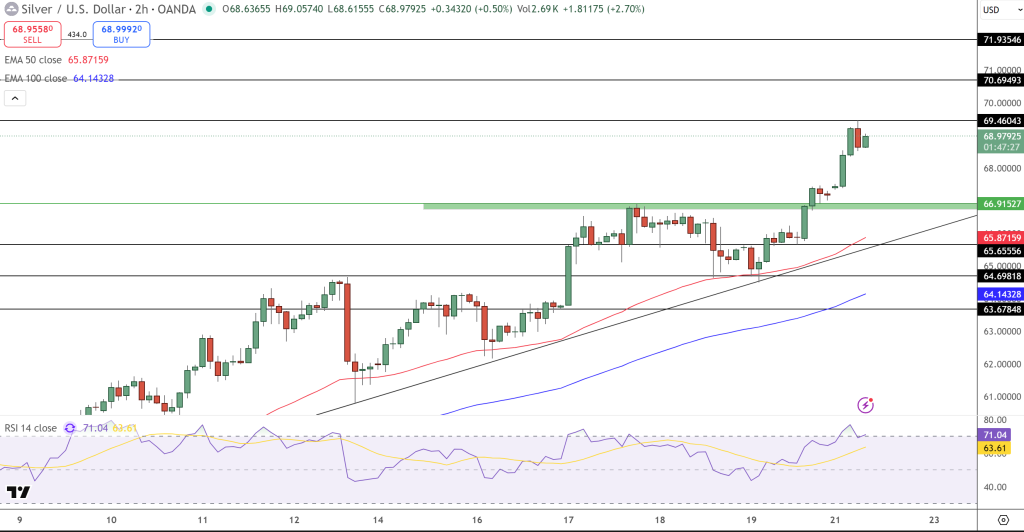
  • Silver prices are showing strong momentum, trading near $68.98 after breaking above a key resistance zone.
  • The breakout above the $66.90–$67.00 area has shifted sentiment positively, turning former resistance into support.
  • Technical indicators, including candlestick patterns and moving averages, confirm the bullish trend, with key support levels at $67.00 and $65.80.
  • Traders are targeting higher levels at $69.45 and $70.70, with pullbacks expected to be corrective rather than trend-reversing.

Silver prices are ending the week on firm footing, with XAG/USD trading near $68.98 after decisively breaking above a long-watched resistance band. The move has shifted short-term sentiment and put fresh upside levels back on traders’ radar as momentum builds into the new week.

Silver Breaks Key Resistance Zone

The breakout above the $66.90–$67.00 area marks an important technical development. That zone capped price action multiple times earlier this month, but once cleared, buyers stepped in with conviction. What matters now is that former resistance has turned into support, a classic sign of trend continuation rather than a one-off spike.

Silver remains comfortably inside a rising price channel that’s been intact since early December. Higher highs and higher lows continue to define the structure, keeping the broader bias tilted to the upside.

Candlesticks and EMAs Confirm Momentum

Candlestick behaviour reinforces the bullish case. The initial breakout candle showed a wide bullish body, followed by smaller consolidation candles near the highs. That pattern often reflects absorption of supply rather than aggressive profit-taking.

From a trend-following perspective, silver is holding well above its key moving averages:

  • 50-EMA near $65.87, acting as dynamic support
  • 100-EMA around $64.14, anchoring the broader trend

As long as price remains above these levels, pullbacks are likely to be corrective rather than trend-breaking.

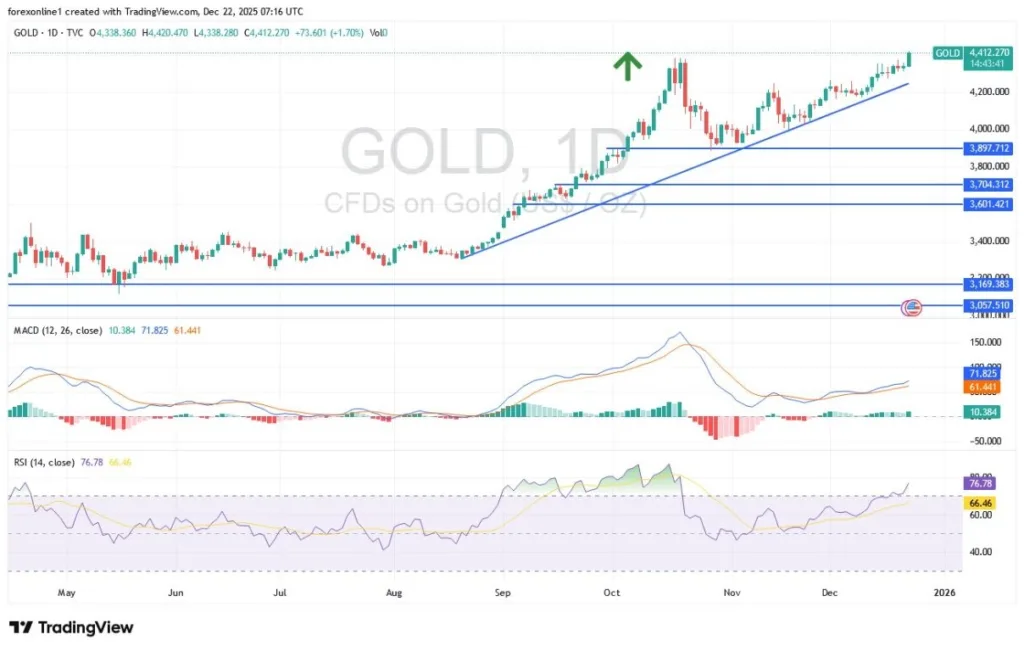
Fibonacci Levels and RSI Outlook

Fibonacci extensions drawn from the latest pullback show that silver has already tagged the $68.15 level. The next technical objectives sit at $69.45, followed by $70.70, which also aligns with a psychological round number.

Momentum indicators remain supportive. The RSI near 71 reflects strong buying pressure, though it also suggests short-term cooling phases are possible. Importantly, there’s no bearish divergence yet, meaning momentum hasn’t rolled over.

Silver Price Chart - Source: Tradingview
Silver Price Chart – Source: Tradingview

What Traders Are Watching Next

Going into the week ahead, silver’s outlook hinges on whether buyers defend the newly formed support zone.

Key levels to watch:

  • Support: $67.00, then $65.80
  • Resistance: $69.45 and $70.70

Trade setup: Buy pullbacks toward $67.00, targeting $69.45–$70.70, with invalidation below $65.80.

With structure intact and momentum still favoring the upside, silver’s latest breakout looks more like a continuation move than a short-lived surge.

Arslan Butt

Lead Markets Analyst – Multi-Asset (FX, Commodities, Crypto)

Arslan Butt serves as the Lead Commodities and Indices Analyst, bringing a wealth of expertise to the field. With an MBA in Behavioral Finance and active progress towards a Ph.D., Arslan possesses a deep understanding of market dynamics.

His professional journey includes a significant role as a senior analyst at a leading brokerage firm, complementing his extensive experience as a market analyst and day trader. Adept in educating others, Arslan has a commendable track record as an instructor and public speaker.

His incisive analyses, particularly within the realms of cryptocurrency and forex markets, are showcased across esteemed financial publications such as ForexCrunch, InsideBitcoins, and EconomyWatch, solidifying his reputation in the financial community.

Related Articles


Source link

Visited 1 times, 1 visit(s) today

Related Article

GBP/USD Forex Signal 22/12: Neutral Outlook (Chart)

GBP/USD Forex Signal 22/12: Neutral Outlook (Chart)

Created on December 22, 2025 Bullish view Buy the GBP/USD pair and set a take-profit at 1.3600. Add a stop-loss at 1.3250. Timeline: 1-2 days. Bearish view Sell the GBP/USD pair and set a take-profit at 1.3250. Add a stop-loss at 1.3600. The GBP/USD exchange rate remained in a tight range after the US published

EUR/USD Daily Outlook - ActionForex

EUR/USD Daily Outlook – ActionForex

Daily Pivots: (S1) 1.1695; (P) 1.1717; (R1) 1.1730; More…. Intraday bias in EUR/USD stays neutral as range trading continues below 1.1803. . On the upside, break of 1.1803 will extend the rally from 1.1467 to retest 1.1917 high. However, firm break of 55 D EMA (now at 1.1640) will turn bias back to the downside

USD/ZAR Analysis 22/12: Market Sentiment (Chart)

USD/ZAR Analysis 22/12: Market Sentiment (Chart)

Created on December 22, 2025 The USD/ZAR is near the 16.72100 vicinity as of this writing early on Monday as trading volumes start to suffer from a lack of full market participation because of the upcoming holiday season. The bearish trend of the USD/ZAR remains an intriguing speculative wager. The currency pair is around the

EUR/USD Analysis 22/12: Attempts New Year Rebound (Chart)

Attempts New Year Rebound (Chart)

Created on December 22, 2025 EUR/USD Analysis Summary Today Overall Trend: Still in an upward trend. Support Levels for EUR/USD Today: 1.1680 – 1.1600 – 1.1550 Resistance Levels for EUR/USD Today: : 1.1770 – 1.1830 – 1.1900 EUR/USD Trading Signals: Buy EUR/USD from the support level of 1.1630 with a target of 1.1820 and a

Gold Analysis 22/12: Attempts to Break Highs (Chart)

Attempts to Break Highs (Chart)

Created on December 22, 2025 Today’s Gold Analysis Overview: The overall of Gold Trend: Strongly bullish. Today’s Gold Support Points: $4300 – $4260 – $4170 per ounce Today’s Gold Resistance Points: $4370 – $4390 – $4460 per ounce Today’s Gold Trading Signals: Sell gold from the resistance level of $4400 with a target of $4200

Dollar Mirrors Market Doubt, Sterling Saved, Yen Sinks

Dollar Mirrors Market Doubt, Sterling Saved, Yen Sinks

The past week delivered no shortage of surprises, yet markets ended it with remarkably little conviction. Key macro data and central bank decisions challenged prevailing assumptions, but follow-through across major assets proved elusive. US economic releases hinted at a faster cooling in both employment and inflation. Under normal circumstances, that combination would have fueled enthusiasm

USD to drop against the Chinese Yuan

Dollar to Weaken Against the Chinese Yuan

According to Ray Dalio’s “Principles for Dealing with the Changing World Order”, a book we encourage you to read, the US is an empire in decline. His theory is that China is going to become the dominant economy in the world and the Chinese yuan is eventually going to become the global reserve currency, dethroning

EUR/USD Weekly Forecast 21/12: Incremental Selling (Chart)

EUR/USD Weekly Forecast 21/12: Incremental Selling (Chart)

Created on December 21, 2025 After another surge higher early this week on Tuesday and a move above the 1.18030 vicinity, the EUR/USD began to seeing selling emerge. By Wednesday of this week, before central bank announcements from the BoE and ECB on Thursday, which delivered anticipated news, the EUR/USD sank to nearly 1.17030. And

Weekly Forex Forecast - 21th to 26th December 2025 (Charts)

Weekly Forex Forecast – 21th to 26th December 2025 (Charts)

I wrote on the 14th December that the best trades for the week would be: Long of the S&P 500 Index following a daily close above 6,920. This did not set up. Long of Silver with half the normal position size following a daily close above $63.57. This set up on Wednesday, and a gave

Crude Oil Weekly Forecast 21/12: Prices Stay Low? (Chart)

Crude Oil Weekly Forecast 21/12: Prices Stay Low? (Chart)

By Robert Petrucci Reviewer 24bulls Created on December 21, 2025 Day traders will not only be confronted by the belief that WTI Crude Oil is trading long-term lows and the consideration that the commodity may remain within lower tides, but also the knowledge that full fledged holiday trading will start this week and last until

Price GBP/USD 21/12/2025

Weekly Pairs in Focus 21th to 26th December 2025 (Charts)

Created on December 21, 2025 The British pound has been all over the place during the work week, but it looks like we are seeing signs of hesitation more than anything else, with the 1.34 level offering a bit of resistance. At this point, this looks like a market where we could see US dollar

DraftKings enters Prediction Markets with new standalone mobile app

DraftKings enters Prediction Markets with new standalone mobile app

Sports betting and gaming company DraftKings Inc. (NASDAQ:DKNG), which has seen its stock hit recently as financial trading concerns such as Robinhood (NASDAQ:HOOD) encroach on its territory, has announced the launch of DraftKings Predictions, formally entering prediction markets under the oversight of the U.S. Commodity Futures Trading Commission (CFTC). DraftKings Predictions is a new standalone

Youtube preview

Ready to buy the dip? – Silver shows no sign of reversing [Video]

In today’s Market Outlook, let’s take a look at Forex Trading on Silver, XAGUSD, USDJPY, EURUSD, and the NASDAQ. The US Stock indices rose after a mixed NFP on Tuesday but fell dramatically after an AI-driven tech sell off. We talked about the fear of an AI bubble last time but will this affect the

Best Brokers 2025 - Investing.com

Best Brokers 2025 – Investing.com

Best Brokerage Accounts – Our Top Picks Plus500 Why Did We Pick It? Chosen as one of our top picks, Plus500 stands out for its user-friendly platform, competitive offerings, and strong regulatory backing. Its simplicity and accessibility cater to traders of all levels, with the proprietary WebTrader platform offering intuitive functionality. This approach resonates with those

Government officials pose for a photo before an inter-ministerial meeting on measures to strengthen foreign currency liquidity held at the government complex in Jongno District, central Seoul, on Dec. 18. From left, Financial Supervisory Service Gov. Lee Chan-jin, Deputy Prime Minister and Finance Minister Koo Yun-cheol, Financial Services Commission Chairman Lee Eog-weon and Bank of Korea Senior Deputy Gov. Ryoo Sang-dai. [YONHAP]

Gov’t to relax forex liquidity regulations to push U.S. dollars into market

Government officials pose for a photo before an inter-ministerial meeting on measures to strengthen foreign currency liquidity held at the government complex in Jongno District, central Seoul, on Dec. 18. From left, Financial Supervisory Service Gov. Lee Chan-jin, Deputy Prime Minister and Finance Minister Koo Yun-cheol, Financial Services Commission Chairman Lee Eog-weon and Bank of

USD/CAD Technical Outlook

USD/CAD Outlook: Pressured as Soft US Inflation Weighs on the Dollar

The USD/CAD outlook remains under pressure amid a cooling US CPI data. BoC’s paused easing cycle and stable crude oil prices continue to support the CAD. Market participants now await Canada’s retail sales report for fresh impetus. USD/CAD is under pressure as weaker US inflation data weighs down the dollar. The pair has been trading

EUR/USD Analysis Today 18/12: Future Fed Policies (Chart)

EUR/USD Analysis Today 18/12: Future Fed Policies (Chart)

Created on December 18, 2025 EUR/USD Analysis Summary Today Overall Trend: : Upward Technical Correction Support Levels for EUR/USD Today: 1.1700 – 1.1650 – 1.1570. Resistance Levels for EUR/USD Today: : 1.1800 – 1.1880 – 1.1940. EUR/USD Trading Signals: Buy EUR/USD from the support level of 1.1640 with a target of 1.1820 and a stop-loss

Gold Analysis 18/12: Attempts to Break Highs (Chart)

Attempts to Break Highs (Chart)

Created on December 18, 2025 Today’s Gold Analysis Overview: The overall of Gold Trend: Strongly bullish. Today’s Gold Support Points: $4300 – $4260 – $4170 per ounce Today’s Gold Resistance Points: $4370 – $4390 – $4460 per ounce Today’s Gold Trading Signals: Sell gold from the resistance level of $4400 with a target of $4200

USD/MYR Analysis 18/12: Additional Power and New Depths (graphs)

Additional Power and New Depths

Created on December 18, 2025 The USD/MYR is trading near the 4.0850 ratio as of this writing, a low during yesterday’s price action attained the 4.0770 mark which had last been seen in March of 2021. Traders who have had the tenacity to pursue the lower trend in the USD/MYR have likely been rewarded. Although

Bitget Launches Cross-Market Trading for Crypto Users Including Forex and Gold

Bitget Launches Cross-Market Trading for Crypto Users Including Forex and Gold

TLDR Bitget TradFi enables crypto users to trade forex, gold, and CFDs with USDT as margin. The platform offers up to 500x leverage on major FX pairs and commodities. Bitget’s new feature simplifies capital flow between crypto and traditional markets. TradFi operates under the regulation of the Financial Services Commission of Mauritius. Bitget has launched

0
Would love your thoughts, please comment.x
()
x