PLTR Stock Drops with Nasdaq: Defense Deals Can’t Shield Palantir from the Tech Rout

After two strong weeks on the back of major defense contracts, Palantir (PLTR) stock and Nasdaq tumble as broader tech markets falter.

Skerdian Meta3 min read

Register now to be able to add articles to your reading list.

” aria-hidden=”true”>

Palantir share price has fallen below $90

Quick overview

  • Palantir Technologies (PLTR) experienced a significant rally fueled by defense contracts, gaining over 35% in two weeks.
  • Despite positive news regarding a NATO contract, PLTR stock fell due to a broader tech market downturn, opening at $92.79.
  • The upcoming Q1 earnings report on May 5 is crucial for PLTR’s stock momentum, with expectations of 36% year-over-year revenue growth.
  • Palantir’s long-term strengths in defense and AI may not be enough to shield it from ongoing tech market volatility.

After two strong weeks on the back of major defense contracts, Palantir (PLTR) stock and Nasdaq tumble as broader tech markets falter.

Palantir’s Hot Streak Fueled by Defense Contracts

Palantir Technologies (PLTR) had been enjoying a bullish run over the past two weeks, gaining more than 35% off its April lows. The rally was largely sparked by a high-profile defense contract involving NATO and the U.S. military, positioning Palantir at the forefront of global security technology.

PLTR Chart Weekly – The Euphoria Has FadedChart PLTR, W1, 2025.04.21 18:01 UTC, MetaQuotes Ltd., MetaTrader 5, Demo

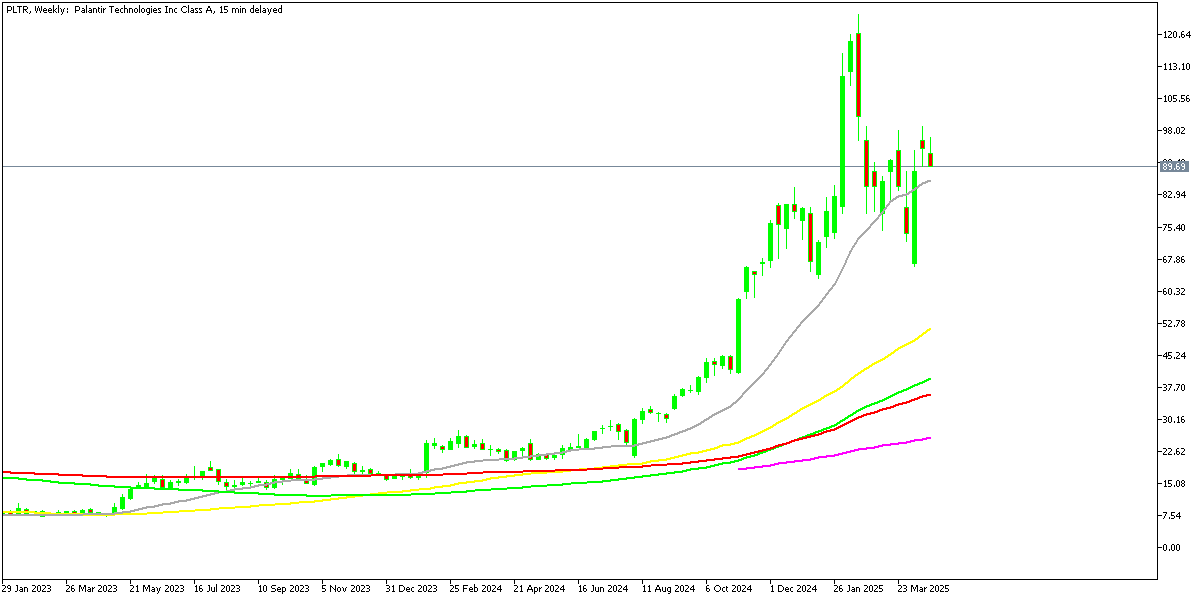
One of the key drivers was last week’s announcement that Palantir would roll out its Maven Smart System AI platform for NATO’s Communications and Information Agency (NCIA). The news sent PLTR shares up by 5% to $99, though the stock failed to break through the significant $100 resistance level. The contract reinforced Palantir’s emerging role as a critical AI partner in Western defense alliances, a position that has earned it considerable investor attention.

Tech Market Rout Reverses PLTR Momentum

Despite the positive news, Monday’s session opened on a downbeat note for Palantir, with broader market sentiment turning sharply negative. The Nasdaq 100 fell 3.5% intraday, weighed down by a wave of selling in major tech and semiconductor names like Nvidia (NVDA), Amazon (AMZN), and Tesla (TSLA).

PLTR opened with a bearish gap at $92.79, compared to Thursday’s close at $93.78. The downward trend continued through the session, with shares falling to $90.50 at the time of writing—erasing a portion of the recent rally.

Earnings in Focus: Can Q1 Results Sustain PLTR’s Rally?

Palantir’s upcoming Q1 earnings report, set for release on May 5, will play a critical role in shaping the next move for PLTR stock. Management has guided for 36% year-over-year revenue growth, matching the growth rate reported in Q4. While this suggests solid consistency in demand, the key question is whether Palantir can surprise to the upside.

Historically, Palantir has tended to deliver results that slightly outpace its own forecasts—often by 1 to 2 percentage points. If that trend continues, investors could be treated to stronger-than-expected numbers, potentially reigniting momentum following the recent dip.

However, market sentiment remains fragile, and even a slight miss—or conservative forward guidance—could trigger another pullback. All eyes will be on revenue growth, government contract pipeline updates, and any commentary related to AI integration and international expansion.

Trump Tariff Euphoria Fades, Dragging Down Stocks

Earlier this month, optimism returned to markets after U.S. President Donald Trump hinted at suspending tariffs on consumer goods, briefly lifting sentiment across tech and industrial sectors. Stocks rallied strongly in response, but that boost has since faded.

As risk appetite vanishes, equity indices are once again under pressure. The Dow Jones Industrial Average (DJIA), which had dropped over 20% between February and March, found technical support at its 200-week simple moving average (SMA). It rebounded in early April but failed to keep the gains.

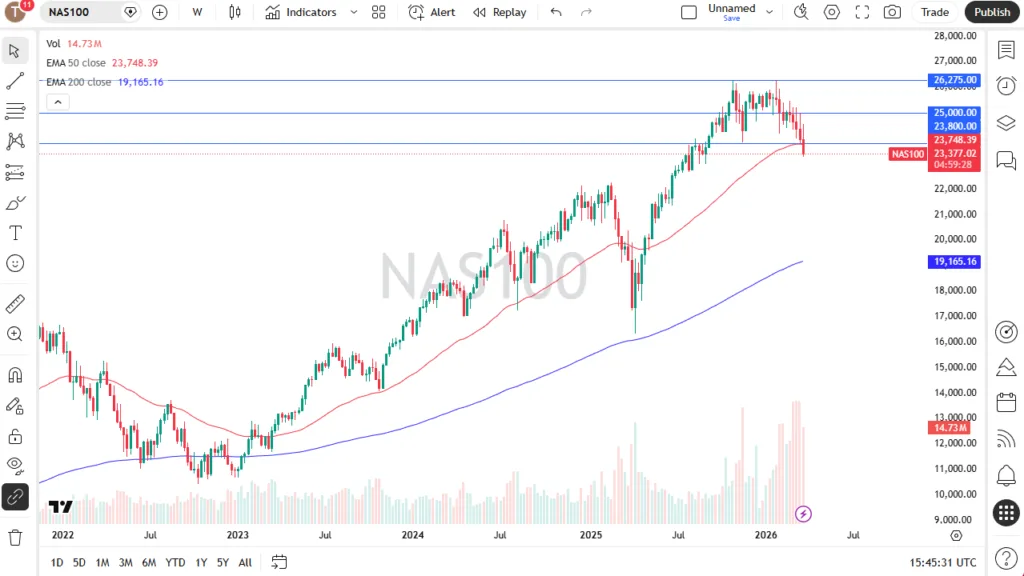
Nasdaq Chart Weekly  – Sellers Have Returned

Similarly, the Nasdaq Composite, which also corrected over 20% earlier in the year, bounced above its long-term 200-week SMA in April. Yet buyers failed to sustain momentum above the 20,000 threshold, and the index has since dropped below 18,000.

Conclusion: Can Palantir Hold Its Ground Amid Tech Turmoil?

Palantir’s long-term defense positioning and AI expertise remain key strengths, especially as geopolitical risks and national security investment continue to rise. However, the stock remains vulnerable to the broader tech selloff. If macro pressures continue to weigh on risk assets, PLTR may struggle to hold recent gains—even with strong fundamentals and government support. Investors will be watching closely to see if the $90 support level can hold in the coming sessions.

Nasdaq Live Chart

NAS100

Skerdian Meta

Lead Analyst

Skerdian Meta Lead Analyst.
Skerdian is a professional Forex trader and a market analyst. He has been actively engaged in market analysis for the past 11 years. Before becoming our head analyst, Skerdian served as a trader and market analyst in Saxo Bank’s local branch, Aksioner. Skerdian specialized in experimenting with developing models and hands-on trading. Skerdian has a masters degree in finance and investment.

Related Articles


Source link

Visited 1 times, 1 visit(s) today

Related Article

Weekly Forex Forecast - 29th March

Weekly Forex Forecast – 29th March

Fundamental Analysis & Market Sentiment I wrote on 22nd March that the best trades for the week would be: Long of the USD/JPY currency pair. This gave a win of 0.95%. Long of Brent Crude Oil but with ¼ of the normal position size. This gave a loss of 1.85%. Last week’s overall loss of

Table of prices Nasdaq 100 29/03/2026

Weekly Pairs in Focus 29th March to 3rd April 2026 (Charts)

Created on March 29, 2026 NASDAQ 100 The Nasdaq 100 initially tried to rally during the week but has collapsed as fear continues to grip the market. Interest rates in America continue to climb and we have now sliced through the crucial 23,800 level. We are below the 50-week EMA as well and quite frankly;

AUD/USD Daily Report - ActionForex

AUD/USD Daily Report – ActionForex

Daily Pivots: (S1) 0.6853; (P) 0.6907; (R1) 0.6941; More… Intraday bias in AUD/USD on the downside as this point. Fall from 0.7187 is seen as correcting the whole up trend from 0.5913. Deeper decline would be seen to 38.2% retracement of 0.5913 to 0.7187 at 0.6700. On the upside, though, above 0.6956 minor resistance will

EUR/AUD Daily Outlook - ActionForex

EUR/AUD Daily Outlook – ActionForex

Daily Pivots: (S1) 1.6651; (P) 1.6706; (R1) 1.6796; More… EUR/AUD’s rise from 1.6125 short term bottom continues today and intraday bias remains on the upside. Sustained break of 55 D EMA (now at 1.6755) will pave the way to 38.2% retracement of 1.8554 to 1.6125 at 1.7053. Nevertheless, below 1.6607 minor support will turn intraday

Trading app scams surge 1,400%: Millions of US investors at risk as trading interest soars, expert warns

Trading app scams surge 1,400%: Millions of US investors at risk as trading interest soars, expert warns

Beware of fakes and impersonations Scammers often create fake versions of popular trading platforms to trick users into sharing their personal information. With AI, these clones can be extremely convincing, replicating layouts, logos and even fake testimonials. Hence, always check the URLs carefully since scammers often use slightly altered domain names to catch careless users out.  If anything seems suspicious, change your

USD/CAD Weekly Outlook - ActionForex

USD/CAD Weekly Outlook – ActionForex

USD/CAD’s rebound from 1.3480 accelerated high last week. Initial bias stays on the upside this week for 38.2% retracement of 1.4791 to 1.3480 at 1.3981. Decisive break there will argue that it’s already reversing the whole down trend from 1.4791, and target 61.8% retracement at 1.4290. On the downside, below 1.3844 minor support will turn

EUR/GBP Weekly Outlook - ActionForex

EUR/GBP Weekly Outlook – ActionForex

EUR/GBP stayed in range trading above 0.8610 last week. Initial bias remains neutral this week first. On the upside, sustained break above 55 D EMA (now at 0.8680) will confirm short term bottoming, and bring stronger rebound back to 0.8788 resistance. However, rejection by 55 D EMA will set up another fall through 0.8611 to

GBP/JPY Weekly Outlook - ActionForex

GBP/JPY Weekly Outlook – ActionForex

GBP/JPY edged higher last week but failed to break through 213.28 resistance and retreated. Initial bias stays neutral this week first. On the upside, firm break of 213.28 will resume the rise from 207.20 to retest 214.98 high. However, break of 210.77 will bring deeper fall back to 209.15 support and below. In the bigger

USD/CHF Weekly Outlook - ActionForex

USD/CHF Weekly Outlook – ActionForex

USD/CHF’s rally from 0.7603 resumed last week by breaking through 0.7957. Initial bias stays on the upside for 38.2% retracement of 0.9200 to 0.7603 at 0.8213. For now, further rally is expected as long as 0.7833 support holds, in case of retreat. In the bigger picture, a medium term bottom should be in place at

USD/JPY Weekly Outlook - ActionForex

USD/JPY Weekly Outlook – ActionForex

USD/JPY’s rally from 152.25 resumed by breaking through 159.88 resistance last week. Initial bias remains on the upside and further rise should be seen to retest 161.94 high next. On the downside, below 159.35 minor support will turn intraday bias neutral first. But near term outlook will stay bullish as long as 157.49 support holds,

EUR/USD Weekly Outlook - ActionForex

EUR/USD Weekly Outlook – ActionForex

EUR/USD remains bounded in consolidations above 1.1408 last week and outlook is unchanged. Initial bias stays neutral this week first. Further decline is expected with 1.1666 cluster resistance (38.2% retracement of 1.2081 to 1.1408 at 1.1665) intact. On the downside, firm break of 1.1408 will resume the fall from 1.2081 to 38.2% retracement of 1.0176

AUD/USD Weekly Report - ActionForex

AUD/USD Weekly Report – ActionForex

AUD/USD’s extended decline last week should confirm medium term topping at 0.7187. Initial bias remains on the downside this week for 38.2% retracement of 0.5913 to 0.7187 at 0.6700. On the upside, above 0.6956 minor resistance will turn intraday bias neutral first. But risk will stay on the downside as long as 0.7187 resistance holds,

EUR/JPY Weekly Outlook - ActionForex

EUR/JPY Weekly Outlook – ActionForex

EUR/JPY’s rebound from 182.02 extended higher last week but retreated just ahead of 184.75 resistance. Initial bias remains neutral this week first. On the upside, break of 184.75 will resume the rise from 180.78 to retest 186.86 high. On the downside, however, below 183.17 minor support will turn bias back to the downside for 182.02

EUR/AUD Weekly Outlook - ActionForex

EUR/AUD Weekly Outlook – ActionForex

EUR/AUD’s extended rebound last week confirmed short term bottoming at 1.6125. Initial bias stays on the upside this week. Sustained break of 55 D EMA (now at 0.6756) will pave the way to 38.2% retracement of 1.8554 to 1.6125 at 1.7053. On the downside, below 1.6607 minor support will turn intraday bias neutral first. In

Quick Jumps and Fast Dives

Quick Jumps and Fast Dives

Created on March 26, 2026 Last Friday the NZD/USD was above 0.58900 a couple of times. The currency pair was within sight of the 0.61000 mark towards the end of January. On the 27th of February the NZD/USD was close to 0.60075. As of this morning the realm of 0.57860 is being seen with fast

GBP/USD Chart Alert: Bull Flag Pattern in Play Ahead of Retail Sales Data

GBP/USD Chart Alert: Bull Flag Pattern in Play Ahead of Retail Sales Data

GBP/USD is under pressure due to cautious market sentiment, USD strength stemming from Middle East ceasefire strains, and uncertainty following President Trump’s delay of Iran’s energy plant destruction. Technical analysis reveals a bull flag pattern on the H1 chart, suggesting a potential 100-pip rally If the price fails to clear the 200 SMA and breaks

GBP/USD Analysis 27/03: Pound Trades Near Fair Value (Chart)

Pound Trades Near Fair Value (Chart)

Created on March 27, 2026 British pound continues to see a lot of noisy sideways trading. British pound dropped initially during the trading session on Thursday but has turned around to show signs of life again as the market continues to bang around in a fairly well-defined range. The 200-day EMA sits right about where

USD/CAD Daily Outlook - ActionForex

USD/CAD Daily Outlook – ActionForex

Daily Pivots: (S1) 1.3820; (P) 1.3844; (R1) 1.3886; More… USD/CAD’s rally from 1.3480 is in progress and intraday bias remains on the upside. It’s seen as correcting the whole down trend from 1.4791 and should target 1.3927 resistance, or probably further to 38.2% retracement of 1.4791 to 1.3480 at 3981. On the downside, below 1.3816

L&G Asset Management global head of trading appointed global head of markets

L&G Asset Management global head of trading appointed global head of markets

Ed Wicks has been promoted to head of global markets at Legal & General Asset Management, a newly created role for the firm.   Wicks’ promotion marks an extension of his ongoing eight-year long tenure at the asset manager, having initially joined in 2015 as head of equity trading.   He later stepped up as global head

0
Would love your thoughts, please comment.x
()
x